Article Text

Abstract
Aim To correlate light increment sensitivity (LIS) and visual acuity (VA) with birth weight (BW), gestational age (GA) and stage of acute retinopathy of prematurity (ROP) (STG) in premature children at school age.
Methods 180 children (150 former prematures and 30 age-matched term-born children) were enrolled at age 6–13 years. Former prematures were categorised by the results of the initial ROP screening based on digital wide-field fundus imaging: absence of ROP (n=100) and spontaneously resolved ROP (n=50). The latter group was further subdivided according to their STG (Stg 1; Stg 2; Stg 3). Both groups were categorised into sectors by BW (<1000 g; 1000–1500 g; >1500 g), and GA (≤28 weeks; >28<32 weeks; ≥32 weeks). VA was assessed with Early Treatment of Diabetic Retinopathy Study letters, LIS was measured at 0°, 2.8° and 8° in the visual field (Microperimeter MP1, Nidek Technologies), and spherical equivalent refraction assessed with a Nidek autorefractor (Nidek, Italy).
Results Central and pericentral LIS (0° and 2.8°) and VA were significantly lower in all groups and sectors compared with term-born controls except for BW >1500 g for LIS and GA >28 to <32 W for VA. No significant differences were found for LIS at 8° in all groups. No correlation was found between LIS and VA on an individual basis.
Conclusions Low BW, GA and increasing severity of spontaneously resolving ROP were associated with significantly decreased central visual function. In addition to VA, LIS measurement further describes foveal function and is a unique parameter to assess parafoveal function.
- Retina
- Child health (paediatrics)
- Diagnostic tests/Investigation
- Macula
- Optics and Refraction
Statistics from Altmetric.com
Introduction
Neonatal intensive care has improved dramatically over the last 30 years, leading to increased survival rates of preterm infants and even of those with birth weights (BWs) <1000 g.1 The immature state of the retina at birth in these extremely preterm infants often results in an altered foveal morphology.2–4 It remains unclear how long it lasts until the foveal region reaches maturity and which factors may prohibit complete foveal maturation in extremely premature infants over time.5–8
Retinopathy of prematurity (ROP) is a typical complication in very preterm infants with a multifactorial pathogenesis that is tightly related to the immaturity of the organ system.9–11 Major risk factors for ROP include low gestational age (GA) at birth10 and low BWs.9 ,11 International committees have developed standardised classification systems, such as the International Classification of Retinopathy of Prematurity in 1984, which was revised in 2005,12 ,13 and the Early Treatment of Retinopathy of Prematurity (ETROP) guidelines.14
Long-term functional consequences of prematurity of the retina alone or the presence of ROP have been analysed in several large studies, for example, in a large population-based study in Sweden,15–19 in the Cryotherapy for Retinopathy of Prematurity Study (CRYOROP) study20 ,21 or in the ETROP study.22–24 Classic read-out parameters are visual acuity (VA) and the prevalence of high refractive errors, strabismus and amblyopia. Often, low BW and GA as well as increasing severity of ROP are risk factors for an unfavourable ocular outcome for these parameters.25–33
However, all these parameters describe the function of photoreceptors in the centre of the fovea but do not allow retrieval of functional information about parafoveal or more peripheral photoreceptors. With the advent of early retinal morphological data in premature infants with and without ROP seen with spectral domain optical coherence tomography (SD-OCT), this kind of information becomes increasingly interesting.34 ,35 Fundus-controlled perimetry provides a measurement of the light increment sensitivity (LIS) at defined loci within a 25° visual field and has allowed to detect small deficits in visual function in the parafoveal and macular area in other patient cohorts.36 ,37
The present study was launched in 2011 in order to investigate the long-term functional and morphological outcome in former preterm infants with well-characterised retinal morphology at time of initial ROP screening. Here, we present the results of the functional analysis of the central retina (LIS, VA) at school age and correlated them with ROP risk factors at birth and presence of ROP at time of initial ROP screening. For the first time in a large cohort study of former premature infants, fundus-controlled perimetry data reveal functional information not only within the foveal centre but also in adjacent parafoveal and macular areas.
Methods
Patients
The present study is a long-term follow-up study of prematurely born participants from a multicentre field study between 2001 and 2007.38 All children included in the present study were imaged at the time of the ROP screening by digital wide-field retinal imaging (RetCam I, Massie Lab, California, USA), which provides objective documentation of an eventual ROP. In the present study, only children without apparent psychological or neuronal disorders, neonatological hypoglycaemia, intraventricular haemorrhage or severe birth asphyxia-related hypoxic ischaemic encephalopathy were included, and all children attended regular schools and showed no significant deficiencies in basic literacy and numeracy. Parents were also specifically asked as to early childhood development and performance at school. All perinatal data and digital fundus images were available from the original field study.38
Healthy age-matched subjects were recruited from the local population, who had no history of ocular abnormalities, strabismus, amblyopia or high refractive errors, and who were capable of performing all tests in this study.
Fundus-controlled perimetry
The MP1 images the fundus in real time with an infrared fundus camera and allows with an automated tracking system compensating for eye movement during examination. Fixation target and stimuli appear on a liquid crystal display within the MP1 and are imaged back along the same optical path onto the retina. For all conditions, background luminance was 1.27 cd/m2. Test targets could be attenuated in steps of 1 dB (0.1 log) from maximum brightness (127 cd/m2, defined as 0 dB for white) down to 20 dB, that is, the background luminance. Refractive errors were compensated within the system of the instrument.
Stimuli were presented in a slightly darkened room to the better seeing eye at 17 positions of a customised pattern covering the posterior pole of the retina up to 8° eccentricity (figure 1A). The pupil was left undilated. LIS thresholds were determined with a 4-2 staircase strategy. Results of the left eye were mirrored along the vertical axis to be comparable to those of the right eye. Subjects were asked to fixate a custom-made red X, 10° in diameter (figure 1A). Gaps within the X allow projecting stimuli in the centre of fixation or at parafoveal positions without interfering with the fixation target. Initially, fixation stability derived from tracking was continuously recorded for 5 s. Thereafter, fixation was recorded during stimulus presentation and mapped. The examination started always with stimuli-sized Goldmann III (25.7 min of arc), followed by a second examination with stimuli-sized Goldmann I (6.45 min of arc) according to ref. 36 Because of the ceiling effect in measurements with Goldmann III stimuli, testing this stimulus size was used for training and familiarisation with the test. Only Goldmann I stimuli provided reliable LIS thresholds.36 The examination was repeated if the false positive answers (optic-nerve head tests) reached a critical limit of 50%.

Light increment sensitivity (LIS) data. (A) Stimulus pattern of the data points in the visual field at 0°, 2.8° and 8° eccentricity. All points of a given eccentricity (n=8) were added up to get a medium value and SD. (B) LIS data for the different study groups at 0°, 2.8° and 8° eccentricity. (C and D) Correlation of LIS with birth weight (BW) at central (0°, C) and pericentral (2.8°, D) location. (E and F) Correlation of LIS with gestational age (GA) at central (0°, E) and pericentral (2.8°, F) location. Significant correlations are marked (*corresponds to p<0.05), all other combinations corresponds to p>0.05. no-ROP, without resolved retinopathy of prematurity; sr-ROP, spontaneously resolved retinopathy of prematurity; Term, term-born children.
Visual acuity
The Early Treatment of Diabetic Retinopathy Study acuity charts were used to assess VA throughout the study.39 Only one eye that provided the best results from each participant was included. Landolt C ring testing (a standardised procedure following the EN ISO 8596 norm) was used as internal control. Refractive data were assessed with a Nidek Autorefraktor (Nidek, Italy) 30 min after application of cyclopentolate 1% eye drops.
Statistical analysis
Statistical analysis was done with Sigma Plot 12.0 (Systat Software GmbH Erkrath, Germany). One way-analysis of variance was applied to test for significant differences among the different ROP groups and term-born controls. Multiple comparison tests (Holm–Sidak or Dunn's method) were applied when testing for statistical differences between the groups and sectors (BW, GA or STG). Statistical significance was assumed at p<0.05. Pearson product moment correlation was applied when analysing the linear dependence between VA and central LIS.
Results
Patient statistics
The analysis presented here is based on the examination of 180 school-aged children (aged 6–13 years, mean 9.2 years). Children born prematurely were grouped by the results of the ROP screening at 32 weeks of postmenstrual age and subsequent follow-up examinations into children without apparent ROP (no-ROP; n=100) and those with spontaneously resolved ROP (sr-ROP; n=50). The group sr-ROP was further divided into subgroups according to stages of ROP (Stg 1; Stg 2; Stg 3). Of the 50 children, maximum stage 1 ROP was detected in 21 children (zone II: n=16; zone III: n=5), another 21 children had stage 2 ROP (zone II: n=17; zone III: n=4) and 8 children had stage 3 ROP (zone II: n=7; zone III: n=1; no plus). All children from both groups were also further divided into sectors according to BW (>1500 g, 1000–1500 g, <1000 g) and GA (≥32 weeks, >28 to <32 weeks, ≤28 weeks).
Demographic data of the enrolled participants are shown in table 1. Both groups, no-ROP and sr-ROP, showed significant differences among each other concerning mean BW and mean GA, which is in accordance with the higher risk for developing any kind of ROP at low BW and low GA. Spherical equivalent refraction only slightly differed between the no-ROP and sr-ROP group.
Demographic data of the study participants
Light increment sensitivity
All children completed the examination procedure of fundus-controlled perimetry with both Goldmann III and Goldmann I stimuli. When comparing LIS depending on eccentricity between the three groups, we found that the foveal LIS (0°) was significantly lower in the no-ROP and sr-ROP-group compared with the term group (figure 1B). Likewise, the parafoveal LIS (2.8°) showed significant differences between the sr-ROP group compared with the term group. No significant differences were found at 8° between any of the investigated groups (figure 1B).
When analysing the impact of BW, central LIS (0°) was significantly lower for all subjects within the sectors <1000 g and 1000–1500 g, but was unchanged for all subjects in the sector >1500 g compared with term-born children (figure 1C). Pericentral LIS (2.8°) was significantly lower for all subjects within the sectors <1000 g and 1000–1500 g, but was unchanged for the no-ROP group in the sector 1000–1500 g and all subjects in the sector >1500 g compared with term-born children (figure 1D). The peripheral LIS (8°) remained stable und showed no significant change to the term group (data not shown).
Concerning the impact of age, participants in the ≤28 weeks sector had significantly reduced LIS compared with term-born children at 0° and 2.8° (figure 1E, F).
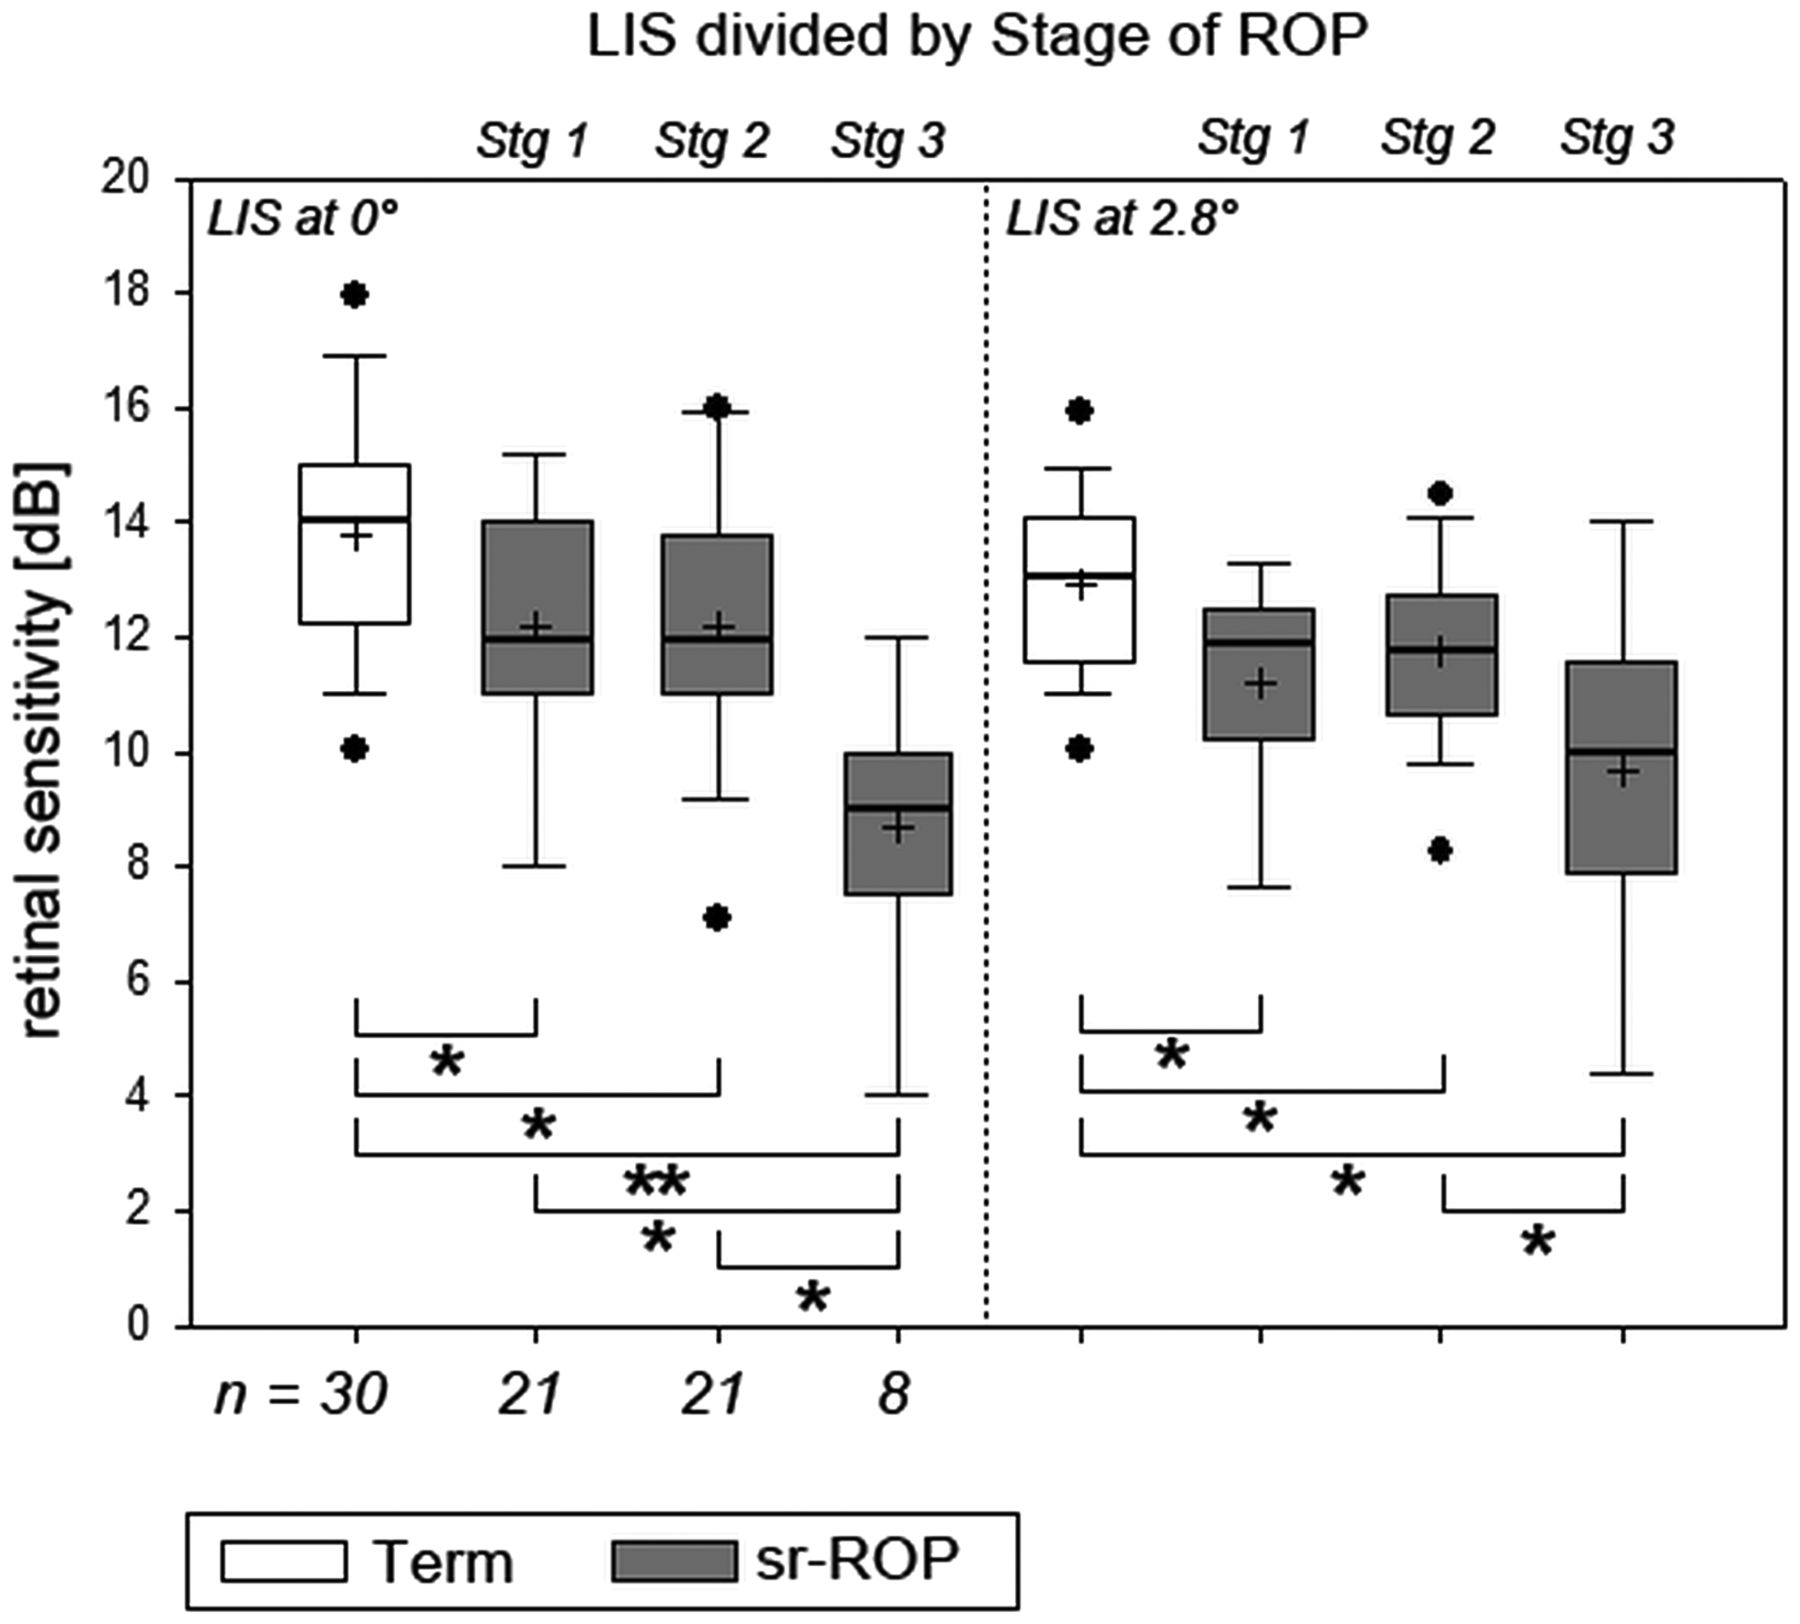
The impact of the ROP stage on LIS is shown in figure 2. LIS at 0° and 2.8° was significantly reduced in all subgroups compared with the term-born children. Interestingly, the Stg 3 subgroup was significantly reduced compared with both Stg 1 and Stg 2 subgroups at 0° and significantly reduced compared with Stg 2 subgroup at 2.8°.

Correlation of light increment sensitivity (LIS) with stage of retinopathy of prematurity (ROP). Significant correlations are marked (*corresponds to p<0.05), all other combinations corresponds to p>0.05. sr-ROP, spontaneously resolved retinopathy of prematurity; Term, term-born children.
Visual acuity
VA was found to be significantly reduced in both groups (no-ROP and sr-ROP) compared with term-born children (figure 3A), but did not differ significantly among each other.
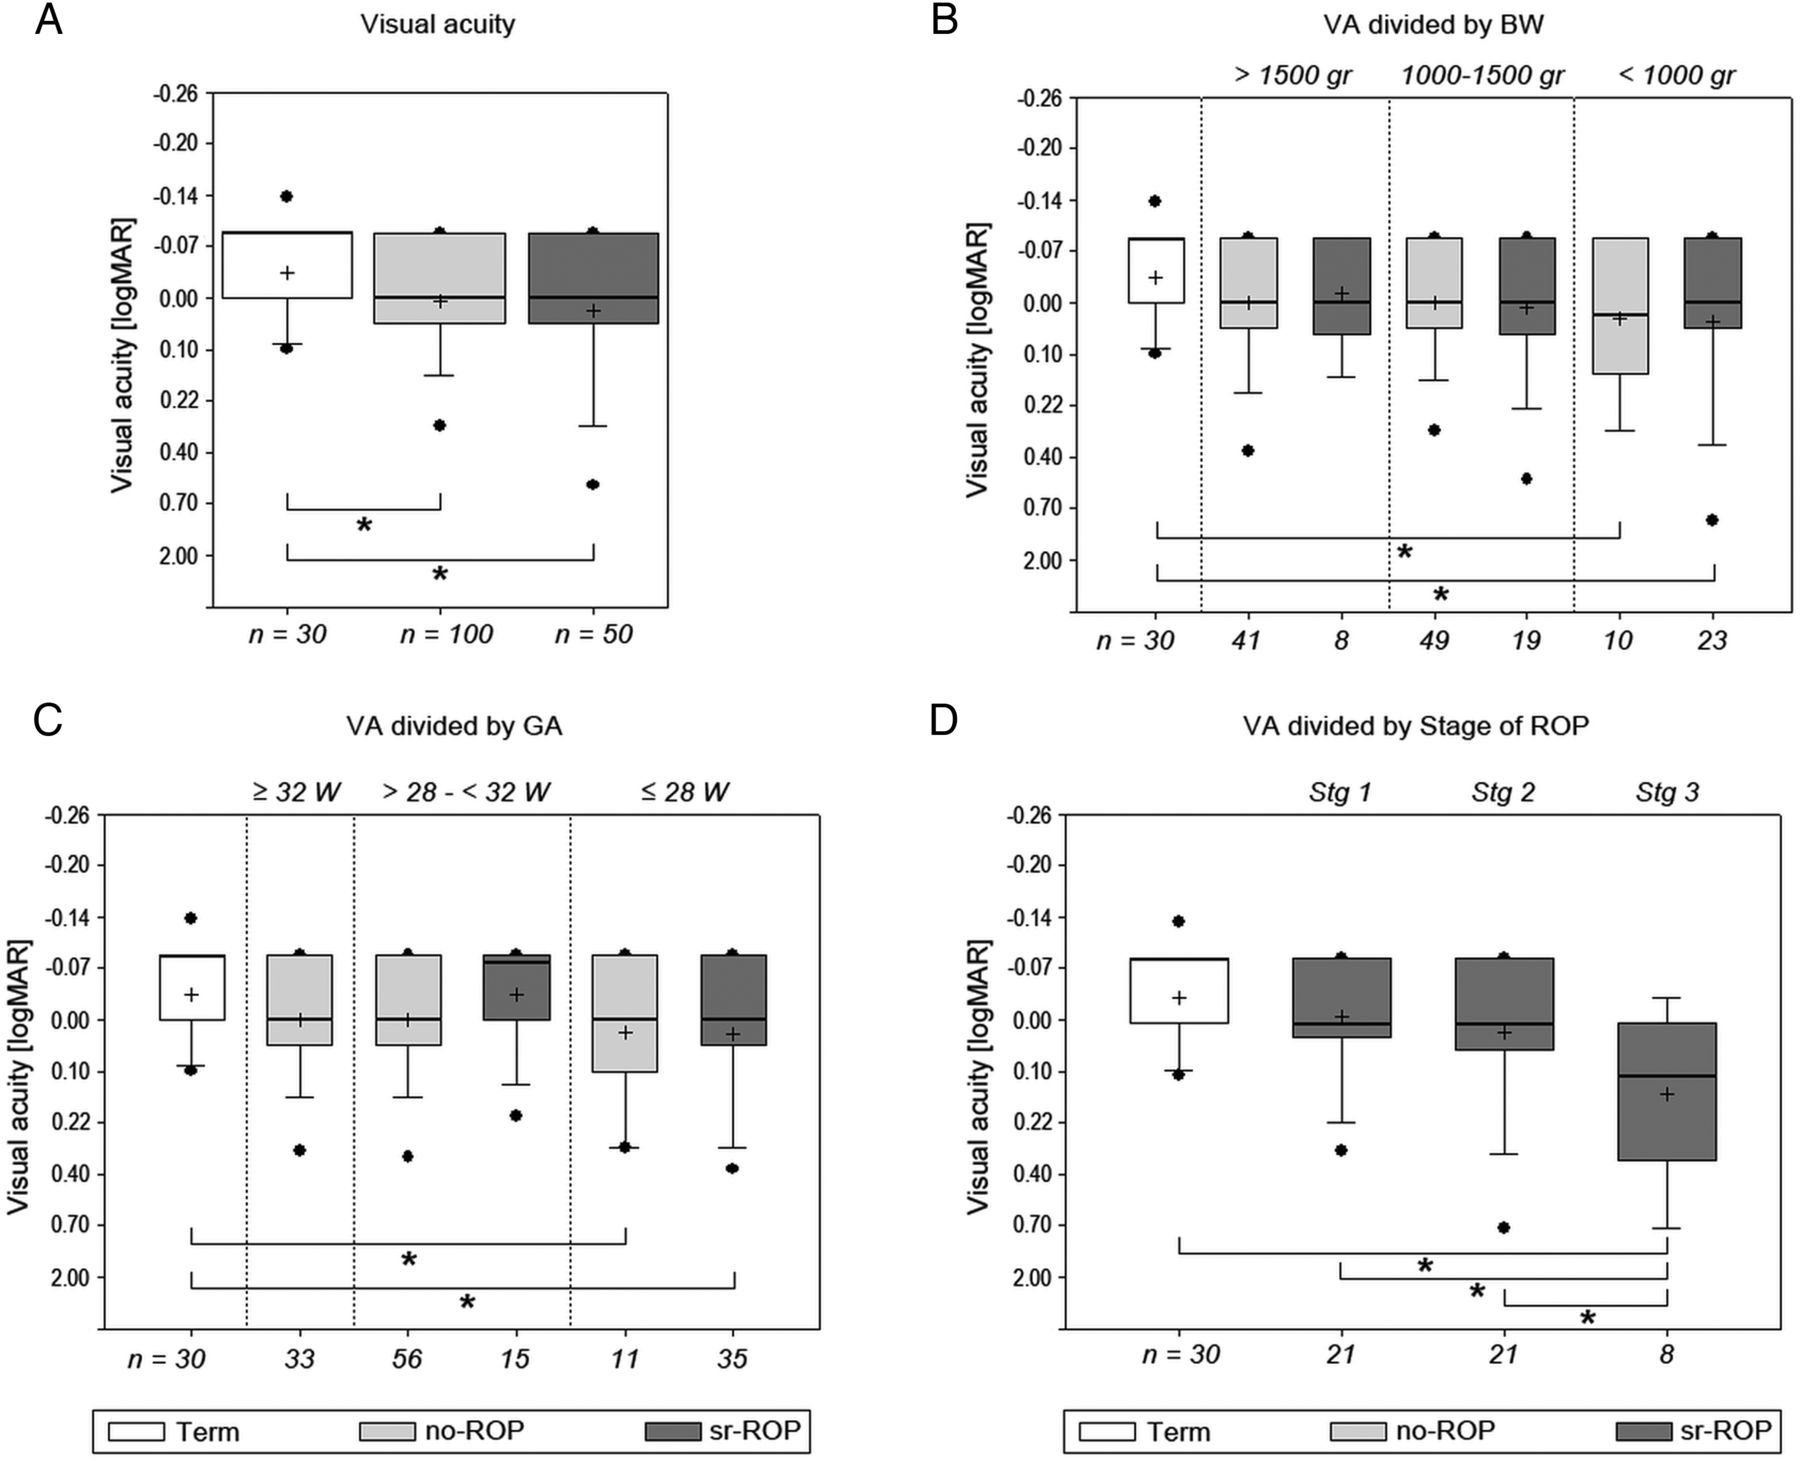
Visual acuity (VA) data. (A) VA data for the entire groups compared with term-born children. (B) VA data for the different study groups in relation to birth weight (BW). (C) VA data for the three different study groups relation to gestational age (GA). (D) VA data for the three study groups in relation to stages of retinopathy of prematurity (ROP). Significant correlations are marked (*corresponds to p<0.05), all other combinations corresponds to p>0.05. no-ROP, spontaneously resolved retinopathy of prematurity; sr-ROP, spontaneously resolved retinopathy of prematurity; Term, term-born children.
When analysing the impact of GA and BW, VA was significantly lower in the sectors <1000 g and ≤28 weeks compared with term-born children (figure 3B, C).
Multiple comparison analysis among the groups (no-ROP, sr-ROP, term) and sectors (BW and GA) revealed for the sectors <1000 g BW and ≤28 weeks GA that the affiliation to a certain ROP group did not result in significant differences in VA. Only the comparison against term-born children was significant.
The analysis of the dependence of stage of ROP on VA is shown in figure 3D. The VA in the Stg 3 subgroup was significantly reduced compared with the term-born children and the Stg 1 and 2 subgroups.
Correlation of central LIS and VA
Because central LIS and VA data both were reduced with increasing immaturity of the infant and severity of ROP compared with term-born children, we analysed whether these data correlated also on an individual basis (figure 4). We could not detect a significant relationship for participants in any group.

Correlation of visual acuity (VA) and light increment sensitivity (LIS) data on an individual basis. Data of all participants are shown in a scatter plot with 95% confidence ellipse for the different study groups. Pearson's r for every group was <0.05, indicating that no linear correlation exists between VA and central sensitivity (LIS). logMAR, logarithm of the minimum angle of resolution; no-ROP, spontaneously resolved retinopathy of prematurity; sr-ROP, spontaneously resolved retinopathy of prematurity; Term, term-born children.
Discussion
This paper describes the results of LIS and VA in former premature infants compared with term-born children at the age of 6–13 years. For the first time, we show LIS data correlated with BW and GA at birth, and in relation to the severity of ROP as verified by digital wide-field fundus imaging, and compare these results with VA data. The two data sets revealed matching information concerning the overall reduced function of foveal photoreceptors in very premature children.
VA data of former premature infants obtained in a large number of studies are considered to be the standard parameter to describe foveal function.15–24 However, with the recent growth of data describing morphological alterations, such as delayed or incomplete foveal development, arrest of centrifugal inner retinal layer migration or sparing of photoreceptor development, VA data alone may not be sufficient to allow in-depth functional–morphological correlations.40 Therefore, our LIS data at 0° further describe foveal function in addition to VA, and LIS at 2.8° and 8° enlarge the functional data set to parafoveal and more peripheral locations.
Interestingly, the foveal and parafoveal LIS (0 and 2.8°), but not the peripheral LIS (8°), were slightly but significantly reduced in former prematures compared with term-born children. The sectors with the lowest BW or the lowest GA displayed significantly reduced LIS for all groups compared with term-born children, indicating that both factors are the most critical parameters in the development of foveal function. On the other hand, the reduction of LIS in these two sectors with lowest BW or GA was not correlated with the severity of ROP, indicating that ROP stages are only an additional parameter in the development of foveal function.
Peripheral (8°) LIS was not altered in former preterm infants in our study, which may indicate that the immaturity of the retina is restricted to the foveal pit, with normal peripheral retinal function. Detailed analysis of early and follow-up retinal imaging data may help get further insight and is part of ongoing investigations. The value of information on retinal function close to the fovea has been demonstrated in other disorders, where small and locally limited pathologies remained undetected when testing VA alone.36 ,37
The VA data of our study show a general reduction of foveal function in prematurely born children compared with the control group. The reduction increased with the severity of acute ROP. These results are in line with previous population-based studies. Holmström and colleagues reported a prevalence of poor vision of 34% for a VA of <20/28 in the no-ROP group and 61% in the group with ROP at 4.5 years, and an increased risk for visual dysfunction in children with a history of ROP at 10 years.19 In a study with 24 former premature infants, Bonotto and colleagues reported a VA of 20/20 in 87% for sr-ROP and 100% for no-ROP.41 Furthermore, Villegas and colleagues observed that only 64% (n=28) of 44 former premature infants had 20/40 VA or better at the age of 2–18 years.40
All these data and ours show that prematurity by itself is a risk factor for reduced VA and the presence of ROP increases the risk for poor vision. However, when looking at the two sectors lowest BW and lowest GA, no significant differences were observed between the groups sr-ROP and no-ROP, indicating that, similarly to the LIS data at 0°, BW and GA are the most critical parameters for the determination of highly precise foveal function, and the presence of spontaneously resolving ROP is only a minor parameter in this regard.
Interestingly, while the observed correlations were true for the entire groups, individual results did not show an evident correlation between central LIS (0°) and VA. VA defines the capacity of the central visual system to discriminate contrast variation and is different from LIS, which defines the capacity to discriminate a light stimulus from the background.42 Maximum LIS depends on the location of the retina that is tested. Since we used bright mesopic conditions and a Goldmann I stimulus at 0° eccentricity, the detected LIS represents the cone visual system, similar to VA. An indication of the reason of the reduced LIS compared with term-born infants could be differences in morphology on SD-OCT suggestive of photoreceptor immaturity in premature infants.34 Correlation of LIS and VA has been performed with varying degrees of success in a number of pathologies, including diabetic macular oedema, idiopathic epimacular membrane or idiopathic macular telangiectasia.37 ,43–45 However, since all of these studies used the Goldmann III stimulus, ceiling effects during the tests cannot be excluded,36 rendering a comparison with our data difficult. Nonetheless, since both techniques, LIS and VA, describe different qualities of photoreceptor function in the fovea, lack of a direct correlation may not be surprising but opens the range for more functional entities that can be described. For example, a study on factors affecting the reading speed in patients with diabetic macular oedema found that this speed was reduced in those patients treated with laser photocoagulation and correlated significantly with decreased central LIS values and reduced contrast sensitivity, but not VA.46
Our results suggest that foveal function is impaired in children with a history of low BW and/or GA at birth, regardless of the development of an acute ROP. The severity of ROP should be considered as an additional factor that may worsen the visual outcome. We postulate that delayed foveal maturation may be an important factor for the development of optimal central visual function and LIS.
References
Footnotes
Contributors BL and MA-D designed the study. WB, KH, SS, CF and MA-D conducted the study and collected data. KS, WB, KH, SS and BL interpreted the data. KS, WB and BL drafted the work and revised it.
Competing interests None declared.
Patient consent Informed consent was obtained from all parents and informed assent from all children participating in the study.
Ethics approval The present study followed the tenets of the Declaration of Helsinki and was approved by the Ethics Committee of the Justus-Liebig-University of Giessen (Az 150/09).
Provenance and peer review Not commissioned; externally peer reviewed.
Linked Articles
- At a glance