Article Text

Abstract
Aim To analyse the repeatability of vessel density (VD) measurements using optical coherence tomography angiography (OCTA) in patients with retinal diseases.
Methods Two consecutive VD measurements using OCTA were analysed prospectively in patients with retinal diseases (diabetic macular oedema (DME), retinal vein occlusion (RVO) with macular oedema, epiretinal membrane (ERM), wet age-related macular degeneration (AMD)). The intraclass correlation coefficient (ICC), coefficient of variation (CV) and test-retest SD of VD measurements were assessed, and linear regression analyses were conducted to identify factors related to repeatability.
Results A total of 134 eyes were analysed involving 20 eyes with DME, 44 eyes with RVO with macular oedema, 50 eyes with ERM and 20 eyes with wet AMD. The mean age was 64.9 years, and the mean best-corrected visual acuity (BCVA) was 0.24. The mean central macular thickness (CMT) was 391.6 µm, and the mean ganglion cell-inner plexiform layer (GC-IPL) thickness was 61.4 µm. In all four diseases, the ICC and CV of the full VD were 0.812 and 6.72%, respectively. Univariate analyses showed that the BCVA (B, 8.553; p=0.031), signal strength (B, −1.688; p=0.050), CMT (B, 0.019; p=0.015) and mean GC-IPL thickness (B, −0.103; p=0.001) were significant factors that affected the repeatability. Multivariate analyses of these factors showed a significant result for the GC-IPL thickness.
Conclusions Measurements of the VD using OCTA showed relatively good repeatability for various retinal diseases. The BCVA, signal strength, CMT and GC-IPL thickness affected the repeatability, so these factors should be considered when analysing the VD.
- repeatability
- vascular density
- GC-IPL
- OCT angiography
This is an Open Access article distributed in accordance with the terms of the Creative Commons Attribution (CC BY 4.0) license, which permits others to distribute, remix, adapt and build upon this work, for commercial use, provided the original work is properly cited. See: http://creativecommons.org/licenses/by/4.0/
Statistics from Altmetric.com
Introduction
Imaging of the retinal microvasculature is essential for the diagnosis, follow-up and treatment of many types of retinal diseases, so retinal microvasculature has been studied using various techniques such as histological methods, fluorescein angiography (FA) and confocal scanning laser ophthalmoscopy with adaptive optics.1 2 Especially, FA has been the gold standard for the assessment of retinal vascular disease, but it is invasive, time-consuming and difficult to observe the retinal microvasculature because of the diffusion of the dye.
Optical coherence tomography angiography (OCTA) has recently been developed, and it is non-invasive, depth-resolved and able to repeatedly measure the retinal microvasculature. OCTA enables visualisation of the microvascular flow in the retina by comparing the signal in consecutive B-scans at the same location to reveal the motion of erythrocytes. Because of its high axial resolution, OCTA is able to visualise the fine retinal vasculature in multiple layers, which is impossible using FA.3 OCTA also provides quantitative metrics about the retinal microvasculature, so it can help identify subclinical retinal vascular diseases and can assist in the diagnoses and follow-ups of many types of retinal diseases.4 5
The Cirrus HD-OCT 5000 with AngioPlex software (Carl Zeiss Meditec, Dublin, California, USA; V.10.0) automatically provides quantitative measurements of the vessel density (VD), perfusion density (PD) and foveal avascular zone (FAZ) area of the superficial capillary plexus. These metrics can be useful in clinical practice for patients with many types of retinal diseases, but establishing the repeatability of these measurements is critical for its use in clinical situation. Various studies have reported the repeatability of OCTA measurements in the normal eye, but studies seem insufficient regarding the repeatability in patients with retinal diseases.6–11
Therefore, in the present study, we determined the repeatability of VD measurements using OCTA in patients with diabetic macular oedema (DME), retinal vein occlusion (RVO) with macular oedema, epiretinal membrane (ERM) and wet age-related macular degeneration (AMD), which are relatively common in clinical field, and identified factors affecting the repeatability of these measurement.
Materials and methods
Patients
This study adhered to the tenets of the Declaration of Helsinki and was approved by the Institutional Review Board of Chungnam National University Hospital in the Republic of Korea. Patients who visited our retinal clinic from May 2017 to December 2017 were analysed prospectively and patients with DME, RVO with macular oedema, ERM and wet AMD were recruited for the study. Patients who had any intraocular surgery except cataract surgery were excluded. In each visit, a detailed history, best-corrected visual acuity (BCVA), intraocular pressure using noncontact tonometry, spherical equivalent, axial length using an IOL master (Carl Zeiss, Jena, Germany), mean central macular thickness (CMT) and ganglion cell-inner plexiform layer (GC-IPL) thickness using the Cirrus HD-OCT 5000 (Carl Zeiss Meditec) were determined.
OCTA imaging protocol
Two consecutive OCTA images were obtained using the Cirrus HD-OCT 5000 along with AngioPlex software (Carl Zeiss Meditec) by a single skilled examiner. AngioPlex obtains high resolution microvascular images of the retina and choroid using a centre wavelength of 840 nm, taking 68 000 A-scans per second. The instrument provides sensitivity and accuracy by incorporating the optical microangiography (OMAG) algorithm and retinal tracking technology. We measured a foveal centred scan area of 3×3 mm pattern, and all scans were analysed using en face OCTA images generated automatically by the OMAG algorithm used in Angioplex software. The VD (defined as the total length of perfused vasculature per unit area in the region of measurement) of the superficial layer was measured automatically by the software, which quantified the VD of a local region of tissue according to the Early Treatment of Diabetic Retinopathy Study subfields (figure 1). The superficial layer is defined as the layer which starts from the internal limiting membrane (ILM) to the inner plexiform layer (IPL). The IPL boundary is calculated as 70% of the distance from the ILM to the estimated boundary of the outer plexiform layer, which is determined as being 110 µm above the retinal pigment epithelium boundary as automatically detected by the software. We did not conduct manual adjustment because we planned to analyse the repeatability of VD measured by AngioPlex software automatically. In this study, we analysed the VD of each sector, inner ring and full area in 3×3 mm rings and excluded OCTA images with a signal strength <7.
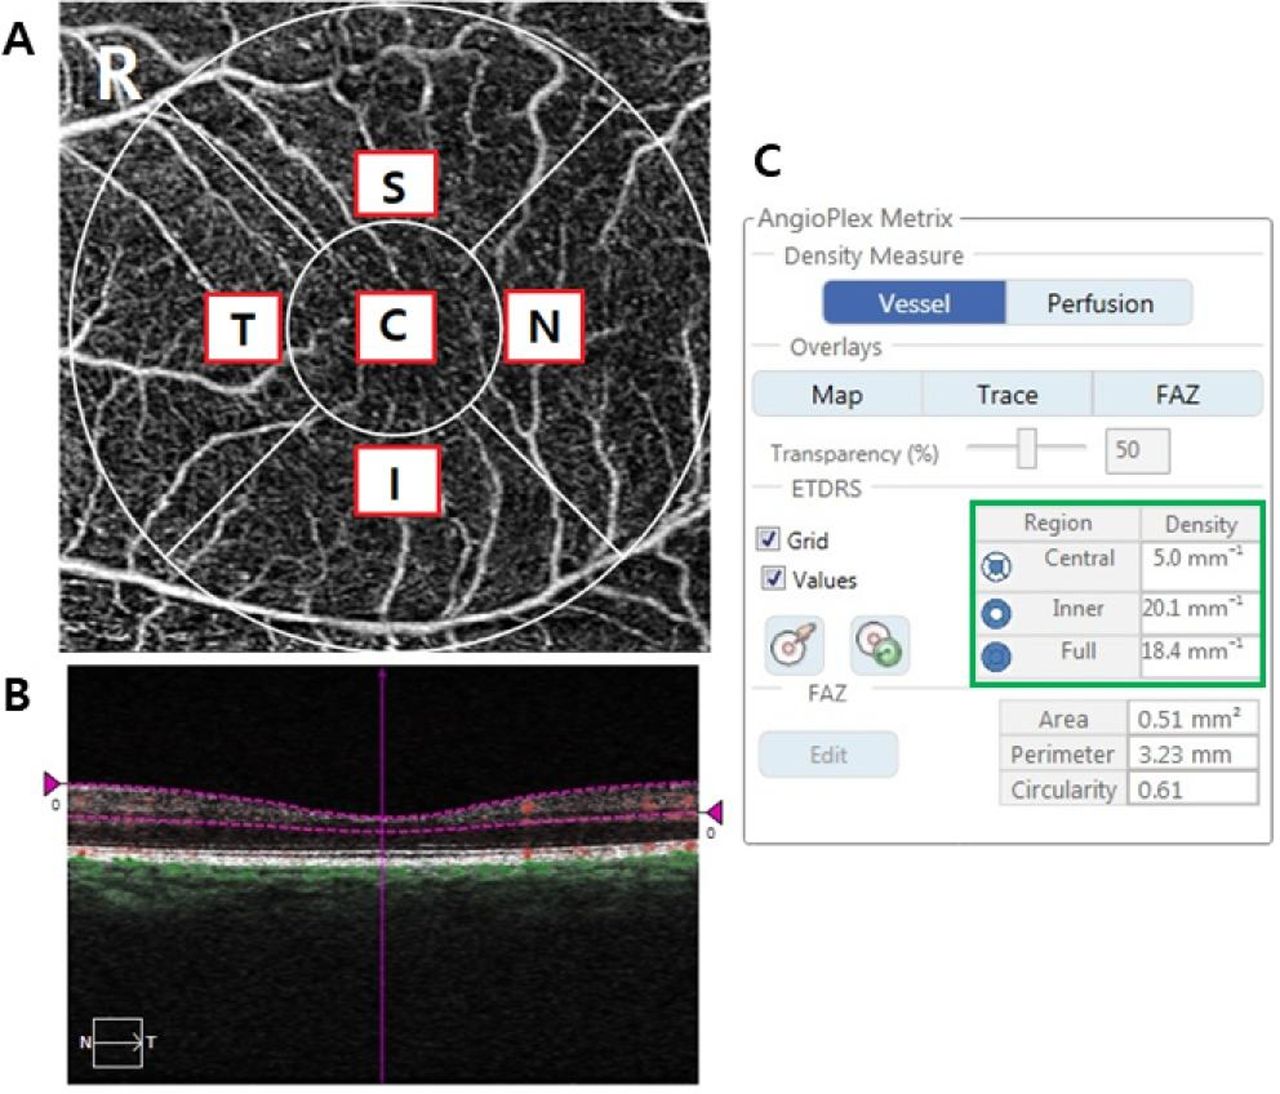
3×3 mm optical coherence tomography angiography image centred on the fovea. (A) The en face image of the superficial layer overlaid with the Early Treatment of Diabetic Retinopathy Study grid. The measurement tool (AngioPlex software, V.10.0; Carl Zeiss Meditec) provided vessel density measurements in individual subfields. (B) A horizontal OCT scan showing the reference plane of the superficial retinal layer between the purple dash lines. The green box shows quantitative measurements of the vessel density of the central, inner and full area in C. OCT, optical coherence tomography.
Statistical analysis
To analyse the repeatability of the VD in patients with retinal diseases, we calculated the intraclass correlation coefficient (ICC), coefficient of variation (CV) and test-retest standard deviation (TRTSD) of the full VD. The ICC, the ratio of the subject variance to the total variance, close to 1 means that the variance is low in the same examination. The CV (%) was calculated as 100 × SD/overall mean, and a value <10% means good repeatability of the measurement. TRTSD was calculated as the square root of the within-subject mean square for error. The agreement between two measurements was evaluated using Bland-Altman plots.
To identify factors affecting the repeatability of VD measurements, linear regression analyses were conducted for the CV of the full VD by investigating demographic and ocular variables. Multivariate analyses were performed for significant values of p<0.05 obtained by univariate analyses.
Results
Demographics and main clinical data
A total of 134 eyes were examined: 20 eyes with DME, 44 eyes with RVO with macular oedema, 50 eyes with ERM and 20 eyes with wet AMD. The mean age was 64.9 years, the mean BCVA was 0.24, the mean spherical equivalent was −0.16, the mean axial length was 23.7 mm, the mean CMT was 391.6 µm and the mean GC-IPL thickness was 61.4 µm (table 1).
Demographics and baseline characteristics of patients
Repeatability of VD in various retinal diseases
In all four retinal diseases, the ICC and CV of the full VD were 0.812 and 6.72%, respectively, which showed high repeatability. In each sector, the ICC of the centre, superior, nasal, inferior and temporal were 0.905, 0.840, 0.798, 0.884 and 0.737, respectively, and CV of the centre, superior, nasal, inferior and temporal were 14.74%, 8.38%, 7.56%, 7.70% and 8.86%, respectively, which also showed relatively good repeatability except for the CV of the centre (table 2). Online supplementary table shows ICC, CV and TRTSD of each retinal disease.
Supplemental material
First and second mean values, ICC, CV and TRTSD of VD in patients with various retinal diseases
In Bland-Altman plots of all diseases and each disease, the differences were close to 0 for the VD, which showed no systematic differences in measurement values between the two scans (figure 2).

Bland-Altman plots showing the level of agreement for the VD measurements obtained using AngioPlex optical coherence tomography between two consecutive measurements in patients with retinal diseases. (A) The sum of four retinal diseases. (B) Patients with diabetic macular oedema. (C) Patients with retinal vein occlusion with macular oedema. (D) Patients with epiretinal membrane. (E) Patients with wet age-related macular degeneration. The bold lines indicate the upper and lower boundaries of the 95% CIs, and the fine lines indicate the average absolute differences between the two scans. VD, vessel density.
Factors affecting the repeatability of VD measurements
Univariate analyses showed that the BCVA (B, 8.553; p=0.031), mean signal strength (B, −1.688; p=0.050), mean CMT (B, 0.019; p=0.015) and mean GC-IPL thickness (B, −0.103; p=0.001) were significant factors that affected the repeatability. Multivariate analyses of these factors showed that there was a significant result for GC-IPL thickness (table 3).
Univariate and multivariate linear regression for the association between clinical and anatomical parameters and coefficient of variation of vessel density
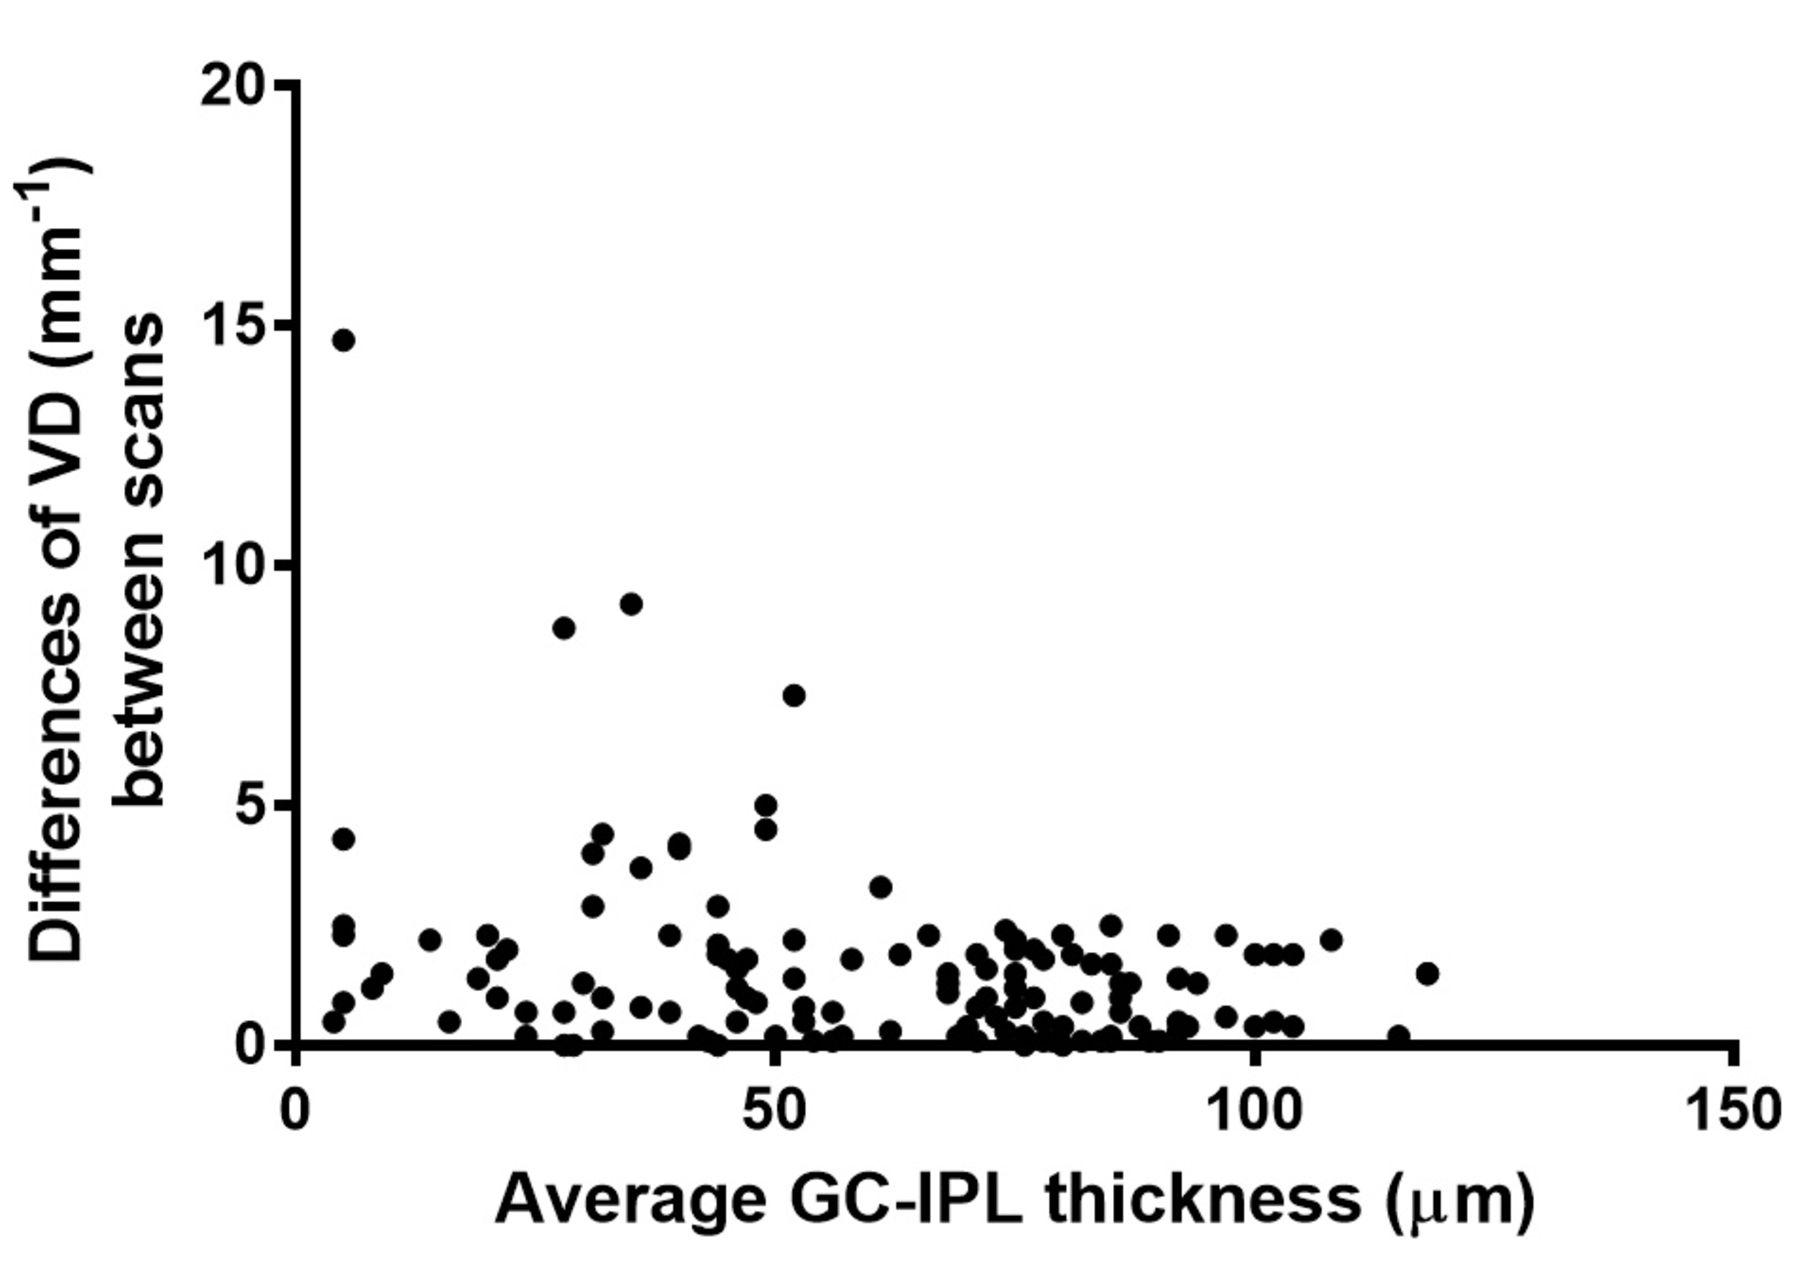
Figure 3 presents a scatterplot graph of the VD differences in the average GC-IPL thickness between two consecutive measurements. Eyes with normal or thick GC-IPL thickness showed a small difference, whereas eyes with a relatively thinner GC-IPL showed a relatively large difference.

Scatterplot graph of the differences in VD between two consecutive measurements using optical coherence tomography angiography. The differences in VD tended to be larger when the average GC-IPL thickness was thinner. GC-IPL, ganglion cell-inner plexiform layer; VD, vessel density.
Discussion
OCTA permits observation of the capillary network of the superficial and deep retinal layers with high resolution and three-dimensional microcirculation imaging of the retina non-invasively, which is impossible in FA providing only a flat image.3 But according to Corvi et al, measurements of the VD, fractal segmentation and FAZ values differ in different OCTA devices because each devices has different segmentation boundaries and different numbers of B-scans in the 3×3 mm area, so they stated that these differences must be considered when comparing OCTA measurements with different devices.8 In addition, each device of OCTA has different concept of VD. For example, VD is defined as the total length of perfused vasculature per unit area in the region of measurement in Cirrus HD-OCT 5000 used in this study, whereas defined as the percentage of pixels with intensity greater than a defined threshold in RTVue XR Avanti spectral domain-OCT (SD-OCT) (Optovue). Further studies are needed to establish absolute standards of OCTA measurements for diagnosis and treatment.
Numerous studies have reported the repeatability and reproducibility of OCTA. Al-Sheikh et al reported that VD measurements using OCTA showed good repeatability, with an ICC of the superficial and deep retinal layers in healthy subjects of 0.90 and 0.83, respectively.6 Many other studies have also reported high repeatability of OCTA measurements in healthy subjects.7 9–12 In a study of repeatability and reproducibility of OCTA in retinal diseases, Amoroso et al reported high reproducibility for the total choroidal neovascularisation lesion size and vessel area using OCTA, when measured manually in a heterogenous group of patients with neovascular AMD. Manalastas et al also reported relatively high reproducibility of the optic nerve head and macular VD in patients with glaucoma, although they reported lower reproducibility than for healthy subjects.11 13 However, when compared with studies of healthy subjects, there is still insufficient evidence concerning the repeatability and reproducibility of OCTA in patients with various retinal diseases.
We analysed the repeatability of the VD using OCTA in patients with DME, RVO with macular oedema, ERM and wet AMD, which are common retinal diseases and may cause structural distortion of macula. Spaide et al reported that macular lesions such as pigment epithelial detachment or drusen make it difficult to accurately measure the VD.14 In this reason, we anticipated a low repeatability of VD measurements in above retinal diseases due to anatomical change of macula, which is the reason why we analysed those four diseases. However, we found a higher repeatability than anticipated, with a ICC of 0.737–0.905, and a CV of 5.60%–8.86% in all areas except the central area (table 2). The CV of the central area was especially higher than other areas. The reason was probably because the CV was affected by average. The CV was calculated as 100 × SD/overall mean and central area had relatively lower VD than other areas because of the FAZ (table 2). This was perhaps the reason why the CV of the central area was higher than that of other areas, but the repeatability of the central area VD seems also high like other areas because the ICC of the central area was 0.905. We therefore need to consider that when analysing CV, it is possible that it is affected by the average.
Our study showed that the factors affecting the repeatability of VD measurements using OCTA were the BCVA, signal strength, CMT and GC-IPL thickness. Lee et al reported that the repeatability of GC-IPL thickness measurements in patients with retinal disease using SD-OCT was low because of the difficulty in repeatedly measuring the same macular area in patients with low vision and an unstable gaze.15 In a similar manner, we estimated the low repeatability of VD measurements using OCTA in patients with a low BCVA compared with patients with a good BCVA because of an unstable gaze. However, multivariate regression did not show statistically significant results. This may have been due to the software-based motion correction of OCTA, which compensated for unstable eye movements in some degree. However, this software can facilitate doubling of retinal vessels, stretching defects and crisscross defect, so a low BCVA with unstable eye movements probably affected, at least partially, the repeatability of VD measurements.14
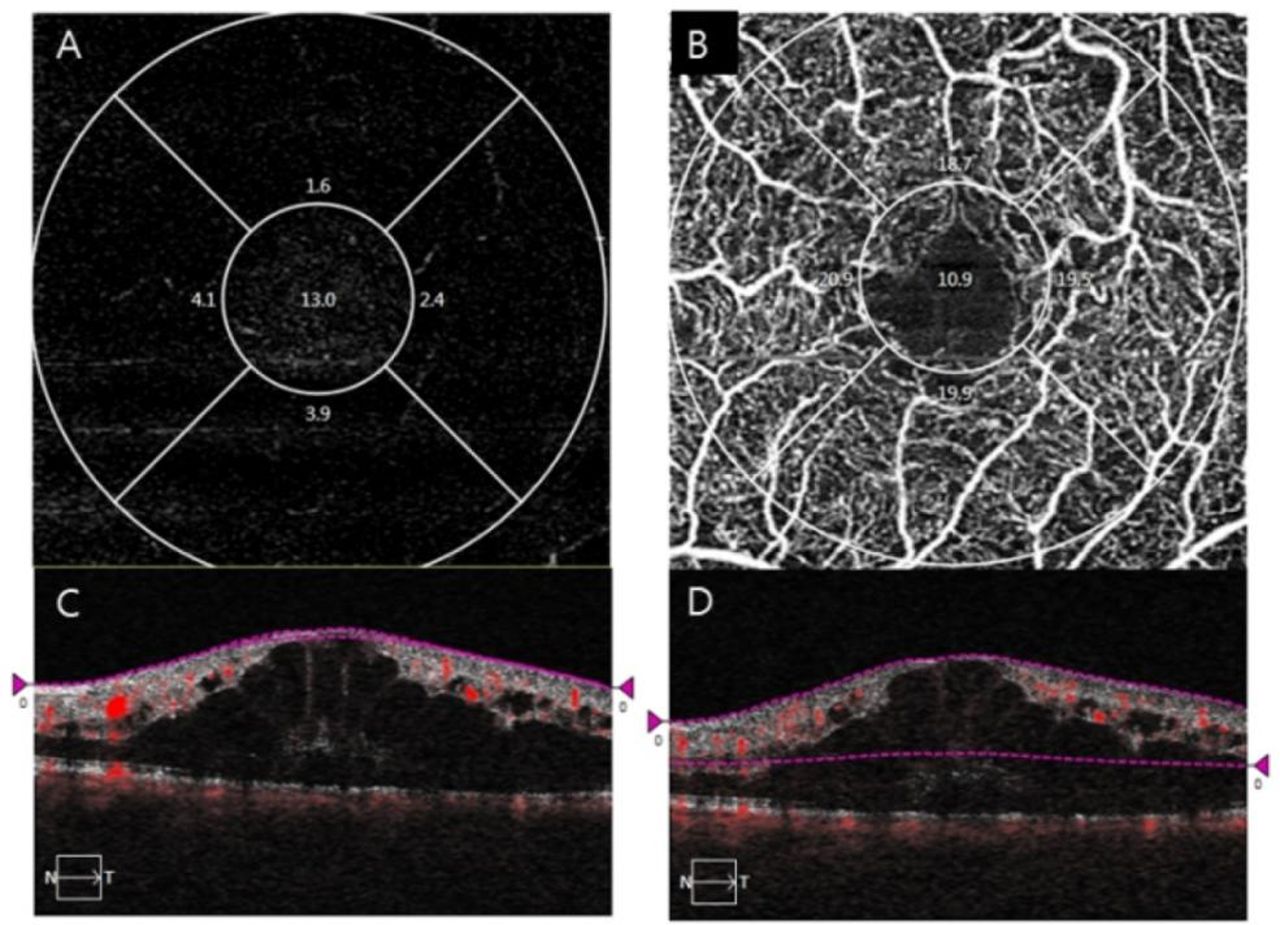
Lei et al reported that the difference in signal strength between scans was positively correlated with the difference in VD and PD measurements and also reported that if the signal strength increased by one unit, the VD increased by 1.4 mm–1 when the signal strength was at least 7.10 Similarly, we found a statistically significant correlation between signal strength and the mean VD (B, 1.16; p<0.001), and the signal strength and repeatability of the VD were also significantly correlated using univariate regression (table 3). Although they did not show a statistically significant result in multivariate regression, the signal strength and VD seem to have a tendency towards a positive correlation. This may have resulted from the microvasculature, which was not detected at low signal strength, but was clearly detected and analysed at high signal strength (figure 4).

An example of the difference of quantitative measurements using optical coherence tomography angiography in a patients with branch retinal vein occlusion (72-year-old woman). (A) The first measurement with a signal strength of 8. (B) The second measurement with a signal strength of 10. Microvascular structures are clear and vivid in the circles of B compared with the circles of A. The central, inner and full vessel density of B were also higher than that of A.
Takusagawa et al reported the usefulness of the superficial vascular layer VD using OCTA and ganglion cell complex (GCC) thickness in the clinical evaluation of glaucoma and high repeatability of superficial vascular layer VD.16 They also reported that the overall superficial vascular complex VD had excellent correlation with the GCC thickness.16 Our study also showed relatively good repeatability of VD measurements, and the GC-IPL thickness was correlated significantly with the CV of the VD (table 3). This was thought to result from two reasons. First, as in other previous studies, if the GC-IPL thickness became thinner, the VD also decreased. As a result, the CV was affected by the altered average VD, which resulted from thinning of the GC-IPL thickness, because the character of the CV was affected by the average, as previously mentioned.16–18 Second, many previous studies have reported that the segmentation error of SD-OCT can occur when measuring the GC-IPL thickness in various retinal diseases.15 19–22 In the same manner, the accuracy of VD measurements can be decreased as the result of segmentation errors of the superficial retinal layer using OCTA in patients with structural distortion of the macula, which results in disparity of two consecutive measurements of the VD (figure 5). We thought that an abnormal CMT could also affect the repeatability of the VD as a result of the segmentation error, but it did not show statistically significant result in multivariate regression. The reason was possibly because the segmentation error greatly affected the repeatability of the VD, and the GC-IPL thickness was related with segmentation error more than the CMT. Therefore, when analysing the VD in patients with retinal disease, it is important to consider these variables, especially in cases where the measured GC-IPL thickness is thin.
An example of different segmentation of the superficial retinal layer using optical coherence tomography angiography in a patient with central retinal vein occlusion (53-year-old man). (A,B) The en face images of the superficial retinal layer. (C,D The horizontal B-scan images with boundary lines for the superficial retinal layer. It was almost impossible to determine the microvascular structure in A because the superficial retinal layer measurement was too thin by the segmentation error in C. In contrast, B shows multiple microvascular structures because the superficial layer measurement was too thick by the segmentation error in D.
This study had some limitations. First, we did not enrol enough eyes to analyse the VD of each disease. Further studies are needed of large scale of patients with homogenous disease. Second, because of analysing values measured only automatically by the AngioPlex, we could not analyse the VD of the deep retinal layer. However, it is known that analysis of the superficial retinal layer is more accurate than that of the deep retinal layer because of projection artefacts which is nearly almost occurred in current technology.14 Durbin et al also reported that VD measurements of the superficial retinal layer had better diagnostic efficacy than measurements of the deep retinal layer.23 Throughout our study, we enrolled a relatively large number of eyes with retinal diseases to determine the repeatability of VD measurements using OCTA and identify factors affecting the repeatability of these measurements.
In conclusion, measurements of the VD using OCTA showed relatively good repeatability when measuring patients with various retinal diseases. The BCVA, signal strength, CMT and GC-IPL thickness affected the repeatability, so these parameters should be considered when analysing the VD.
Footnotes
Contributors Design and conduct of the study: M-WL, J-YK. Collection of data: M-WL, K-MK, J-YK. Analysis and interpretation of data: M-WL, H-BL, J-YK. Writing the article: M-WL, J-YK. Critical revision of the article: M-WL, Y-JJ, J-YK. Final approval of the article: M-WL, H-BL, K-MK, Y-JJ, J-YK.
Competing interests None declared.
Patient consent Obtained.
Ethics approval Institutional Review Board of Chungnam National University Hospital.
Provenance and peer review Not commissioned; externally peer reviewed.
Linked Articles
- At a glance