Article Text

Statistics from Altmetric.com
Introduction
Good clinical care depends on accurate and precise measurement and is essential throughout medicine. Many decisions about patient care in ophthalmology are based on changes in the measurement of characteristics over time (intraocular pressure in glaucoma, central retinal thickness in medical retina studies, Kmax readings in keratoconus) or differences between the measurements for an individual and the ‘normal’ population (or more strictly speaking those without the condition of interest).
We want to know the true value of the characteristic, but this is obtained with measurement error. Measurement error is the difference between the known measured quantity and its unknown true value. It has two main components: random error due to chance and systematic error (sometimes known as systematic bias) not due to chance. Precision is related to random error while accuracy is related to systematic error. Measurement error may cause inappropriate patient management or harm.1
No method of measurement is completely without measurement error. Often less invasive and cheaper methods of measurement have more measurement error. One has to balance the desire for an accurate measurement, against being overly invasive to the patient or too time-consuming to incorporate in a routine clinical setting.
Medicine moves at a rapid rate and new measurement technologies frequently arrive in the marketplace. While once there was a single method to measure intraocular pressure (Goldmann Applanation Tonometry), now there are many different methods and different machines on the market for example, non-contact tonometers, hand-held devices, etc. Newer methods may be more accurate and precise than older methods or may be cheaper or quicker to use. Some methods may be more convenient to use, but can have greater measurement error. The regulatory framework for devices within the UK is very different to that of medicines and while safety of the new instrument must be demonstrated, equivalence against the standard method is not a prerequisite for its adoption.
It is, therefore, quite common to find studies examining the agreement of one method with another method. Such studies seek to establish whether the methods are interchangeable—that is, can a clinician use measurements made with either technology without knowledge of the method used because they yield similar values. Such studies may be described as ‘method agreement’ studies but method agreement is often part of a study estimating the reliability or interobserver (between) and intraobserver (within) variability of the method of measurement.
In 1986, Professors Doug Altman and Martin Bland published a paper highlighting that the correct approach to the analysis of method agreement studies was to calculate the limits of agreement and not correlation.2 Despite this being one of the most highly cited papers in medical research, mistakes are still being made in the statistical analysis of such studies and these have the potential to impact on optimal patient care.
Scenario one
My consultant shows me a paper which compares measurements of intraocular pressure that have been made on patients with glaucoma using disposable and non-disposable tonometer prisms.3 While the Goldmann tonometer has been widely recognised as the gold standard for measuring intraocular pressure, it requires the placement of a prism and its applanation onto the corneal surface to obtain a reading. Historically, non-disposable prisms were used; however, reports of viral ocular infections emerged and there had been an incident within our eye clinic where a patient had received a corneal injury due to residual cleaning fluid left on the prism head. My consultant asks me to review the paper to assess whether disposable prisms should be introduced and if so whether this would have any impact on the management of patients whose intraocular pressure had been previously measured with non-disposable prisms.3
The paper described a study that involved 69 patients.3 Both eyes of each patient had been measured using the Tonosafe disposable head and the Goldmann tonometer head. Pearson’s coefficient of correlation had been used and there was a high correlation with a value of 0.94 (p<0.0001). The authors concluded that ‘the Tonosafe disposable prism head was found to be accurate in IOP measurement, even in the higher range’.
The authors had made efforts to reduce study bias and so increase the validity of study findings. The two examiners who performed tonometry were masked while a separate observer read the IOP measurements. The order in which the Tonosafe and Goldmann devices were used for each patient was randomised by tossing a coin. There was a maximum delay of 15 min between each reading to avoid changes in intraocular pressure.
There were some issues, however, that I was concerned about. The paper said ‘the Goldmann tonometer should be used if accurate IOP measurements were required’. This worried me slightly although I understood the authors to be suggesting that perhaps this was only relevant if a change in treatment was being considered rather than for routine outpatient visits. I remembered reading a statistics note for ophthalmologists that had highlighted the need for caution in analysing data where both eyes had been measured. I was unclear how the authors had dealt with this ‘unit of analysis’ issue.4 Finally, I had a vague recollection of being taught that correlation has a stricter meaning in statistical use than in general language and that correlation was not the appropriate statistical method to use when trying to assess whether methods were interchangeable.
I conducted a search on the intranet and came across the Bland-Altman method for analysing method agreement studies.2
The Bland-Altman paper stresses the need to evaluate agreement of methods of measurement within individuals and agreement on average. Agreement within individuals can be called precision while agreement on average is called bias. It involves computing for each person the difference between the readings made by the two machines. A histogram of these is constructed to assess normality and the amount of spread; and a scatter plot of the difference between the two methods against the average of their two methods is then constructed (the Bland-Altman plot) to check that there is no relationship between the magnitude of the measurement and the difference between the instruments for that individual that is, to assess possible bias. Provided that these assumptions seem reasonable, agreement between instruments can then be summarised using limits of agreement which are calculated as the mean difference −1.96 SD of the differences (lower limit) to the mean difference +1.96 SD of the differences (upper limit). Limits of agreement are reported as (lower limit to upper limit) and if you take the absolute value of the larger of these numbers, you can be fairly confident that measurements made with the two instruments will not differ by more than this amount.
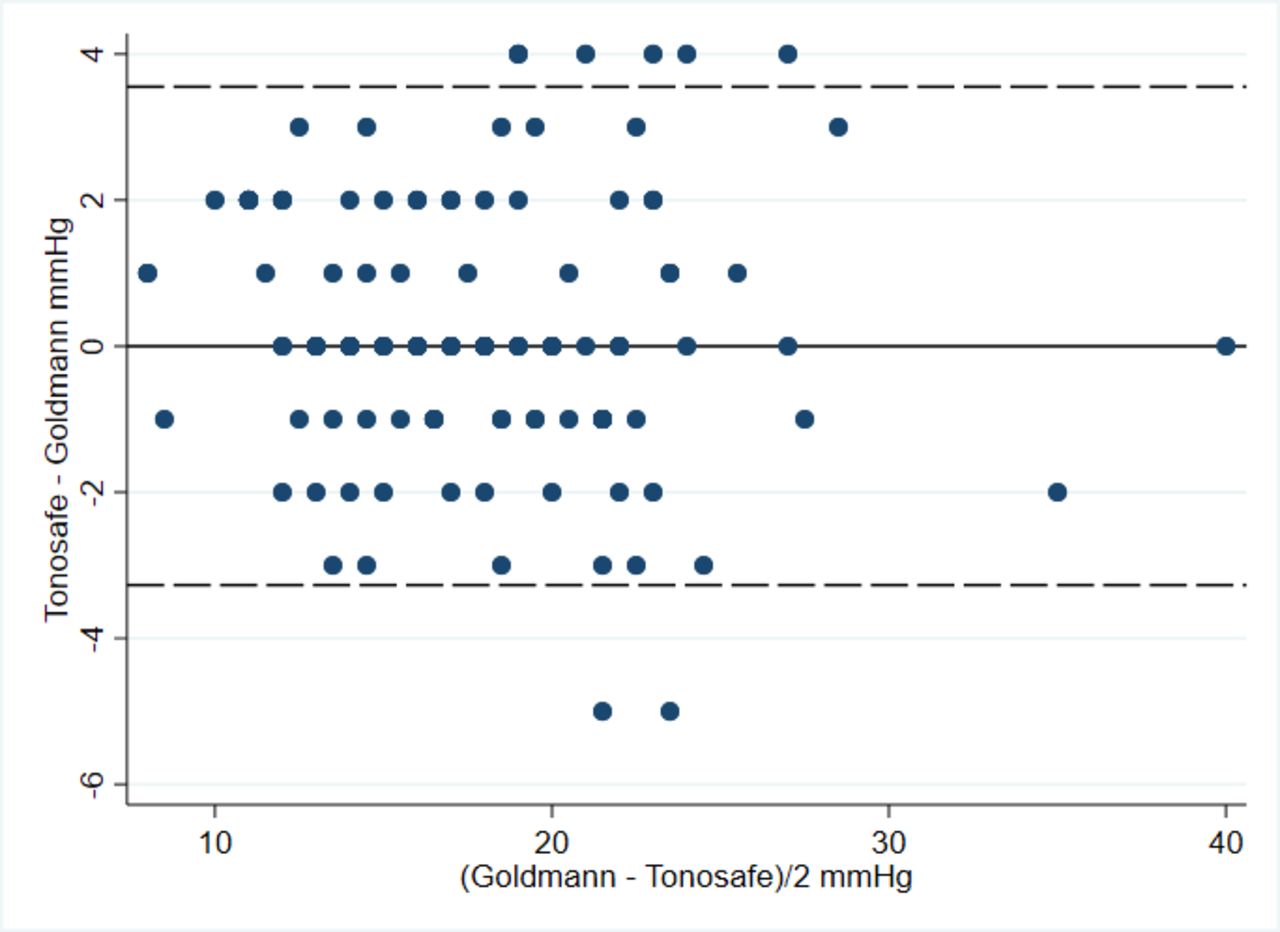
While the paper I was reviewing for my consultant did not include a Bland-Altman plot, it did report a mean difference between Tonosafe and Goldmann of 0.14 mm Hg with a SD of 1.73 mm Hg.3 Using data estimated from the publication, I created a Bland-Altman plot for this study (figure 1). The limits of agreement are 0.14±1.96 * 1.73 mm Hg—that is (−3.25 to 3.53 mm Hg). The largest difference between instruments would be 3.53 mm Hg 95% of the time. To me this seemed like a large difference—a patient might read 18 mm Hg on one device but 22 mm Hg (with rounding to the nearest mm Hg) on another device. While one measure might prompt an increase in medication, the other would not. I searched the internet and came across South East Asia Group Guidelines (SEAGG) (2003–2004).5 These suggest that an error within ±2 mm Hg is acceptable which is much less than the 3.53 mm Hg found in the study I was reviewing.3

Bland-Altman plot of Goldman versus Tonosafe.
I am concerned that this study does not demonstrate sufficiently good agreement and suggest to my consultant that we evaluate this with a larger group of subjects—after further investigation I see that ideally this needs to be at least 100 subjects across the range including those needing treatment.6
Scenario two
A patient has been referred to our clinic with a question as to whether he/she might qualify for certification as sight impaired. The patient has had visual loss for many years but is now experiencing difficulty at home. I understand, having spoken with the Eye Clinic Liaison Officer attached to our clinic, that the patient can be referred to social services with a request for additional support but the patient is particularly keen to be formally placed on the register for severe sight impairment. The patient has no issues with their visual field but does have poor vision in both eyes.7 They have been assessed within a clinic using an ETDRS (Early Treatment Diabetic Retinopathy Study) chart but despite this suggesting that their level of vision is not within certification standards, I decide to assess using a Snellen chart although I do understand completely that this way of assessing vision is not typically used within research studies because it does not reliably capture vision in the same way as the ETDRS chart.8 The patient cannot read the top line with either eye. According to the guidelines, such a patient would qualify for certification as severely sight impaired. If I use the vision that was captured using an ETDRS chart, however, they no longer strictly qualify. I speak to one of the senior consultants who says it is fine to certify the patient if they wish to be certified given that their vision has been assessed using a valid chart and found to be within certifiable levels.
What this one patient has highlighted to me quite clearly, however, is that there is disagreement between Snellen and ETDRS visual acuity charts and that this disagreement matters. I review the evidence and identify a PhD thesis which measured vision in 163 patients using the ETDRS chart and using the Snellen chart but expressing both in logMAR.9 While this reported a high correlation (0.88) and reasonable agreement between the charts for subjects with a good vision, the paper showed that in 56 patients with poor vision (<6/60), the limits of agreement ranged from −14.5 to 34.5 letters, with an average disagreement of 10 ETDRS letters. The dissertation provided Bland-Altman plots which very clearly illustrated disagreement in poor visual acuity and made it quite evident that for patients with poor vision, the method of recording visual acuity must be taken into account.
In both cases, correlation coefficients were high but agreement was not acceptable. If limits of agreement are not considered, one might conclude that the method of measurement did not matter. In other words, one might conclude that it is safe to use the methods of measurement interchangeably.
Bland and Altman first highlighted this issue in 1983.10 The message has been reiterated within ophthalmology research and yet misunderstandings still appear common.11–13 A review of agreement studies conducted in 2012 found that while limits of agreement were in use, the second most common statistical method used was the correlation coefficient.14 The authors concluded that ‘the issue of inappropriate analyses in agreement studies needs to be highlighted to prevent repetition’. One possible reason for continued use of inappropriate analyses is that the impact of misuse is not clear. We hope that the scenarios presented in this paper demonstrate how misleading the correlation coefficient may be when assessing method agreement and how this might lead to patient harm. We hope that in doing this we deliver in a slightly different fashion the request to
Please don’t carry on correlating!
Lessons learned
There are two sources of disagreement between measurements obtained on the same patient or eye from two machines: random error (which relates to the precision of instrument) and systematic error (which relates to statistical bias, and hence to accuracy).
Pearson’s correlation does not measure agreement between methods of measurement
Limits of agreement should be used when assessing whether one method of measurement can replace another method of measurement: the mean difference is assessing the accuracy (bias) while the limits of agreement are assessing the precision.
Please note that the intra-class correlation (ICC), another type of correlation coefficient, is not discussed in this note. The ICC can be used when assessing repeatability (does the same method give the same answer on repeat testing) but the focus of this note is to assess the inter-changeability of measuring devices in medicine. The ICC and when it can be used are discussed in our following short statistics note.
Footnotes
Collaborators Jonathan Cook, Valentina Cipriani, David Crabb, Phillipa Cumberland, Paul Donachie, Marta Garcia-Finana, Ana Quartilho, Chris Rogers, Simon Skene, John Stephenson, Luke Saunders, Joanna Moschandreas, Wen Xing, Haogang Zhu.
Contributors CB drafted the paper. IMS, GC and AE contributed to the second version of the paper. CD and NF critically reviewed and revised the paper.
Funding CB is partly funded/supported by the National Institute for Health Research (NIHR) Biomedical Research Centre based at Guy’s and St Thomas’ NHS Foundation Trust and King’s College London. The views expressed are those of the author(s) and not necessarily those of the NHS, the NIHR or the Department of Health.
Competing interests None declared.
Patient consent for publication Not required.
Provenance and peer review Not commissioned; externally peer reviewed.