Article Text

Abstract
Background: Two commonly used perimeters in Australia are the Humphrey Field Analyzer II (HFA) and the Medmont Automated Perimeter (MAP). Each device describes the visual field in terms of numerical values called global indices; however, these values are not interchangeable between devices. This study was designed to directly compare the global indices of HFA and MAP visual fields.
Methods: 63 subjects who had suspected glaucoma, ocular hypertension or glaucoma, or were normal controls were recruited selectively. Each patient was tested with the MAP and HFA. Global indices were then compared between tests. These included mean deviation (MD) and pattern standard deviation (PSD) from the HFA and average defect (AD) and pattern defect (PD) from the MAP.
Results: The MD and PSD results were strongly correlated with the AD and PD results, respectively. The relationship between them could be described in terms of two polynomial equations: AD = 0.94+1.31(MD)+0.02(MD)2 and PD = 2.21(PSD)–0.05(PSD)2–0.006. These non-linear relationships may be the result of differences in testing method (test stimulus spectrum, number of testing locations or background luminance) or differences in the way each global index was calculated.
Conclusion: The AD and PD results obtained from the MAP may be substituted for the MD and PSD results from the HFA after appropriate conversion.
Statistics from Altmetric.com
During the past 30 years, automated perimetry has become the method to detect visual field loss.1–3 Two devices are the Medmont Automated Perimeter (MAP) and the Humphrey Field Analyzer II (HFA), which has become the standard against which others are compared.
The visual field may be described in several ways. Initially, an automated perimeter produces a map of the differential light sensitivities at a range of eccentricities. This is compared with age-adjusted normal sensitivities (total deviation) and described in terms of the likelihood that each point falls within the normal range (total deviation probability plot). The field is then adjusted for overall depression to account for diffuse field loss that may be more likely due to refractive media opacity and thereby to highlight field loss from visual pathway pathology (pattern deviation).4 This can also be described as falling within the normal range (pattern deviation probability plot).
Furthermore, the visual field may be described in terms of several numerical values, termed the global indices.5 6 These comprise the mean deviation (MD) and the pattern standard deviation (PSD) or the average defect (AD) and the pattern defect (PD) on the HFA and MAP, respectively. The calculation of MD and AD involves averaging the differences between the measured sensitivities and the age-adjusted normal sensitivities (total deviations) at each test point, thereby describing the general depression or elevation of the field. The PSD and PD describe the spread of these total deviations and represent the asymmetry of the visual field.
Currently, MAP testing results in different numerical global indices from those obtained by the HFA. These indices are therefore not numerically interchangeable between the two devices and it is not clear what values may be substituted when a conversion is required.7 8 This study was designed to directly compare the global indices of HFA and MAP visual fields.
METHODS
A total of 63 patients were recruited selectively from a patient population attending an urban glaucoma clinic. None had diabetes, cataract or corneal or retinal disease, which could affect test results. The inclusion criteria were: a visual acuity of 6/12 or better, five dioptres or less of sphere and three dioptres or less of cylinder in refractive error, no previous intraocular surgery and no other systemic illness or medication which could affect visual fields. Patients had suspected glaucoma, ocular hypertension, open angle glaucoma, or were control subjects. The suspected glaucoma group had a family history of glaucoma or had suspicious discs but no definite structural changes and normal intraocular pressure (IOP <21 mm Hg) and visual fields. Ocular hypertension was diagnosed as IOP >21 mm Hg on at least three occasions with no previous field changes on full threshold HFA testing and no evidence of glaucomatous optic neuropathy. Patients with open angle glaucoma had glaucomatous optic disc changes with or without characteristic visual field abnormality on 24-2 HFA full threshold testing. Among patients with suspected glaucoma, ocular hypertension or glaucoma, only those patients were included who had at least two consecutive visual field tests performed within the past 2 years.
One eye from each patient was considered. When both eyes were eligible a random choice was made. Medmont and HFA tests were performed in random order after informed consent was obtained. The Humphrey Field Analyser II (Carl Zeiss, Dublin, CA, USA) was used to perform central 24-2 full threshold visual field tests. The Medmont M600 Automated Perimeter (Medmont, Camberwell, Victoria, Australia) was used to perform central 30° threshold tests. The global indices from each test were then compared. These included the MD and PSD from the HFA and the AD and PD from the MAP.
Statistical Analysis System 6.12 (SAS Institute, Cary, NC, USA) was used for statistical analysis including frequency tables, descriptive statistics and linear regression.
RESULTS
Our sample included 34 females (54%) and 29 males (46%). Their average age was 60 years (standard deviation 13 years). There were 15 controls (24%), eight patients with suspected glaucoma (13%), eight with ocular hypertension (13%) and 32 with open angle glaucoma (51%).9
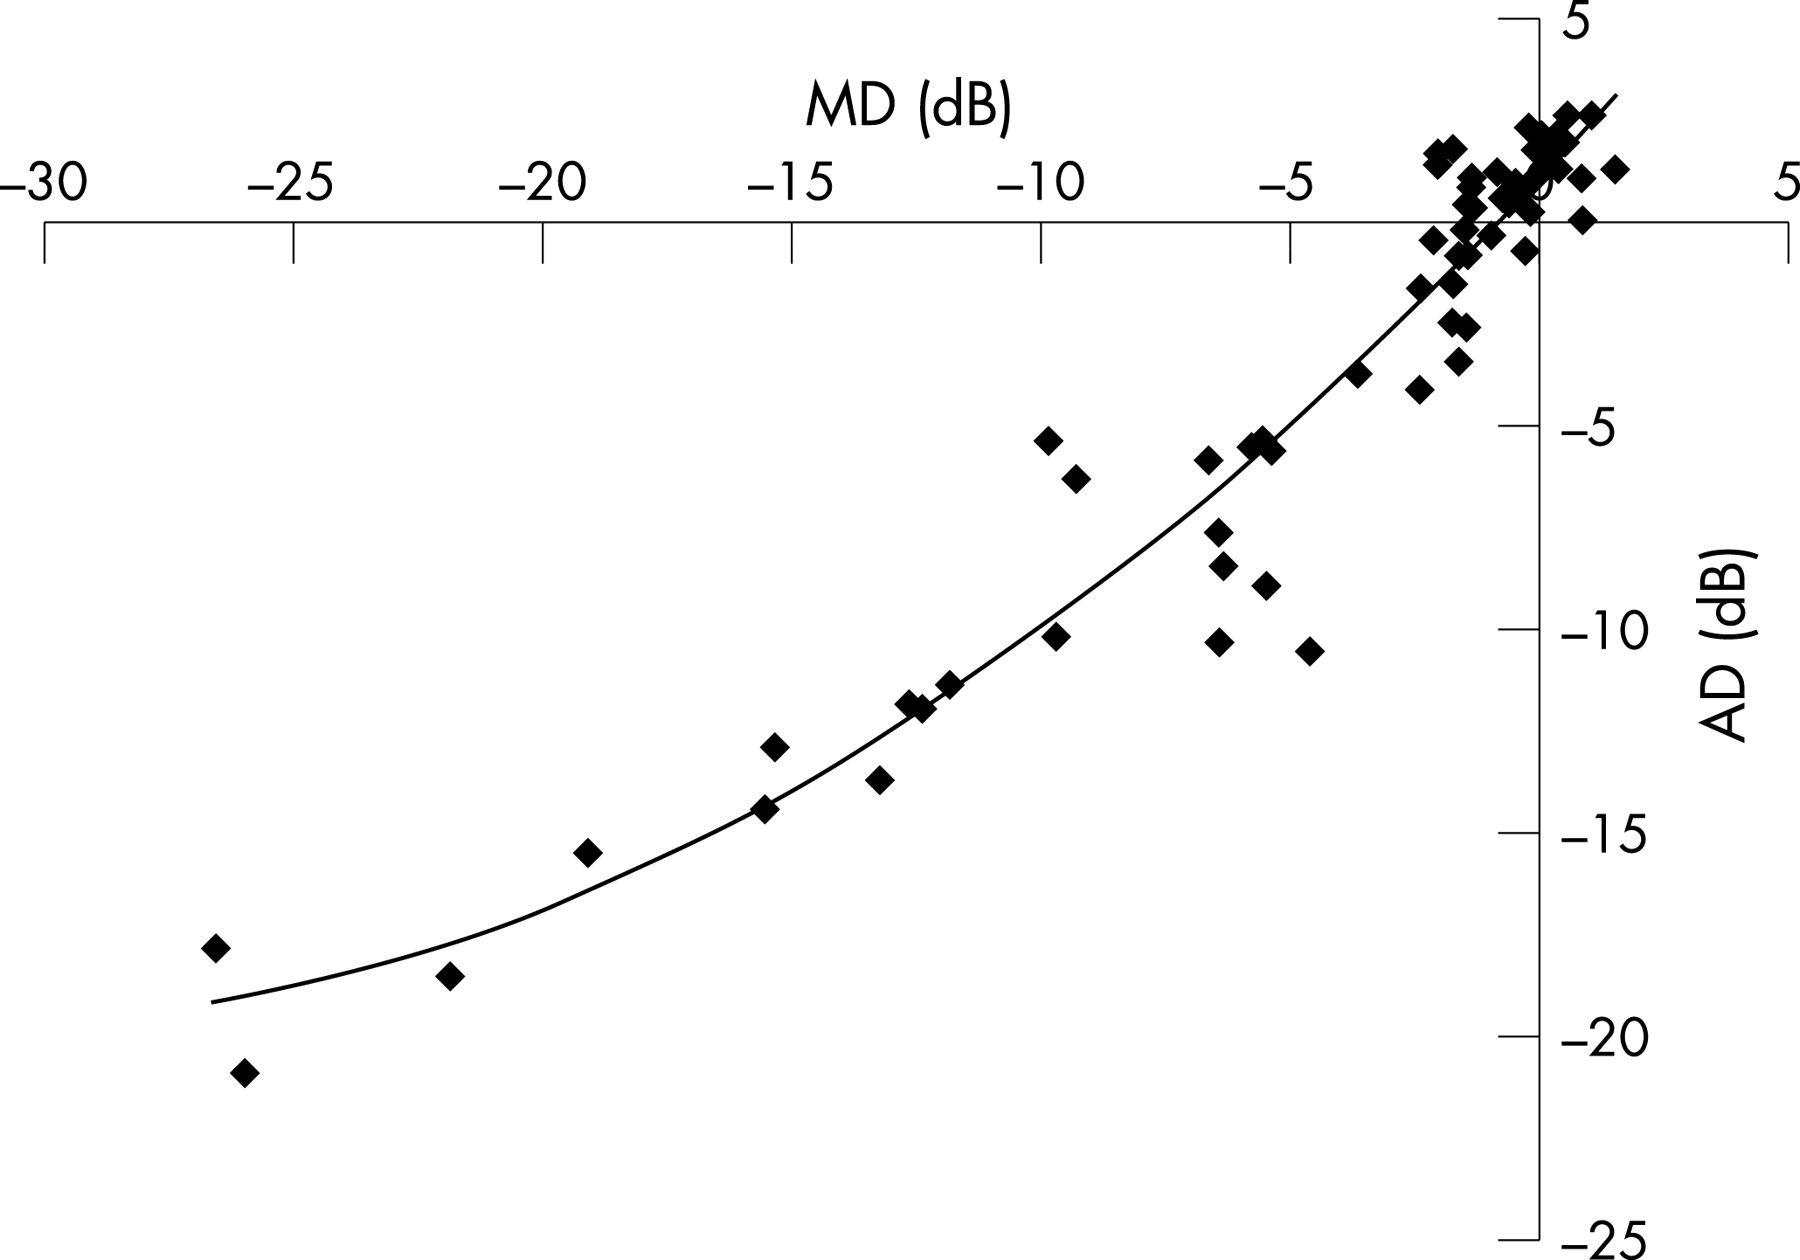
When MD and AD were compared, there was an association which could be described by the quadratic equation:
AD = 0.94+1.31(MD)+0.02(MD)2
This regression function was highly significant (r2 = 0.92; p<0.001) (fig 1, table 1).
In addition, when PSD and PD were compared, again there was a non-linear association, which fit the regression equation:
PD = 2.21(PSD)–0.05(PSD)2–0.006
This relationship was also highly significant (r2 = 0.75; p<0.001) (fig 2, table 2).
These associations were independent of age and gender.

DISCUSSION
The pattern and extent of visual field loss may indicate the nature and severity of disease, respectively.10 Comparisons between Humphrey and Medmont perimeters have indicated that visual field loss becomes apparent at the same rate on both devices and demonstrates a similar pattern.9 11 Therefore, it might be possible to use the two units interchangeably for disease detection.
The results of this study demonstrate that both MD and PD, and thus disease severity, are comparable with AD and PD, respectively, with the relationships definable by polynomial equations. This complex association may be related to the different spectra of the test stimuli and the number of stimuli, or the different levels of background illuminance between the two devices and thus the difference in absolute sensitivity across the visual field under these different conditions. Both devices use a hemispheric bowl with a radius of approximately 30 cm; however, whilst the HFA illuminates the background to 31.5 apostilbs (asb), the Medmont uses 10 asb.12 Both use a testing stimulus 0.43° (Goldmann size III) in size. However, the HFA projects a white light stimulus at specified points in the visual field (54 testing locations in the 24-2 algorithm), while the MAP utilises 164 green light-emitting diodes (wavelength 565 nm) which act as test stimuli by retro-illuminating fixed points within the bowl.12 The larger number of stimuli allows for a greater number of, and thus a greater weighting for, points in the arcuate zones, these being the areas where glaucomatous field loss is more likely to occur initially. Furthermore, the luminance of the testing stimuli are scaled at different levels, with responses to MAP stimuli being recorded 10 dB lower than those of HFA.13 These differences in stimulus and background luminance do not affect the Weber fraction and thus the ability of the MAP to detect field loss seen on HFA.9 11 However, despite this, after adjustment for the difference in background luminance, absolute sensitivities have been measured at approximately 5 dB lower on the MAP when compared with the HFA.13
The relationship between the global indices of the devices may also relate to differences in the manner in which they were calculated.14 For instance, AD is the trimmed mean of the total deviations at each point on the visual field, with the percentage of trimming being determined by the degree of abnormality exhibited in the field (severity of disease, presence of diffuse loss, presence of high false positives).15 Therefore, fields with large numbers of significantly abnormal points would be more likely to have these points excluded and therefore the AD would be less influenced by them. However, MD is an index which is weighted for eccentricity, with each total deviation amount being divided by the variance of normal values at each point.14 Since variance tends to increase with eccentricity, peripheral points will contribute less to the calculation of MD than central points.
It is not unexpected that these relationships should be independent of age, as testing point sensitivities are adjusted for age prior to the calculation of global indices. However, these relationships are only specific for comparisons between global indices and do not relate to sensitivities at individual testing points.
The sample size was based on the numbers which could be collected by one researcher (AS) during the period of the study and was not pre-determined prior to commencement. However, being clinic-based, our sample comprised a group of patients which should reflect those seen in clinical practice.
The AD and the PD results obtained from the Medmont perimeter may be substituted for the MD and PSD of the Humphrey perimeter after appropriate conversion has been performed.
Acknowledgments
We would like to thank Associate Professor Algis Vingrys and the staff at Eye Associates for their support and assistance.
REFERENCES
Footnotes
Financial support: This study was not subject to funding from any external source. The authors have no proprietary or financial interest in any of the equipment used in this study.
Performed at Eye Associates, Park House, Macquarie Street, Sydney, Australia
Ethics approval: Ethics approval for this study was obtained from the South Eastern Sydney Area Health Services Clinical Research Ethics committee.
Competing interests: None.
- Abbreviations:
- AD
average defect
- HFA
Humphrey Field Analyzer II
- IOP
intraocular pressure
- MAP
Medmont Automated Perimeter
- MD
mean deviation
- PD
pattern defect
- PSD
pattern standard deviation
This paper is freely available online under the BMJ Journals unlocked scheme, see http://bjo.bmj.com/info/unlocked.dtl