Article Text

Abstract
Aims To investigate the correlation between increased retinal thickness (RT) measured with spectral domain high-definition optical coherence tomography (OCT) (Cirrus HD-OCT (Carl Zeiss Meditec, Dublin, California, USA)) and best-corrected visual acuity (BCVA) in eyes with clinically significant macular oedema (CSME) and type 2 diabetes.
Methods Seventy eyes with CSME were included in this observational study. Sixty-two eyes were considered for analysis and were classified as having/not having retinal thickening in the central fovea (central 500-μm-diameter circle) by Cirrus HD-OCT. RT measurements were computed and correlated with BCVA. For comparison purposes, the Stratus OCT (Carl Zeiss Meditec, Dublin, California, USA) central point thickness was also obtained in these eyes.
Results In the 19 eyes with CMSE identified by Cirrus HD-OCT without increased RT in the central fovea (500-μm-diameter circle), no correlation was found between RT and BCVA (R=0.062; 95% CI −0.404 to 0.502). In the 43 eyes where the Cirrus HD-OCT identified an increased RT in the central fovea (central 500-μm-diameter circle), only a moderate correlation between RT and BCVA was found (R=−0.459; 95% CI −0.667 to −0.184).
Conclusion Correlations between RT and BCVA in CSME are only present when the central 500-μm-diameter circle is involved. However, even in this circumstance, a correlation was found in only 48.8% of the cases. RT cannot, therefore, be used as a surrogate outcome for visual acuity changes.
- Best-corrected visual acuity
- retinal thickness
- clinically significant macular oedema
- optical coherence tomography
Statistics from Altmetric.com
- Best-corrected visual acuity
- retinal thickness
- clinically significant macular oedema
- optical coherence tomography
Diabetic macular oedema (DME) has been considered the most frequent cause of visual loss in patients with diabetes. This concept is due mainly from the perception that a decrease in macular oedema obtained by treatment is associated with an improvement in visual acuity.
Objective methods of measuring retinal thickness (RT) have recently become available, and studies are being performed to investigate the relationship between the degree of DME and visual acuity.
Different studies have reported different results, ranging between 0.28 and 0.73 for the correlation between optical coherence tomography (OCT)-measured RT and visual acuity.1–5
The verification of such a correlation, or the lack of it, has obvious clinical relevance. Is increased RT, which equals macular oedema, a good indicator of visual acuity loss? There are, now, commercially available improved versions of the OCT with increased sampling allowing a clear identification of the central 500-μm-diameter circle, such as the high-definition spectral domain Cirrus HD-OCT (Carl Zeiss Meditec, Dublin, California, USA).
In this paper, we compared best-corrected visual acuity (BCVA) with RT measurements, performed with the recently available Cirrus HD-OCT, in a series of patients with type 2 diabetes classified on stereocolour fundus photography, at an independent reading centre, as having clinically significant macular oedema (CSME) using the Early Treatment Diabetic Retinopathy Study (ETDRS) classification.
Materials and methods
Patients and study design
Seventy eyes with CSME from 37 type 2 diabetic patients, classified according to the ETDRS definition, were included in this observational study.
All eyes were classified as having CSME at an independent reading centre using stereocolour fundus photography according to the ETDRS definition. Eyes receiving this classification comply with one or more of the following criteria6 7:
thickening of the retina at or within 500 μm of the centre of the macula;
hard exudates at or within 500 μm of the centre of the macula, if associated with thickening of the adjacent retina;
a zone or zones of retinal thickening one disc diameter or larger, of which any part is within 1 disc diameter of the centre of the macula.
In addition to the CSME classification, according to the ETDRS criterion of “thickening of the retina at or within 500 μm of the centre of the macula”, these eyes were also classified as being with or without retinal thickening in the central fovea based on Cirrus HD-OCT measurements and stereocolour fundus photography.
Exclusion criteria included eyes with photocoagulation treatment within the 3 months before inclusion in the study and eyes with cataract or any other eye disease that may interfere with fundus examination.
The tenets of the Declaration of Helsinki were followed, and approval from the institutional ethics and review board was obtained. Informed consent was obtained from all the patients (clinical trial identifier at http://www.clinicaltrials.gov/: NCT00797134).
All 70 eyes underwent RT measurements using the Cirrus HD-OCT, BCVA according to the ETDRS score and seven-field stereocolour fundus photography. Stratus OCT (Carl Zeiss Meditec, Dublin, California, USA) central point thickness was additionally collected.
Methods
Best-corrected visual acuity
BCVA in each eye was assessed according the ETDRS protocol6 8 using Precision Vision charts “R”, “1”, and “2” (Precision Vision, Bloomington, Illinois, USA) at a distance of 4 m.
Retinal thickness
Retinal thickness was assessed by stereocolour fundus photography, for CSME classification according to the ETDRS criteria, and objectively measured by Cirrus HD-OCT and by Stratus OCT (central point thickness only).
Stereocolour fundus photography
Stereocolour fundus photography was performed according to the ETDRS guidelines for CSME classification—field 2 of seven-field stereocolour fundus photography.
Cirrus HD-OCT
A major advantage of the Cirrus HD-OCT, as compared to the Stratus version and besides the increase in sampling (65 536 readings for the Macular Cube 512×128 Combo Protocol), is the availability of two distinct fundus references: a C-scan computed from the tomographic data and a reference obtained by scanning the eye fundus through scanning laser ophthalmoscopy. Although none of these two references excels in image quality, both outperform the Stratus OCT fundus reference that is unusable for the large majority of scans.
To increase the accuracy in detecting the centre of the fovea, this location was identified in colour fundus photographs of the same eye. Through an image coregistration procedure (projective transformation), Cirrus HD-OCT fundus references were coregistered to the respective colour fundus photographs. This procedure allows the centre of the fovea to be identified in the thickness map based on its easier identification in the respective colour fundus image. In addition, because of sampling, the average RT for the 500-μm-diameter circle, centred at the identified foveal location, was computed resorting to thin plate spline interpolation,9 10 a procedure that allows data to be interpolated by defining a smooth surface passing through all control points.
A Cirrus HD-OCT map over the fundus reference can be seen in figure 1.

Retinal-thickness maps for case 08. (Left) Retinal-thickness map from the Cirrus HD-OCT where the circles indicate the central circles 300 (the foveola), 500 and 1000 μm in diameter centred on the fovea, as identified from the respective colour fundus photograph. (Right) Proprietary retinal-thickness map with circles of 500 and 1000 μm in diameter, each split into eight equal areas. Retinal thickness (in micrometers) can be deciphered through the colour bar on the right.
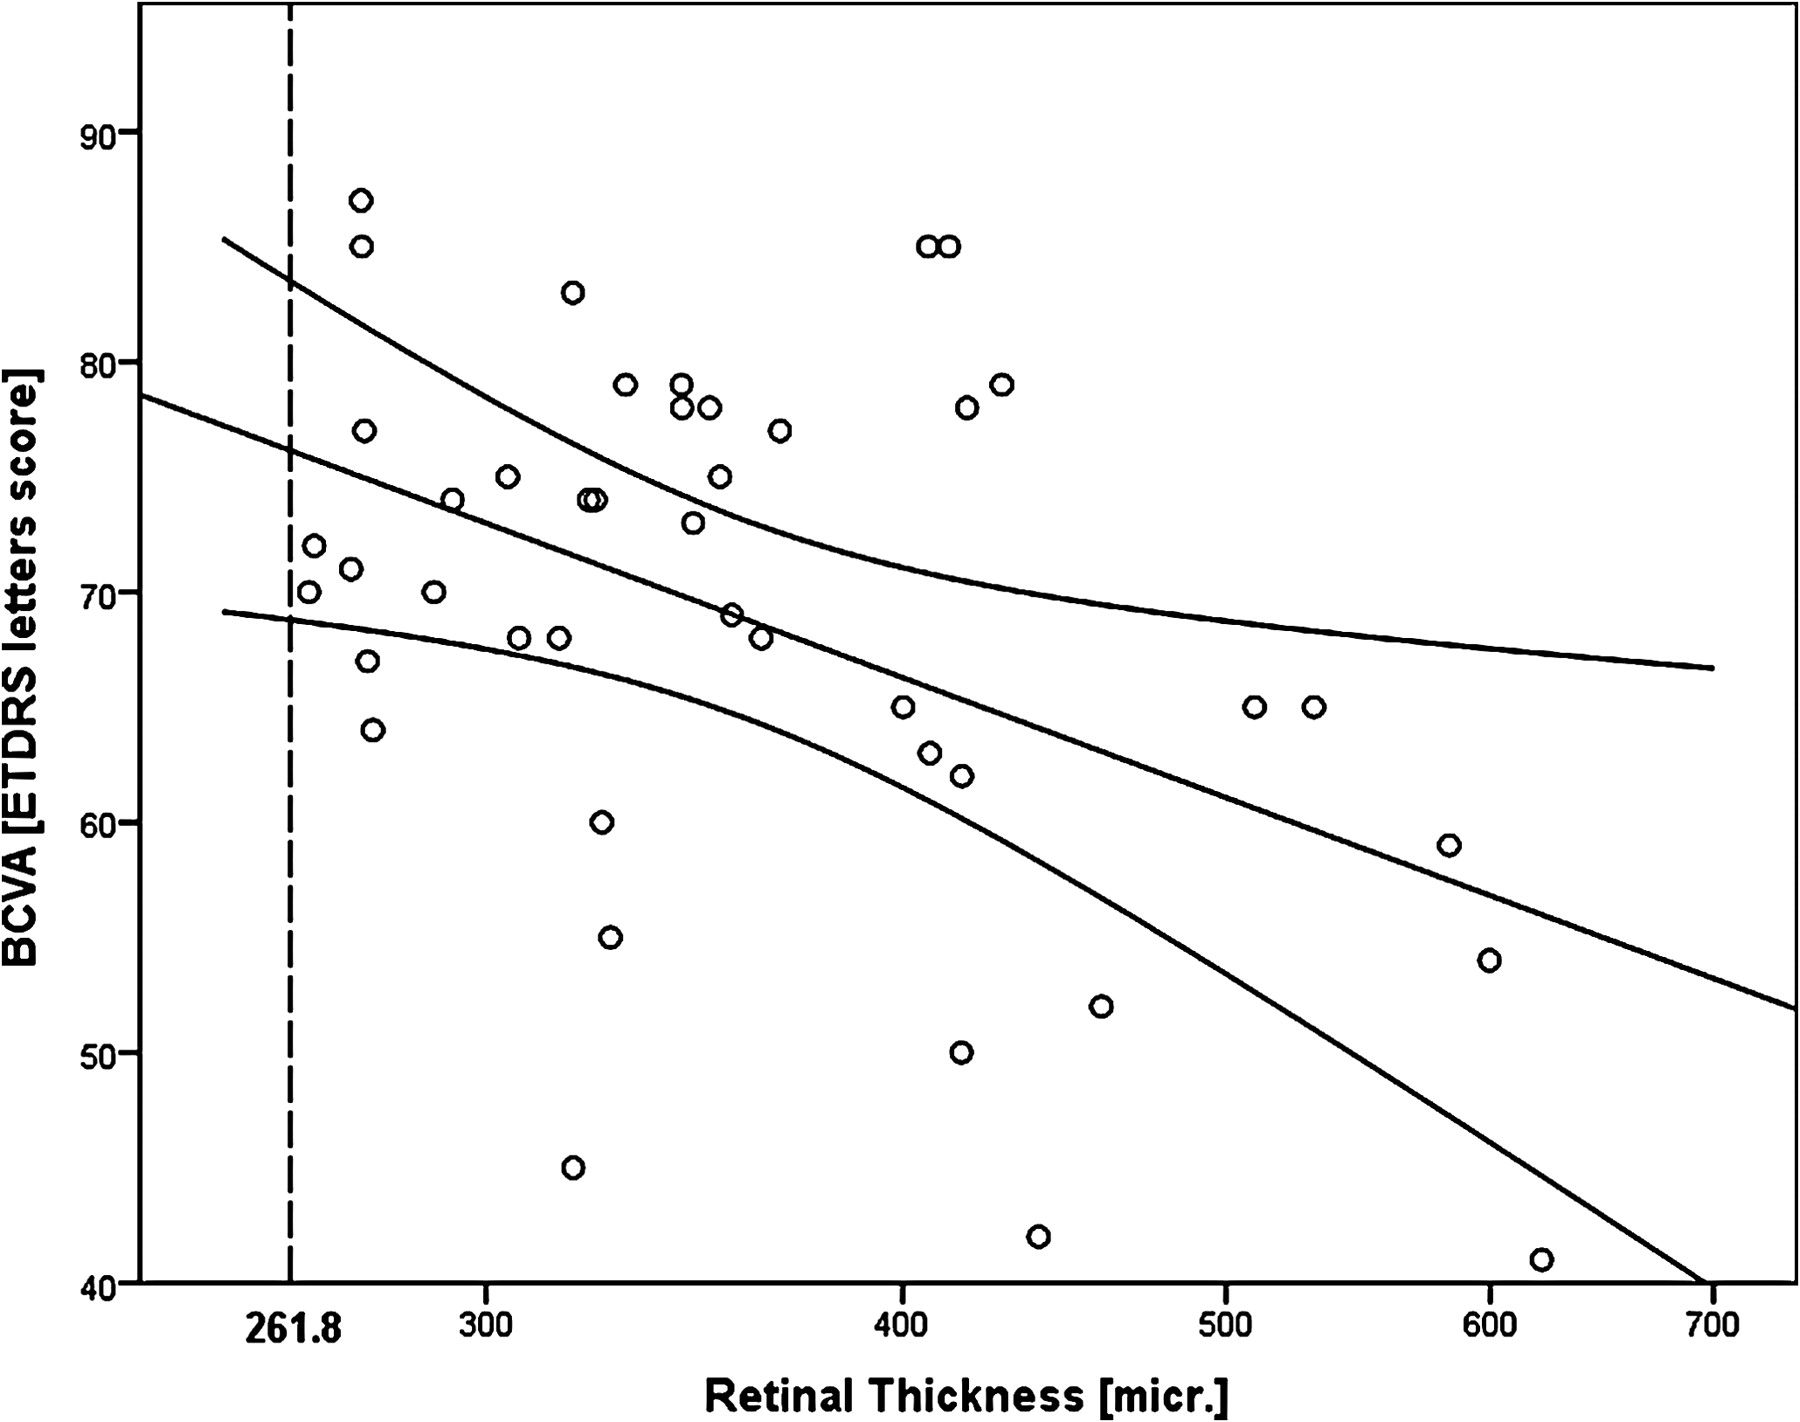
To establish a reference value for the central 500-μm-diameter circle, an age-matched control population of 29 eyes, from healthy volunteers with ages ranging from 40 to 85 years (mean (SD) 52.9 (10.7) years), underwent RT measurements with the Cirrus HD-OCT. The reference value, that is, the value above which RT was considered increased, was defined as the mean (2 SD). Based on this thickness-value reference, RT in the central fovea was considered increased whenever the measured RT in the central 500-μm-diameter circle was >261.8 μm (ie, 231.5 + 2×15.1 μm).
Cirrus versus Stratus OCT
Whereas for the Stratus OCT the average RT for the central 1000-μm-diameter circle and the central point thickness values are the only options available, when using the six radial line-scans (Fast Macular Protocol), for the Cirrus HD-OCT a detailed RT map is provided, allowing access to detailed information. The number (density) of RT measures by Stratus and Cirrus HD-OCT for the central 1000-μm-diameter circle is 128 and >5600 readings, respectively (ie, a sampling factor >40).
Statistical analysis
To analyse the correlation between RT measured with the Cirrus HD-OCT in the central 500-μm-diameter circle and BCVA, a regression analysis was performed, with the BCVA as the dependent parameter.
Regression analyses were performed for the eyes with and without retinal thickening in the central fovea (increased RT in the central 500-μm-diameter circle based on the Cirrus HD-OCT RT classification or based on the stereocolour fundus photography classification). The normal distribution of the different parameters, tested using the Kolmogorov–Smirnov test, was ensured by removing four outliers and by applying the logarithmic function to the RT parameters (logRT), which initially presented a skewed distribution.
The correlation between the central RT values and patients' age, diabetes duration and haemoglobin A1C levels was also analysed using the Pearson correlation coefficient.
The agreement between the Cirrus HD-OCT and the stereocolour fundus photography classifications, for retinal thickening in the central fovea (ie, for the presence of an increased RT in the central 500-μm-diameter circle), was assessed using the Cohen's κ coefficient.
In addition, Stratus OCT central point thickness was correlated with the BCVA.
Statistical analyses (estimates and 95% confidence interval (CI)) were performed using the SPSS software V.13.0 (SPSS Inc., Chicago, Illinois, USA). Good agreements were considered for κ values >0.75 (based on the Landis and Koch criteria11). For the Pearson correlation coefficient (R), from the regression analyses between logRT and BCVA, the criteria defined by Swinscow and Campbell were used.12
Results
From the initial 70 eyes included in this study, 8 eyes were excluded, 4 eyes with segmentation errors on Cirrus HD-OCT and another 4 considered as outliers on the statistical analysis.
Increased RT, in the central 500-μm-diameter circle (RT >261.8 μm) was detected in 43 eyes using the high-definition Cirrus HD-OCT. Therefore, 43 eyes were considered to have increased RT in the central fovea (central 500-μm-diameter circle) and 19 eyes were considered as not having increased RT in the central fovea.
Based on stereocolour fundus photograph grading, 40 of the 62 eyes were considered, by the independent reading centre, to have retinal thickening in the central fovea and 22 eyes were considered as not having retinal thickening in the central fovea.
Table 1 provides demographic and clinical characteristics for patients and study eyes.
Patients' characteristics
No correlations were found between Cirrus HD-OCT RT in the central 500-μm-diameter circle and patients' age (R=0.044; 95% CI −0.208 to 0.291), diabetes duration (R=−0.055; 95% CI −0.301 to 0.197) and haemoglobin A1C levels (R=0.031; 95% CI −0.220 to +0.279).
RT versus BCVA
Considering, separately, the eyes with and without increased RT in the central fovea by Cirrus HD-OCT (central 500-μm-diameter circle), the correlation between logRT and BCVA is absent for the eyes without increased RT in the central fovea and is only moderate for the eyes with increased RT in the central fovea (table 2).
Pearson correlation coefficient and 95% CI for the regression analysis between Cirrus HD-OCT retinal thickness in the 500-μm-diameter circle (logRT) and BCVA
For eyes with increased RT in the central fovea (central 500-μm-diameter circle), the correlation coefficient is R=−0.459 (95% CI −0.667 to −0.184) (figure 2), whereas for eyes without increased RT in the central fovea, the correlation coefficient is R=0.062 (95% CI −0.404 to 0.502).
Retinal thickness in the 500-μm-diameter circle (logarithm scale) versus BCVA for the eyes with increased RT (based on Cirrus HD-OCT) in the central fovea (n=43; regression line with 99% mean prediction interval).
The moderate correlation in the eyes with increased RT in the central fovea is well demonstrated by the fact that only 48.8% of the eyes (21 out of the 43) are within the 99% mean prediction interval for the regression line.
The lack of a correlation between the more increased values of RT and worst BCVA is shown in table 3 (number of eyes with an observed BCVA different, better or worse, than the predicted value, that is, than the BCVA predicted by the regression line).
Number of eyes with increased RT in the central fovea (central 500-μm-diameter circle) (n=43), with an observed BCVA different (worse, or better) than the predicted value (from the regression line)
Foveal involvement classifications: Cirrus HD-OCT versus stereocolour fundus photography
A moderate agreement was found between the classifications for CSME with or without increased RT in the central fovea (central 500-μm-diameter circle) based on the Cirrus HD-OCT (ie, RT in the 500-μm-diameter circle >261.8 μm) and the stereocolour fundus photography (κ=0.673; 95% CI 0.478 to 0.868).
Fifty-three of the 62 eyes with CSME (85.5%) received the same classification by both Cirrus HD-OCT and stereocolour fundus photography. Thirty-seven eyes (59.7%) were classified with increased RT in the central fovea (central 500-μm-diameter circle) by Cirrus HD-OCT and stereocolour fundus photography, and 16 eyes (25.8%) were classified without increased RT in the central fovea by both methods.
When considering the stereocolour fundus photography classification for retinal thickening in the central fovea, the strength of the correlation between logRT and BCVA decreases. For these eyes, the correlation becomes weak (R=−0.342; 95% CI −0.591 to −0.034), whereas for eyes without retinal thickening in the central fovea, the correlation remains absent (R =−0.005; 95% CI −0.426 to +0.417) (table 2).
Stratus OCT central point
The correlation between logRT and BCVA, when using the Stratus OCT central point thickness, was found to be moderate (as well) for the eyes with increased RT in the central fovea (R=−0.460; 95% CI −0.668 to−0.185), that is, in the same range of the correlation found for the Cirrus HD-OCT.
Discussion
Central RT, as measured by OCT Stratus, has been proposed by several authors as a surrogate outcome for visual function, whereas recent findings reported by the DRCR.net in a large series of 251 eyes with DME, before and after laser treatment,1 documented only a modest correlation between BCVA and Stratus OCT-measured central point thickness.
We examined a series of 62 eyes with DME, correlating BCVA with high-resolution spectral domain Cirrus HD-OCT measurements of RT for the inner 500-μm-diameter circle.
Evaluation of the central 500-μm-diameter circle is particularly relevant taking into consideration the accepted definition of CSME and the current understanding that visual acuity values are mainly dependent on the function of the central fovea.6 7
The separation of the eyes into two different groups based on retinal thickening in the central fovea, using the Cirrus HD-OCT RT maps (allowing a clear identification of the central 500-μm-diameter circle), offers a better insight into any correlation between RT and BCVA.13
This study confirms the DRCR.net study findings,1 which showed only a moderate correlation between Stratus OCT thickness values and BCVA, even when considering the central 500-μm-diameter circle.
Correlations between RT, measured by the Cirrus HD-OCT, and BCVA were only identified in eyes with retinal thickening in the central fovea (central 500-μm-diameter circle).
No clear association could be found between higher ranges of increased thickness and worst visual acuities, nor the reverse. Worst than expected visual acuities were predominant in the group of eyes that had oedema of the central 500-μm-diameter circle <300 μm and in the group that had increased RT values in the central macula between 400 and 450 μm.
It is interesting that stereocolour fundus photography classification of retinal thickening in the central 500-μm circle performed by trained graders showed only a moderate agreement with the classification based on the Cirrus HD-OCT thickness in the 500-μm-diameter circle.
Our findings show that OCT RT measurements, although able to quantify the height and volume of macular oedema, cannot be used alone as a reliable indicator of visual acuity loss.
Assessment of macular thickness using OCT is clinically useful and demonstrates objectively the degree of macular oedema. Macular thickness, however, does not, per se, correlate well with visual acuity in eyes with DME.
The degree of macular oedema may only represent the degree of the breakdown of the blood–retinal barrier (BRB) and the associated inflammatory response, and, as such, is just a sign of only one component of disease progression. Subclinical macular oedema may be present from the earliest stages of diabetic retinal disease as soon as there is an alteration of the inner BRB that is not compensated by the pumping activity of the outer BRB.
It is necessary to reach a scientific consensus on the definition of the different subtypes of DME. Demonstration of increased RT, with an objective method such as OCT, should be mandatory. Furthermore, the presence, or absence, of increased RT values in the central 500-μm-diameter circle of the retina should also be indicated. Other factors that should be taken into account are the total area of the retina that shows increased RT, the finding of large “cystic” spaces in the retina suggesting large accumulations of extracellular fluid, the duration of the oedema and its response to treatment. Another piece of information that may become particularly relevant is the status of the retinal photoreceptors (rods and cones) within the area of oedema.13
It is realised that the next step is to correlate RT measurements with changes in BCVA over a time interval, before and after treatment, using procedures similar to the ones used in the present study.
References
Footnotes
Competing interests None.
Ethics approval This study was conducted with the approval of the Association for Innovation and Biomedical Research on Light and Image-Comissão de Ética para a Saúde, Coimbra, Portugal.
Provenance and peer review Not commissioned; externally peer reviewed.
Linked Articles
- At a glance