Article Text

Statistics from Altmetric.com
- Cerebrospinal fluid
- cisternography
- intracranial pressure
- papilloedema
- pseudotumor cerebri
- optic nerve
- imaging
Introduction
Patients with increased intracranial pressure (ICP) often develop papilloedema. This potentially vision-threatening ophthalmological condition results from transmission of the increased ICP to the subarachnoid space (SAS) of the optic nerve (ON). The associated increase in cerebrospinal fluid (CSF) volume in the perioptic space results in unfolding of the ON sheath, and it is believed that this, in turn, compresses the nerve, causing stasis of axonal transport, thus producing swelling of the ON axons.1–5 Pressure measurements in the SAS surrounding the ON have not been performed in this setting, but it has been assumed that the pressure in the SAS is the same as that measured during lumbar puncture and that there is free bidirectional flow of CSF between the intracranial SAS and the ON SAS. If this were the case, one would expect that reduction of pressure on the ON by, for example, a CSF diversion procedure such as a lumboperitoneal or ventriculoperitonal shunt or an ON sheath fenestration (ONSF), would result in resolution of papilloedema.6–8 In fact, it is not uncommon for papilloedema to persist despite an apparently functioning shunt or a successful ONSF.9 10 In such cases, permanent visual loss may result.11
Recent evidence suggests that the flow of CSF between intracranial SAS and ON SAS is neither continuous nor bidirectional.12 In patients with increased ICP and papilloedema, this may lead to CSF segregation and the development of a biologically unfavourable environment from a reduced CSF recycling time within the perioptic space. This phenomenon may account for the failure of CSF diversion procedures and ON decompression surgery in some patients.13
To further test this concept, we performed CT cisternography in 10 patients with increased ICP and compared the findings with those from two subjects with normal ICP who were enrolled in an ongoing prospective study unrelated to papilloedema. In addition, we determined the concentration gradient of lipocalin-like prostaglandin D synthase (L-PGDS) between ON SAS—obtained during ONSF—and lumbar CSF in seven of our patients with increased ICP. This gradient has been reported to be a biomarker of CSF segregation in the perioptic space.14
Materials and methods
Ten patients (mean±SD age 52.6±11.7 years; three men (59±3.5), seven women (49.9±13.1)) with papilloedema from various causes (eight with idiopathic intracranial hypertension (IIH), one with an astrocytoma, and one following bacterial meningitis) underwent complete neurological and neuro-ophthalmological examinations (including visual field testing) as well as MRI and lumbar puncture to establish the diagnosis and to document increased ICP. Nine of the 10 patients had bilateral papilloedema, and one had unilateral papilloedema on the left. All patients had been treated with acetazolamide. Because of lack of treatment efficacy or intolerance to the medication, these 10 patients, (nine of whom were still taking acetazolamide) subsequently underwent fluoroscopy-guided lumbar puncture in the lateral decubitus position, at which time opening pressure was measured, as was pressure during a Valsalva manoeuvre. CSF was collected and analysed for cells, albumin, IgG antibodies and L-PGDS, a protein present in the CSF that, in increased concentrations, has been shown to be toxic to astrocytes in vitro.15
For CT cisternography, all patients underwent an intrathecal injection of 10 ml contrast medium (iopamidol, molecular mass 778 Da; Iopamiro 300; Bracco, Milano, Italy) while in the lateral decubitus position at 20° of Trendelenberg. To accelerate the movement of the contrast medium intracranially, patients were moved into the prone position for 10 min. Cisternography was performed in the same room as the lumbar puncture; the interval between injection of the contrast material and cisternography was about 15 min. All patients were scanned in the prone position on a 64-detector scanner (Aquillion 64; Toshiba, Tokyo, Japan) providing 0.5 mm×32 section collimation. Scanning parameters were 25 cm field of view, 512×512 matrix, and a soft tissue and a bone reconstruction algorithm. The field of view included the foramen magnum and the nose. Multiplanar reconstruction images were obtained in the axial, coronal and sagittal planes with a 1 mm slice thickness.
CT images were analysed on a workstation using the AW (Advantage Workstation) 4.1 software (General Electric, Milwaukee, Wisconsin, USA). Contrast density was measured in Hounsfield Units (HU). Measurements were performed intracranially in the basal cisterns (pituitary and prepontine cisterns) as well as in the SAS along the orbital portion of the ON. To find the site with the highest contrast density, the curser was moved over the area of interest until the highest HU number was determined. The highest measurement in HU from the same location was then used in all patients to standardise the procedure. Axial sections were used, and the diameter of the portion of the ON sheath adjacent to the globe was measured always at its widest site to standardise the measurement of the diameter of the ON sheath (figure 1).

Coronal (A) and axial (B) CT cisternography in a patient with papilloedema shows markedly reduced density of contrast medium in the subarachnoid space surrounding the optic nerve (ON) compared with a patient without papilloedema shown to have normal intracranial pressure by lumbar puncture (C and D). (E) T2-weighted MRI scan of a patient with papilloedema demonstrates enlargement of the ON sheaths without rendering information about cerebrospinal fluid composition or flow dynamics. ON sheath diameter measurements are indicated by the thin white bars in (C) and (D).
Seven patients (mean±SD age 68.65.7 years; five men (67.0±5.3) and two women (68 and 77 years)) without ON disease underwent CT scanning (for maxillary and ethmoid sinus disease as requested by their otolaryngologist) with measurements performed as described above and served as controls for ON sheath diameter (ONSD). In addition, we performed CT cisternography in two healthy patients without papilloedema who had normal ICP and who were already enrolled in another study.
Seven of the 10 patients subsequently underwent ONSF because of progressive loss of visual acuity or visual field or inability to tolerate acetazolamide. CSF was sampled and L-PGDS concentration measured as described previously.12 14 16
For statistical analysis, the independent two-tailed t test was used (SPSS V14.0).
Results
CT cisternography
In the four eyes from the two control subjects without papilloedema who had normal ICP by lumbar puncture, the densities of contrast medium by CT cisternography in the SAS surrounding the ON ranged from 212 to 1005 HU (mean value 700±427.2 SD), and the densities in the basal cisterns ranged from 347 to 851 HU (mean value 599±356.4). In the 10 patients with increased ICP, densities of contrast medium in the 19 eyes with papilloedema were much less, ranging from 8 to 198 HU (69±52.9). In the nine patients with bilateral symmetric papilloedema, the densities of contrast medium in the SAS surrounding the right and left ONs were similar, with right ON SAS densities ranging from 8 to 161 HU (60±52.9) and left ON SAS densities ranging from 21 to 198 HU (82±54.6). The density of contrast medium in the SAS of the ON without papilloedema of the one patient with unilateral papilloedema was also low, measuring 20 HU. In all 10 patients, the densities of contrast medium in the intracranial SAS (ie, basal cisterns) were much higher than those in the ON SAS and similar to those in the two normal subjects, ranging from 428 to 716 HU (537±78.8) (figure 2) (table 1). Using an independent two-tailed t test, the difference between the densities in the SAS of ONs (ON-SAS) with papilloedema compared with those without was significant (p<0.01), assuming equal variances. The densities intracranially (IC-SAS) did not differ significantly between cases of ONs with and without papilloedema (p=0.11 assuming equal variances; p=0.44 equal variances not assumed).

Density of contrast-loaded cerebrospinal fluid (CLCSF) in the subarachnoid space (SAS) of the retrobulbar portion of optic nerves (ONs) with papilloedema (ON-SAS with PE; n=19 ONs) and without papilloedema (ON-SAS without PE; patients n=1; controls n=2), as well as in the intracranial SAS (IC-SAS) in patients (n=10) and controls (n=2). Note that there is a low density of CLCSF in the SAS of the ONs in the group of patients with bilateral as well as unilateral papilloedema, whereas the CLCSF density in the SAS of the ONs in the control group is similar to the density in the IC-SAS. Box plot indicating median value±quartile, maximum and minimum values (Hounsfield units).
Measurements for contrast-loaded cerebrospinal fluid (CSF) in the intracranial subarachnoid space (SAS) and in the SAS of the optic nerve (ON) using cisternography and optic nerve sheath diameter in CT, L-PGDS concentration in the CSF of the SAS of the ON obtained during optic nerve sheath fenestration and during lumbar puncture (LP) as well as measurement of intracranial pressure (ICP) during LP
ONSD measurements
The widest ONSD measured by CT scanning of 19 ONs with swollen optic disks from the 10 patients with papilloedema (nine bilateral, one unilateral) ranged from 6.4 to 10.9 mm (mean value 8.2±1.1 SD). In the nine patients with bilateral papilloedema, right ONSDs ranged from 7.2 to 9.5 mm (8.2±0.6) and left ONSDs ranged from 6.4 to 10.9 mm (8.0±1.4). In the one patient with unilateral papilloedema, the ONSD on the side of the papilloedema measured 9.7 mm, whereas the ONSD on the side without papilloedema measured 6.0 mm. In seven control subjects (14 ONs) without papilloedema, other ON disease or intracranial disease, ONSDs ranged from 6.0 to 7.1 mm (6.6±0.3), with measurements of 6.3 to 7.1 mm (6.7±0.3) on the right and 6.0 to 6.9 (6.5±0.3) on the left (figure 3) (table 1). The difference in ONSD between ONs with and without papilloedema (including normal controls) is highly significant (p<0.01), while the difference in ONSD between the ON without papilloedema and the normal controls is not significant (p=0.095).

Optic nerve sheath diameter in optic nerves (ONs) with fully developed papilloedema (ON with PE; n=19 ONs) shows that the sheaths are markedly unfolded compared with those of ONs without papilloedema (ON without PE; n=1 ON) or normal controls (Controls; n=14 ONs), as measured by CT. Box plot indicating median value±quartile, maximum and minimum values (mm).
Measurement of L-PGDS concentration
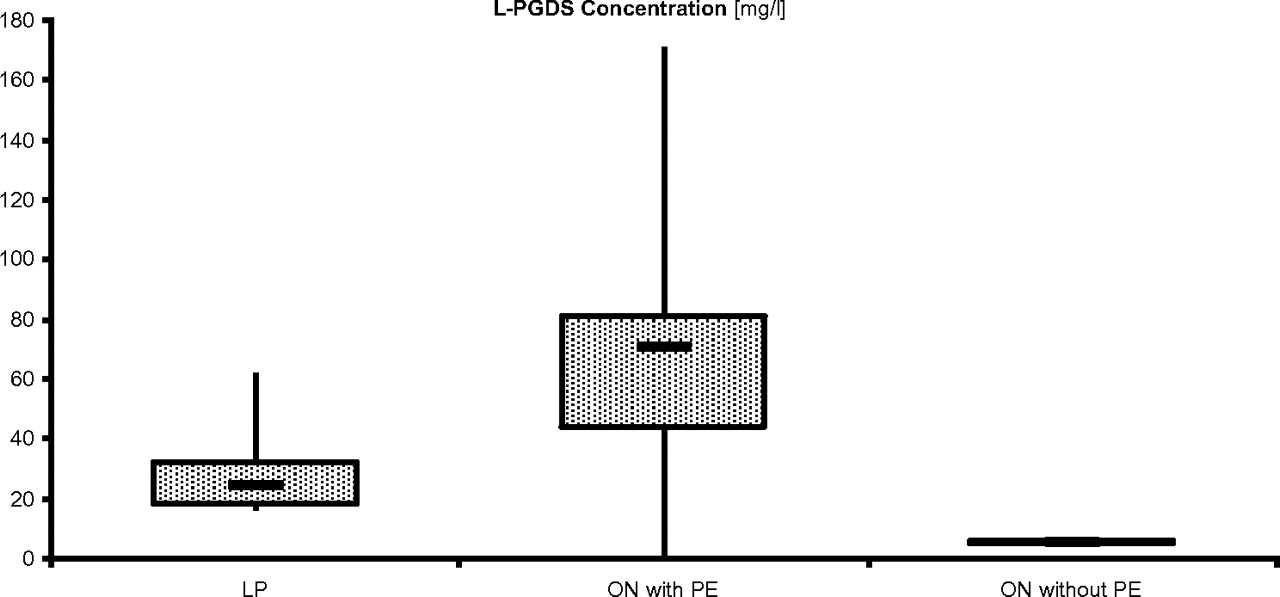
L-PGDS concentration in the CSF taken from the SAS of ONs at the time of ONSF (n=7) ranged from 0.2 to 170.0 mg/l (mean value 70.7±48.7 SD). L-PGDS concentration in the CSF taken from SAS of right ONs ranged from 1.9 to 170.0 mg/l (79.1±53.7), whereas L-PGDS taken from SAS of left ONs ranged from 0.2 to 132.0 mg/l (50.8±47.3). L-PGDS in the lumbar CSF (obtained at the time of lumbar puncture for cisternography, before ONSF) ranged from 17 to 61.6 mg/l (30.6±15.0) (figure 4). In two cases (patients 5 and 8), L-PGDS was not determined in the lumbar CSF (table 1). The difference between the L-PGDS concentration in the SAS of ONs (ON-SAS) with papilloedema compared with the ON without papilloedema (n=1) was not significant (p=0.23). The L-PGDS concentration in lumbar CSF did not differ significantly between ONs with papilloedema and ONs without papilloedema (p=0.46).

Concentration of lipocalin-like prostaglandin D synthase (L-PGDS) in cerebrospinal fluid taken from the lumbar subarachnoid space (LP) and from the subarachnoid space surrounding the optic nerves with papilloedema (ON with PE) and in control subjects (ON without PE). Box plot indicating median value ±quartile, maximum and minimum values (mg/l).
ICP measurements
Initial opening pressure and opening pressure at the time of cisternography in all 10 patients measured 25 cmH2O or higher. In the nine patients with bilateral papilloedema, opening pressures ranged from 25 to 50 cmH2O (34±9). In the patient with unilateral papilloedema, opening pressure was 25 cmH2O (table 1). Measurements of IgG and albumin concentrations in the CSF obtained by lumbar puncture revealed normal values in all patients and both controls.
Discussion
CT cisternography in 10 patients with papilloedema—eight of whom had IIH—demonstrated reduced contrast-loaded CSF (CLCSF) in the SAS of the ON compared with the basal cisterns. The lowest concentration of CLCSF was found in the bulbar region of the ON. In addition, a large concentration gradient of L-PGDS was measured between spinal CSF and CSF sampled from the SAS in seven patients in whom ONSF was performed. Both findings can be explained by CSF sequestration and ON SAS compartmentation.
Papilloedema is thought to be due to increased ICP that is transmitted to the SAS of the ON, where it causes stasis of axonal transport due to mechanical pressure1–5 17 18; however, not all patients with raised ICP develop papilloedema.19–24 In addition, in patients with increased ICP who develop papilloedema, the optic disk swelling may be markedly asymmetrical or even purely unilateral.25–29 Some of the factors thought to determine whether or not a patient with increased ICP develops papilloedema include the speed at which the ICP increases, variations in the anatomy of the CSF pathways (trabeculae and septae) mainly through the optic canal and through the SAS of the ON (figure 5), as well as the volume of the perioptic space, and whether or not the cranial sutures have fused.22 25 30 31 For example, increased unfolding of the ON sheath would, in the setting of increased ICP, allow more volume in the SAS of the ON without a marked rise in local pressure. On the other hand, obstruction of the SAS close to, or within, the optic canal in that setting might prevent papilloedema by blocking the CSF influx into the SAS of the ON.

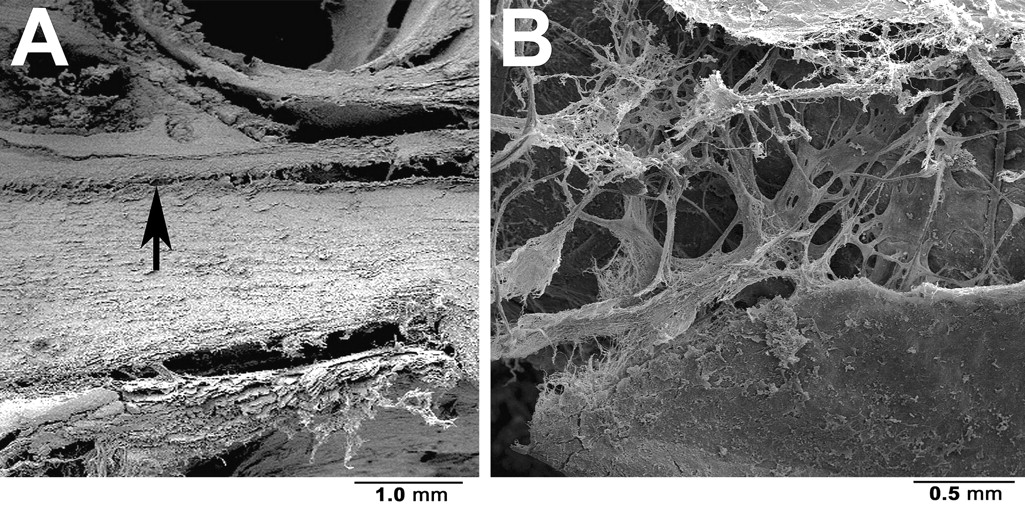
Sagittal scanning electron microscopy of the canalicular portion of a normal optic nerve. Note the narrow subarachnoid space (SAS) in the optic canal (arrowhead) (A) and the complex structure of trabeculae and septae bridging the SAS (B).
Although MRI is the most common method used to image the ON and SAS in patients with papilloedema, the findings, such as widening of the ON sheath, most profoundly in the bulbar region of the ON and flattening of the posterior sclera, are static and do not render information about CSF flow dynamics—that is, whether or not the CSF is moving and if it is in continuity with the CSF in the basal cisterns.32–34 Contrast-loaded CT cisternography, on the other hand, provides a dynamic view of CSF and also allows determination of whether the CSF in the basal cisterns has the same composition as the CSF in the SAS of the ON (figure 1). Using this technique, we found that the density of CLCSF is decreased in the SAS of ONs with papilloedema compared with its density in intracranial CSF spaces, in the SAS surrounding the ONs in patients without papilloedema, and, to a lesser extent, in the SAS of the ON in a patient with unilateral papilloedema on the contralateral side. In addition, our study indicates that the ONSD is larger on the side with papilloedema in a patient with unilateral papilloedema. These findings suggest that CSF flow is diminished through the SAS of the ON compared with flow through other CSF pathways. In agreement with a previous study, we also found a marked concentration gradient of L-PGDS between spinal CSF and CSF sampled during ONSF, with the concentration of L-PGDS being much higher in ON SAS than in intracranial SAS.12 As CSF sampling from the SAS of the ON is an invasive surgical procedure, we do not have a control group. However, even though we do not have enough measurements of L-PGDS concentrations from the SAS surrounding ONs in patients without papilloedema or even normal subjects to report reliable normal values, our findings support ON compartmentation with CSF segregation as a factor in the development of papilloedema and its role in the lack of response of some patients with papilloedema to surgical procedures designed to reduce pressure on the ON. In addition, given the high concentration of L-PGDS in the bulbar region of the SAS of the ON, it is possible that L-PGDS changes the viscosity of the CSF and thus increases the tendency for CSF segregation.
In most clinical settings, the ICP is measured by lumbar puncture, and the value obtained is thought to be representative of the pressure in all CSF spaces. The correlation between the pressure in the lumbar SAS and the ventricles was first challenged by Smyth and Henderson,35 who simultaneously measured the pressure in the lumbar SAS and the lateral ventricles in 39 patients. In 25 of the patients (64%), the pressure was identical, but in 14, there was a difference of 2–10 cmH2O. A more recent study compared the pressure during lumbar puncture with the cerebral parenchymal pressure in 10 patients with idiopathic normal-pressure hydrocephalus and found no significant difference between these two measurements.36 The authors concluded that the assumption that the pressure in the lumbar SAS and the ventricles is the same is correct, provided that the patients have communicating CSF systems.36 There are, however, several conditions, such as meningitis, arachnoiditis and mass lesions, that may markedly impair the communication of CSF in different parts of the central nervous system by altering the anatomy of the SAS and therefore also CSF dynamics.37 It is therefore important not only to know about the concentration of certain CSF components in that location, but also the local CSF pressure. Such measurements have been performed in cadavers and in patients before enucleation, but not in the setting of increased ICP.38 39 It is our hope that non-invasive methods of performing such measurements are impending.
From contrast-loaded CT cisternography in 10 patients with increased ICP and papilloedema, there is evidence for a lack of a continuous CSF flow and a reduced CSF turnover between intracranial CSF and CSF in the perioptic space in this group of patients. In addition, we found a marked concentration gradient of L-PGDS between spinal CSF and CSF surrounding the ON, suggesting CSF segregation.
We cannot offer a clear-cut explanation for the insufficient effect of acetazolamide in some of our patients; however, CSF segregation compartmentation and lack of compliance may play a role. Persistence of papilloedema may also be related to accumulation of debris in the axons, resulting in impairment of axoplasmic transport or mitochondrial dysfunction. We believe that these hypotheses should be investigated in an animal model, as the results may lead to better treatment options for patients with persistent papilloedema and progressive visual loss despite apparently functioning lumboperitoneal, ventriculoperitonal or ventriculoatrial shunts or apparently successful ONSF.9 10
Some weaknesses of this study need to be addressed. Firstly, because CT cisternography is an invasive procedure with potential complications (eg, dye sensitivity), we have only two healthy ‘control subjects’ in whom the procedure was performed; however, we do know that these patients had normal ICP. Secondly, L-PGDS has never been measured in normal people, and thus we can only compare the relative concentrations in the SAS of the ON with those in the lumbar SAS. Thirdly, the patients reported on herein represent a subgroup with papilloedema who either did not tolerate acetazolamide or did not respond adequately to the medication. Most of the patients had IIH, and thus we cannot state with certainty that our findings can be extrapolated to all patients with papilloedema, although the fact that there was no major difference in our findings between the patients with IIH and the patients with increased ICP from other causes suggests that such an extrapolation is appropriate.
Finally, we would emphasise that we do not advocate cisternography as a primary procedure in the evaluation of patients with papilloedema, but we believe that this is a useful technique in the attempt to understand the mechanisms that lead to papilloedema and ON damage in such patients and to tailor appropriate treatment to them so as to prevent or reverse visual loss.
Acknowledgments
We thank P Groscurth, MD (former head of Anatomy, University of Zurich, Switzerland) for the scanning electron microscopic images.
References
Footnotes
Competing interests None.
Provenance and peer review Not commissioned; externally peer reviewed.