Article Text

Abstract
Background/aims Although studies using optical coherence tomography (OCT) reported that the retinal nerve fibre layer (RNFL) thickness of myopic eyes was thinner than those of normal controls, it was unclear if this finding indicated the difference in actual structural thickness or that created by sources affecting accuracy of OCT measurement. This study's aim was to evaluate the effect of refraction power on the measurement of the RNFL thickness using spectral-domain OCT.
Methods OCT scans to measure RNFL thickness were repeated in 15 cycloplegic eyes of 15 participants, while different refraction powers were induced by wearing soft contact lenses of eight different dioptres (−6 to +8).
Results Measured RNFL thicknesses decreased significantly with soft contact lenses of higher plus dioptres and increased with those of more minus dioptres. This finding was consistent with or without controlling factors including the signal strength and test–retest variability of the machine. Measurement of peripapillary RNFL thicknesses was not varied between scans performed with and without plano contact lenses.
Conclusions In spectral-domain OCT, RNFL thickness was underestimated in eyes with increasing negative refraction power and overestimated with increasing positive refraction power.
- Myopia
- retinal nerve fibre layer
- optical coherence tomography
- optic nerve
- imaging
- diagnostic tests/investigation
Statistics from Altmetric.com
- Myopia
- retinal nerve fibre layer
- optical coherence tomography
- optic nerve
- imaging
- diagnostic tests/investigation
Glaucoma is a progressive optic neuropathy associated with retinal ganglion cell death that manifests itself as increased optic disc cupping and retinal nerve fibre layer (RNFL) thinning. Currently, the diagnosis of glaucoma is based on a serial analysis of the optic disc morphology, RNFL thickness and standard perimetry. RNFL thickness can be quantified by optical properties of RNFL, using instruments such as optical coherence tomography (OCT).1 Currently, spectral-/Fourier-domain OCTs are widely used in measuring RNFL thickness.2–4
There have been a number of OCT studies in which RNFL thicknesses in myopic eyes are reported to be thinner when compared with those of normal controls.5 6 However, it is unclear if this finding indicates the actual difference in structural thickness or the difference created by sources affecting accuracy of OCT measurement. Theoretically, the OCT optical system is known to be affected by a magnification factor related to the eye attributable to axial length and refraction power difference from default values.7 8 Nevertheless, their actual presence or magnitude has never been evaluated in clinical settings. Axial length is usually constant in adulthood. However, during patients' longitudinal follow-ups, clinicians may encounter various circumstances where patients' refraction powers may be changed either temporarily, owing to the wearing of contact lenses, or permanently, owing to surgery that induces refraction power change (laser-assisted in situ keratomileusis (LASIK), laser-assisted subepithelial keratectomy (LASEK), phakic intraocular lens implantation, or cataract surgery, etc). Changes in morphology and the refraction index of lenses with ageing also result in refraction power change. Evaluating the effect of refraction power on OCT measurements would result in a better understanding of studies on RNFL thinning in myopic eyes,5 6 safety of LASIK or LASEK in relation to pre- and postoperative RNFL thickness,9 10 and the effect of cataract surgery on RNFL parameters using OCT.11–13
In this study, we investigated the effect of refraction power on the measurement of RNFL thickness using OCT by comparing RNFL measurements of scans repeated in the same subjects with soft contact lenses of different dioptres (D). Changes in RNFL thickness measurements with contact lenses of different dioptres were analysed with and without controlling confounding factors, those that may affect RNFL measurement. An OCT scan was also performed with and without soft contact lenses in order to evaluate the lens effect alone.
Methods
Subjects
Among 20 healthy Korean participants, five subjects each for three different refractive error groups (a total of 15 subjects) (emmetropia, between +0.5 and −0.50 D; mild myopia, between −1.00 and −6.0 D; and high myopia, −7.0 or higher myopia) who met the inclusion criteria were recruited. All subjects were examined in the Eye Centre, the Yonsei University Severance Hospital of Seoul, Korea during the recruitment period from October 2009 to December 2009. All subjects underwent a full ophthalmic examination including visual acuity, intraocular pressure measurement by Goldmann tonometer, autorefraction, manifestation refraction, slit-lamp examination, dilated fundus examination by indirect ophthalmoscope and axial length by IOL-master (Carl Zeiss Meditec, Dublin, California). All included eyes had no concurrent ocular pathological features except the refractive error, and they had a best-corrected visual acuity of at least 20/25. Subjects with evidence of macular disease or peripapillary atrophy extending more than 1.73 mm from the centre of the optic disc (location determined by looking at the 1.73 mm radius scan circle in RNFL thickness deviation map provided by the Cirrus OCT scan), intraocular pressure of more than 21 mm Hg, previous intraocular surgery, any media opacity and those who were diagnosed as having any general disease including diabetes were excluded. This study was approved by the institutional review board and ethics committee of Yonsei University Severance Hospital. Informed consent was obtained from the studied subjects. The study followed the principles of the Declaration of Helsinki
OCT technique
Optical coherence tomography was performed with Cirrus HD-OCT (software version 3.0.0.50; Carl Zeiss Meditec, Dublin, California). In an effort to eliminate the effect of accommodation and pupil size of each subject, an OCT scan was performed 30 min after applying one drop of 1.0% cyclopentolate HCl (Cyclogyl; Alcon, Fort Worth, Texas) to achieve cycloplegic and mydriatic effects. The OCT scan was performed by a single experienced technician.
To analyse the effect of contact lenses on peripapillary RNFL measurement, OCT scans were performed with and without plano (0 D) soft contact lenses (NewGen; Bescon Co, Cheonan, Korea) being worn on 30 eyes of 15 participants. To evaluate the effect of induced refraction power by contact lens, one randomly chosen eye from each subject of 15 participants underwent OCT scans wearing soft contact lenses of seven different dioptres (−6, −4, −2, +2, +4, +6 and +8) in random order. For example, wearing soft contact lenses of +8 D would induce a refraction power change of −8 D. In each condition, OCT scans were repeated until two scans with a signal strength of 5 or higher were acquired.
Peripapillary RNFL thickness was measured with the optic disc cube 200 × 200 protocol. In this protocol, the software automatically determined the centre of the disc at the cube data set and extracted a circumpapillary circle (1.73 mm radius) for peripapillary RNFL thickness measurement.
Statistically analysis
Statistical analyses were performed using R software version 2.10.1 (GNU General Public License). The four quadrants and mean RNFL measurements were obtained from each OCT scan. To evaluate the effect of wearing contact lenses, RNFL measurements and signal strength of OCT scans with and without plano contact lenses were compared using a paired t test. An analysis of variance (ANOVA) was used to test differences in a mean RNFL thickness between groups of various degrees of myopia. A multiple comparison with Bonferroni correction was done when the difference was significant.
The effect of induced refractive error on RNFL thickness was analysed with and without controlling confounding factors, those that may affect RNFL measurements. First, means of RNFL measurements with various induced refraction power were compared by a repeated-measure analysis of variance (RMANOVA) without controlling any other factors. An analysis of covariance (ANCOVA) in a randomised block design was then used to evaluate the effect of signal strength on RNFL measurement, as signal strength has been reported to have a significant impact on the measurements of RNFL in OCT.14–16 This multivariate model included induced refractive power, degree of the patient's refractive error (degree of myopia; emmetropia, mild myopia or high myopia), signal strength as a covariate, and patients in blocks. The test–retest variability was calculated as twice the SD of the two repeated measurements for each measure of RNFL thickness. A multivariate ANOVA (repeated-measure design) was performed to analyse the effect of induced refractive power on RNFL measurement with controlling confounding factors, those that may affect RNFL measurement. This model induced refractive power as the repeated factor, degree of myopia as the between-subject variance component, test–retest variability as the within-subject variance component and patients in blocks. RNFL thickness measurements in this multivariate model were those adjusted for signal strength. The change in RNFL measurement by induced refractive error was expressed as a ratio, defined as (measured RNFL thickness with induced refractive error–measured RNFL thickness with induced refractive error of zero)/measured RNFL thickness with an induced refractive error of zero. A p value of <0.05 was considered statistically significant.
Results
A total of 30 eyes from 15 subjects (14 male and one female) with a mean age of 24±3.80 years (range 19 to 30 years) were included (table 1).
Patient characteristics
Effect of wearing soft contact lenses on peripapillary RNFL measurement
Average and quadrant RNFL thickness measurements with and without plano soft contact lenses are described in table 2. Neither measured RNFL thickness nor signal strength was different between OCT scans with and without plano soft contact lens.
Mean and quadrant retinal nerve fibre layer thicknesses with and without plano soft contact lenses measured by Cirrus optical coherence tomography (n = 30)
When peripapillary RNFL thickness was measured with plano soft contact lens, the mean RNFL thickness was different between groups of various degree of myopia (ANOVA, p = 0.015). The mean RNFL thickness was thinner in the high myopia group (87.8 μm) than those of emmetropia and moderate myopia groups (98.3 and 97.5 μm, for emmetropia and moderate myopia groups, respectively) (multiple comparison, all, p<0.05). These findings were consistent in eyes without plano contact lenses.
Effect of induced refractive error on peripapillary RNFL measurement
Mean and quadrant RNFL thicknesses were significantly different among the groups with different refraction power induced by wearing soft contact lenses (table 3). Peripapillary RNFL thickness was underestimated in eyes with negatively induced refraction power (wearing soft contact lenses of plus dioptres) and overestimated in eyes with positively induced refraction power (wearing soft contact lenses of minus dioptres) when compared with those with an induced refraction power of zero (wearing plano soft contact lens) (multiple comparison, all, p<0.001). The change ratio in which the measured RNFL thickness was different was 0.50, 0.54, 0.55, 0.50 and 0.44 per induced dioptre for mean RNFL, superior, nasal, inferior and temporal quadrant maps, respectively. The signal strengths of OCT scans were not different among groups with different induced refraction powers.
Retinal nerve fibre layer (RNFL) thicknesses measurements and signal strength in different induced refraction power in Cirrus optical coherence tomography (n = 15)
The test–retest variability in RNFL thickness measurements ranged from 4.9 to 7.9 μm (table 4). Signal strength had a significant effect on RNFL measurement with a 0.90 μm thicker mean RNFL measurement for every signal strength increase (p<0.001, ANCOVA in a randomised block design). The effect was significant in mean RNFL and all quadrant maps. The effect of refraction power induced by wearing soft contact lenses on RNFL measurement was evaluated after the test–retest variability and signal strength of OCT scan were considered (table 5). Peripapillary RNFL measurement by OCT was significantly affected by induced refractive error, even after other confounding factors were controlled. Again, the RNFL thickness of same subject was underestimated when the induced refractive power was more myopic and overestimated when the induced refractive power was less myopic or more hyperopic dioptres (multivariate analysis, p<0.0001, fitted regression slope of 0.28∼0.64 μm per dioptre; table 5) (figure 1). The effect of induced refraction power on RNFL measurement by OCT was not influenced by the degree of the patient's pre-existing myopia. RNFL thickness measurement with different refractive power adjusting for signal strength is described in table 6. The finding in which peripapillary RNFL thickness was underestimated in eyes with negatively induced refraction power (wearing soft contact lenses of plus dioptres) while overestimated in eyes with positively induced refraction power (wearing soft contact lenses of minus dioptres) when compared with those with induced refraction power of zero (wearing plano soft contact lens) was statistically significant even after controlling factors those possibly affect RNFL measurement, that is, degree of myopia, test–retest variability of the OCT, signal strength and interpatient variability.
Test–retest variability and effect of signal strength on retinal nerve fibre layer thickness measurement in Cirrus optical coherence tomography
Factors affecting peripapillary retinal nerve fibre layer (RNFL) measurement in Cirrus optical coherence tomography
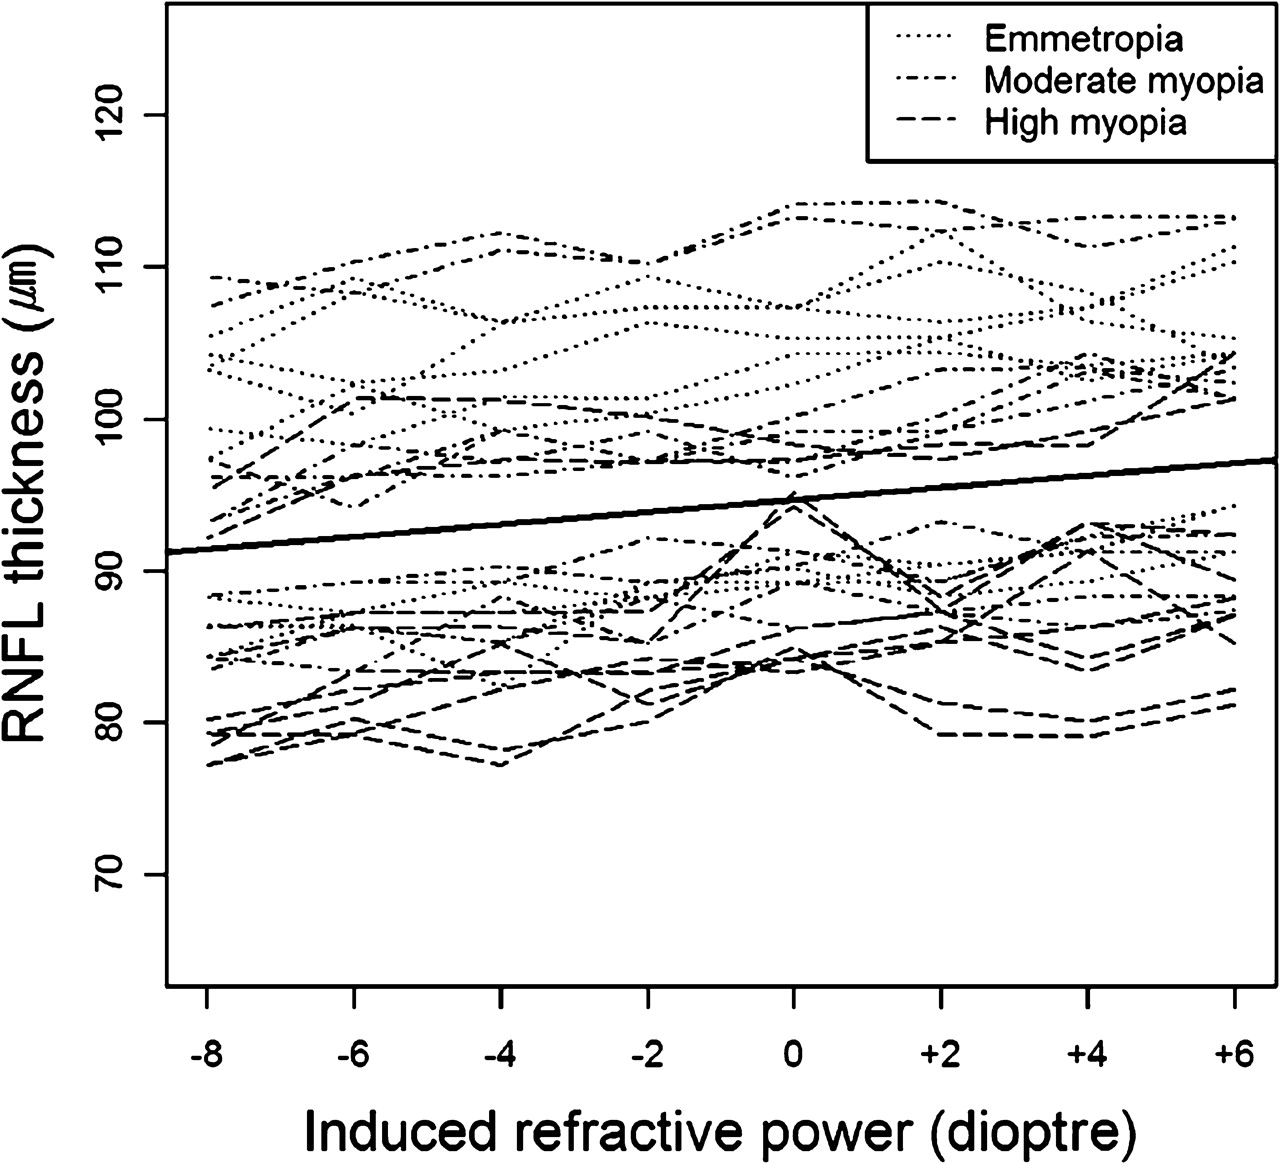
Plot of mean retinal nerve fibre layer (RNFL) thickness (μm) over various induced refractive powers (D). The solid line is the fitted regression line with a slope of 0.40 μm per dioptre (0.50 μm per dioptre in the model where confounding factors are not controlled) and a p value of <0.001.
Adjusted retinal nerve fibre layer (RNFL) thicknesses measurements in different induced refraction powers in Cirrus optical coherence tomography (n = 15)
Discussion
In this study, peripapillary RNFL thickness was underestimated with increasing negative or myopic refraction power and overestimated with increasing positive or hyperopic refraction power. This finding was not influenced by confounding factors such as the signal strength14–17 and test–retest variability18 19 of the machine, which might affect RNFL measurement. Although studies using OCTs reported that RNFL thicknesses of myopic eyes were thinner than those of normal controls, it was unclear if this finding indicated the difference in actual structural thickness or that created by sources affecting the accuracy of OCT measurement. This study aimed to evaluate the effect of refraction power on the measurement of the RNFL thickness using spectral-domain OCT and is the first to analyse the effect of refraction power on the accuracy of RNFL thickness measurement by comparing OCT measurements of the same object.
When Leung et al6 evaluated RNFL thickness in myopia, they found that RNFL was thinner in highly myopic eyes than in eyes with low to moderate myopia. In their study, they compared RNFL thicknesses between subjects with different degrees of myopia and reported a mean RNFL decrease of approximately 1.1 μm per minus dioptre. In the current study, the mean RNFL thickness underestimation was 0.5 μm per minus dioptre (with a mean RNFL thickness of 100 μm). Although a direct comparison cannot be made, since Leung et al used Stratus OCT, while we used a later-generation, Cirrus OCT, we can presume that part of their finding might have been caused by RNFL over-/underestimation by refraction power instead of actual anatomical RNFL thickness difference between myopic and non-myopic eyes. As RNFL thickness measurement was underestimated in the OCT scan with increasing negative refraction power, in some circumstances, when the RNFL thickness lies near the margin of normative data, the image obtained with negative refraction power may even be diagnosed falsely to have an RNFL defect, as illustrated in figure 2. Furthermore, in studies which compared preoperative and postoperative RNFL thickness in subjects with corneal refractive surgery, the authors reported that there was no change between preoperative and postoperative RNFL thicknesses without considering changes in the refraction status of subjects.9 10 However, since the surgery was to correct myopic refractive error, it would have caused increasing positive refraction power (or decreasing negative refraction power) on RNFL measurement and might have resulted in an overestimation of RNFL thickness. Compensating changes in refraction power of these previous studies may result in different findings.
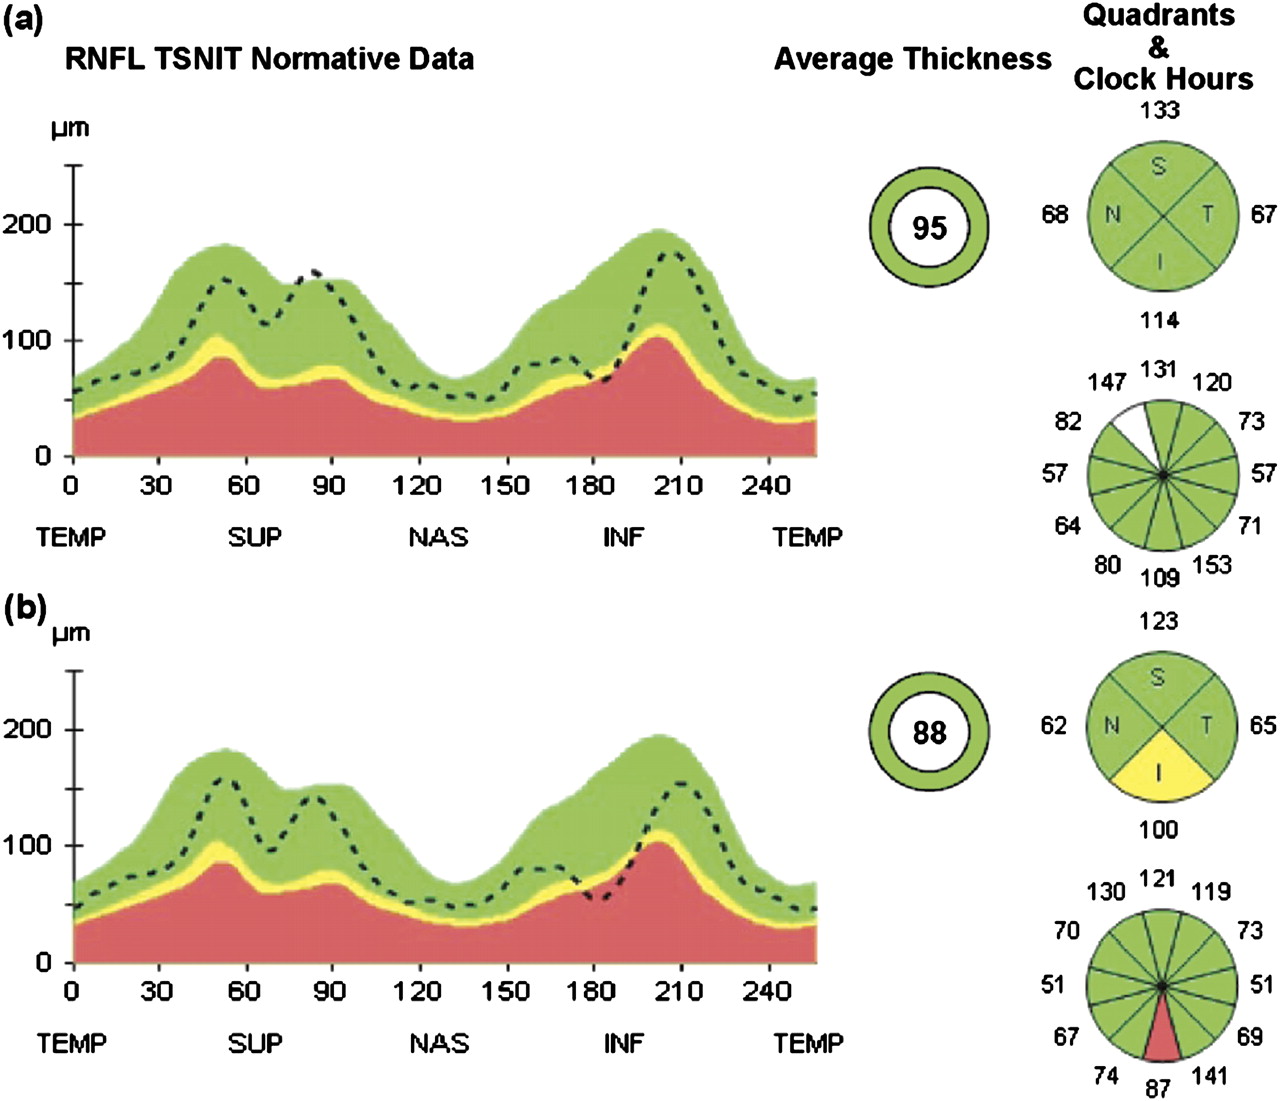
Retinal nerve fibre layer (RNFL) profile of a single participant obtained with an induced refraction power of +6 D (A) and −8 D (B). Signal strength was 8 and 9, respectively. The RNFL thickness measurement is lower in the scan with an induced refraction power of −8 D (B). The temporal, superior, nasal, inferior, temporal (TSNIT) normative data (dot line) is generally lower, and a nerve-fibre layer defect, which was not visible with induced refraction power of +6 D (A), was noted with an induced refraction power of −8 D in the quadrant and clock hour map (B). I/Inf, inferior; N/Nas, nasal; S/Sup, superior; T/Temp, temporal.
Although this study has confirmed that the negative refraction power causes an underestimation of RNFL thickness, we have not revealed where the source of the error in estimation of RNFL thickness came from. We think that the change in the position of the peripapillary locus where RNFL thickness was assessed, or scan radius, resulted in such an outcome. Although Cirrus OCT has been designed to measure peripapillary RNFL thickness (1.73 mm radius), the actual scan diameter could have been influenced by refractive power.8 An increase in actual scan diameter by myopic refraction power would result in an underestimation of peripapillary RNFL thickness, since RNFL becomes anatomically thinner with increasing distance from the disc margin.20–22 In contrast, a macular cube 512 × 128 scan of Cirrus OCT, which has been devised to measure central subfield thickness (1.0 mm diameter), would overestimate central macular thickness as the central retina becomes anatomically thicker with increasing distance from the foveal centre (figure 3). However, as the current study aimed to evaluate the effect of refraction power on peripapillary RNFL thickness measurement, its presence or the magnitude on foveal thickness measurement by OCT should be evaluated in future studies.

Macular cube 512 × 128 scan of a single participant obtained with an induced refraction power of +6 D (A) and −8 D (B). A central subfield thickness measurement (central innermost circle at right hand corner) of a scan with an induced refraction power of −8 D (B) is higher than that of an induced refraction power of +6 D (A) (250 and 240 μm, respectively). The macular cube centred at fovea was relatively larger in the scan with an induced refraction power of −8 D (B) (upper left and lower left corners of macular cube closer to retinal vessels, arrowheads) when compared with that with an induced refraction power of +6 D (A) (upper left and lower left corners of the macular cube further from retinal vessels, arrow).
Recently, Kang et al23 reported that after adjusting the ocular magnification, the mean RNFL thickness determined by Cirrus OCT showed no correlation with the spherical equivalent and only a weak positive correlation with the axial length. In contrast, before adjusting the ocular magnification, the mean RNFL decreased with spherical equivalent and increased in axial length. These findings by Kang et al also exhibit that many previous studies5 6 reporting a decreased mean RNFL thickness in myopia may have resulted from measurement over-/underestimation instead of the true anatomical difference. However, the Littman-based formula24 and the ocular magnification factor from Bennett et al employed by Kang et al were devised based on the assumption that axial ametropia as the norm that presence of any other source of refractive anomaly, those attributed to the lens or anything but axial length would result incorrect measurement adjustment.25 Also, the ocular magnification adjustment has a limitation in that the total cross-sectional area of the total cross-sectional area of the RNFL under the circle in the magnified scan is not exactly equal to that of the RNFL under the actual scan circle.23 Although the current study and that by Kang et al both have a few limitations in reproducing the exact clinical setting, they both revealed that previously reported RNFL thinning in myopia may apart from true anatomical difference in some degree.
In this study, the effect of refraction power on RNFL thickness measurement by OCT was analysed by comparing repeated OCT scans from the same eye with soft contact lenses with different dioptres. Wearing soft contact lenses to obtain scan with different refraction power in the same eye, however, is limited by the fact that its physiological environment may be different from the eye whose refraction power has been changed by corneal ablation or intraocular lens implantation (phakic or pseudophakic).
To evaluate if there were any effects of wearing soft contact lenses other than inducing refraction power change, we compared the RNFL thickness of the same eye with and without plano soft contact lenses and found no differences between them. To minimise the effect of other factors possibly influencing RNFL thickness measurement, the pupil was dilated, and participants were encouraged to blink to prevent corneal dryness between repeated scans.11 26 27 Individuals with media opacity were excluded, and a minimal signal strength of 5 was required.14–17 A cycloplegic agent was used to prevent object accommodation.
In conclusion, peripapillary RNFL thickness as measured by spectral-domain Cirrus OCT was negatively correlated with negative refraction power. Peripapillary RNFL thickness was underestimated with increasing negative or myopic refraction power and overestimated with increasing positive or hyperopic refraction power.
References
Footnotes
Funding This research was supported by the Basic Science Research Programme through the National Research Foundation of Korea (NRF) funded by the Ministry of Education, Science and Technology (No 2009-0076736).
Competing interests None.
Patient consent Obtained.
Ethics approval Ethics approval was provided by the Ethical committee of Yonsei University College of Medicine.
Provenance and peer review Not commissioned; externally peer reviewed.