Article Text

Statistics from Altmetric.com
Scenario 1
A senior colleague has conducted a study and asks me to analyse their data. They give me an excel spreadsheet containing 80 observations of intraocular pressure (IOP)—40 of which were made after using drug A and 40 of which were made after using drug B (see table 1).
80 observations of IOP
My colleague asks me to find out whether drug A or drug B is better in terms of reducing IOP. I think back to my medical school training and recall something called a t test, which I believe may be relevant. Using the internet I discover that there is indeed a t test and that the t test can be used to compare the means of two groups. I apply the test and feedback the results (including a two-tailed p value of 0.0024) to my colleague (see online supplementary appendix 1, figure S1 for results of analysis). The paper is written and submitted. After some time, it is returned with several comments made by reviewers. One of these questions is whether I have assessed the assumptions made by a t test. I must admit to not being entirely clear what this sentence means. Using the internet once more, I learn that the p value I quoted to my colleague has been calculated using statistical theory, but that if this p value is to be regarded as robust or valid, my data must adhere to some rules (or assumptions). Assumption 1 of the t test is that my data follow approximate normality. I draw a histogram of my IOP observations and see that it looks roughly symmetric, which reassures me somewhat as evidently rough normality can be assumed with an approximate symmetric histogram (see figure 1).

Histogram of 80 observations of intraocular pressure (overall and by drug group).
Assumption 2 is that the data points are independent. I am not familiar with the term independent in this context, but using the internet I find that statistically independent means no relationship between data points. I have 40 IOP observations made on drug A and 40 made on drug B. I email my senior colleague to check that the observations are not made on the same subjects—for example, the 80 measurements might actually relate to measurements on 40 patients each treated with both drug A and drug B. If this is the case, then I have measures of IOP after treatments A and B on the same patients and it seems clear to me that there will be a relationship between IOP measurements made on the same patient. My colleagues’ response comes with good and bad news. I am reassured that the subjects treated with drug A are not the same as those treated with drug B. I am also told, however, that there are actually only 10 patients on drug A and 10 on drug B. Further discussion reveals that my dataset consists of two observations on the right eye and two observations on the left eye of each subject (see table 2). Suddenly my dataset has revealed a complication that I simply hadn't considered. There are multiple observations and related observations. Clearly independence isn't adhered to... (see online supplementary appendix 1, figure S2 for results of analysis of the mean IOP in either the left or the right eye).
80 observations of IOP revealing previously hidden data complexities
Discussion
This scenario illustrates what is known as the ‘unit of analysis’ issue.1 Clinicians treat patients. They may treat the symptoms of patients, but the focus is still on the patient. In statistical terminology, the patient is the sampling unit and should be the unit of analysis. Multiple observations may be made on patients, but the statistical analysis must not ignore the fact that these observations are made on individuals. Failure to do so violates the assumption made by the majority of statistical tests that each data value is independent. Multiple observations from the same patient falsely inflate your sample size, sometimes dramatically so, leading to spurious statistical significance.
Failure to account for unit of analysis issues is common in medical research, and certain areas of medicine are more prone to such errors than others.2 For a variety of reasons, including stereoscopic vision and greater visual field, mankind has evolved with two eyes. While clearly advantageous for the patient, evolution did not take into account the challenges this might present to ophthalmic researchers who unlike their cardiology peers routinely face unit of analysis issues.3 Caution is recommended when assessing results of any ophthalmic paper that simply presents results on eyes. It is important to determine how many patients these eyes came from to allow an assessment of whether or not any patients have contributed fellow eyes so presenting unit of analysis issues.
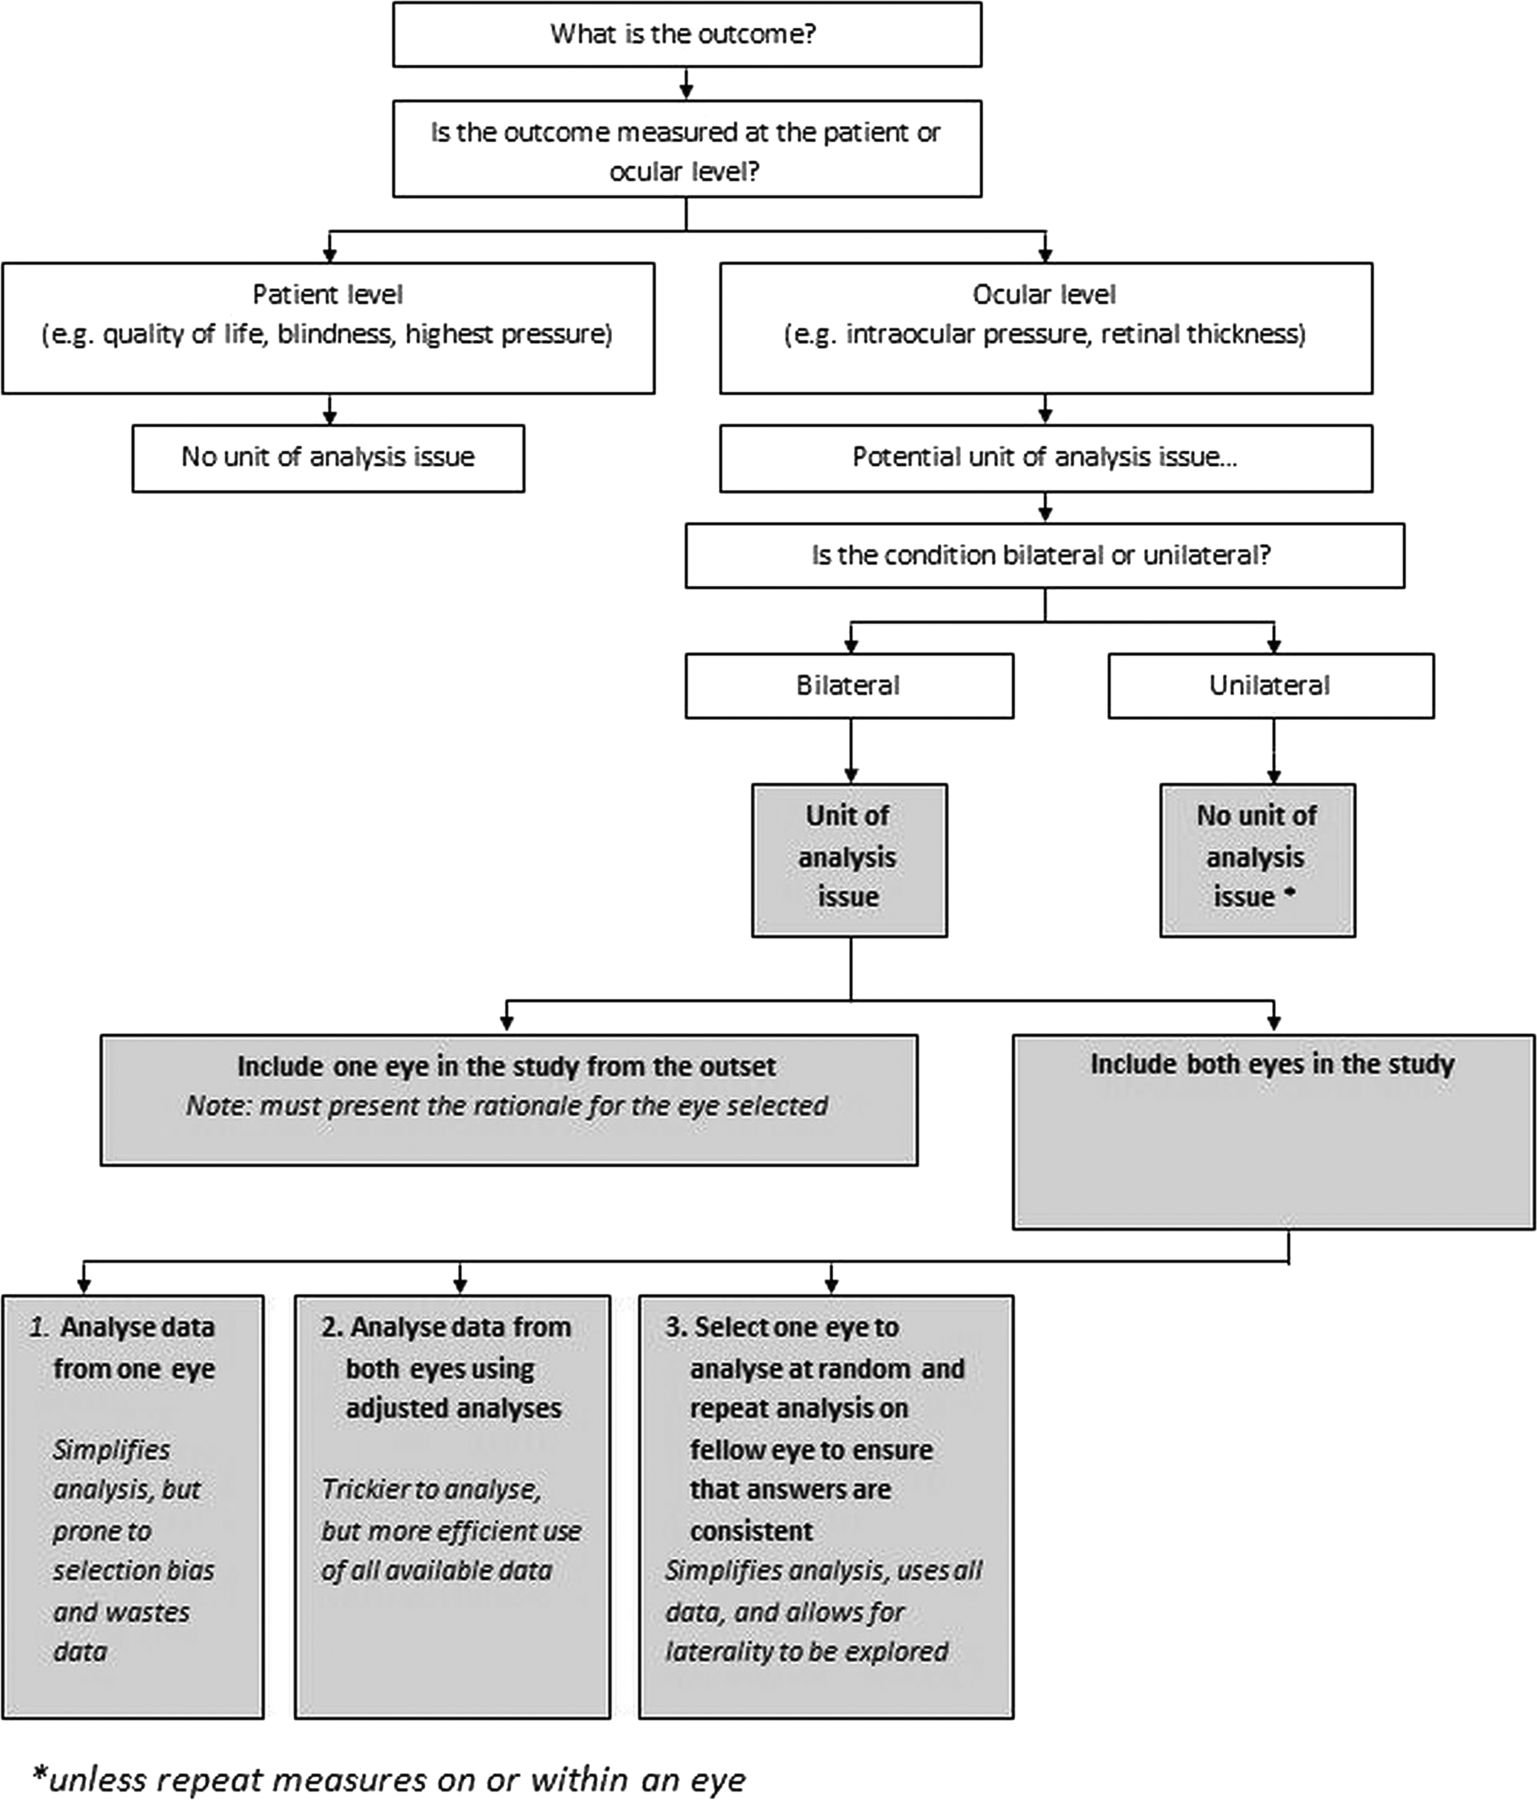
When designing any ophthalmic research, it is important to think carefully about unit of analysis issues at the outset. First, consider the question that the research is attempting to answer with particular focus on the outcome to be assessed. If the outcome is measured at the patient level, for example, a quality-of-life measure such as the VF14 or the Sickness Impact Profile, there may be a single observation per patient and so no unit of analysis issue.4 ,5 If the outcome is measured at the ocular (eye) level such as logMAR visual acuity or retinal thickness, then there may be a unit of analysis issue. If the condition under consideration is typically unilateral (affecting only one eye, perhaps ocular trauma) and the outcome is measured at the ocular level, then there will be no unit of analysis issue. Treating the patient involves treating only the affected eye and thus measurements will only be made on that eye. If the condition under consideration is frequently bilateral (affecting both eyes, perhaps glaucoma) and the outcome is assessed at the ocular (eye) level, so that you have two observations per person (one for each eye) for some patients, you are likely to encounter unit of analysis issues.
Scenario 2
A senior colleague asks me to analyse data from a clinical trial that they have conducted comparing different intraocular lenses after cataract surgery. They tell me that the dataset contains data on both eyes but that in all cases the patients have received the same type of intraocular lens for each eye. They want to know whether any change in logMAR visual acuity measured using an ETDRS chart at 4 m differs between the two lenses. Table 3 presents such data, and it can be seen that there are measures for right and left eyes of each patient. These pairs of values are not independent of each other because they originate from the same patient.
Change in logMAR visual acuity (VA)
I decide that to deal with non-independence, I will create a summary measure for each patient.6 I decide in this case to do this by selecting one measure per patient. If I select an eye from a patient at random, I find there is little evidence of a difference between the lenses. However, it is possible to subvert this process. Suppose for each patient I choose the eye with the greater change if lens A was used, but the eye with the lesser change if lens B was used. A t test on the selected eyes now indicates that there is evidence of an association of greater changes in visual acuity with lens A than lens B. However, a t test comparing visual acuity in the fellow eyes shows that lens B leads to a greater change in visual acuity than lens A. (See table 4 for a summary of the results and online supplementary appendix 1, figure S3 for more detailed results of the analysis applying each selection criteria).
Change in logMAR VA: summary of results
Discussion
Scenario 2 illustrates how single eye studies may be at risk of selection bias. Selecting an eye having observed results can distort findings. Selecting an eye at random might be appropriate, but if this option is taken it is wise to repeat the analysis on the eye not selected to ensure that the results are consistent and that all data were used and not simply wasted. There may be a clear rationale for selecting a particular eye—the dominant eye, for example, in a study addressing visual acuity or the eye first receiving treatment. You may also wish to analyse right and left eyes separately to assess whether there is any association between laterality and the disease of interest.7–9 An alternative to selecting an eye at random might be to create a summary measure that is patient dependent. For example, if vision is assessed, one might argue that it is the vision in the better eye that is of more interest to the study objectives, in which case that eye might be selected. Some people advocate calculating a summary measure of right and left eyes for each patient—for example, the mean IOP being the mean of the right eye pressure and the left eye pressure.3 This might be statistically valid but may be clinically unwise. For example, as shown in table 5, imagine you have a patient with a right eye IOP of 22 mm Hg and a left eye pressure of 32 mm Hg who is treated in a clinical trial on ocular hypertension. Suppose there is a reduction of 10 mm Hg with treatment in each eye. Post-treatment, the right eye has a pressure of 12 mm Hg and the left eye has a pressure of 22 mm Hg. Taking the mean pressure would give you a post-treatment pressure of 17 mm Hg, which might lead you to conclude that you have lowered the pressure sufficiently in both eyes. Yet the left eye still has a pressure of 22 mm Hg, indicating it may still require treatment to reduce the pressure. If the pressure in the right eye has reduced by 11 mm Hg and in the left eye by a pressure of 9 mm Hg, the left eye would now have a pressure of 23 mm Hg. Clearly one would expect the reduction in fellow eyes to be similar, but marked differences can and are observed in trials.
There are statistical techniques that allow data from both eyes to be used and review articles that summarise these.3 ,10 ,11 These techniques require varying degrees of statistical expertise, and a very clear guide on their use has been provided by Armstrong.12 Generalised linear modelling provides a framework that enables the true structure of the dataset to be explored, but this may require more statistical knowledge than most practising clinicians wish to acquire. To summarise, studies where fellow eyes have been treated similarly require cluster-type analytical techniques, while studies where fellow eyes have received different treatments require techniques for paired data.
Scenario 3
You have a glaucoma study where all patients are bilaterally affected, patients typically demonstrating symmetric disease. Could you and indeed should you now treat one eye with one treatment and the other eye with another treatment?
Discussion
Some researchers advocate this design arguing that a comparison of treatments between fellow eyes makes ideal use of the fact that the eyes are similar genetically and environmentally and differ only in treatment. By keeping genetic and environmental factors constant, the power of a study is increased and fewer patients may need to be recruited. Careful thought, however, is needed as to whether these arguments are valid for a particular scenario. Clearly it is inappropriate to treat fellow eyes with different treatments if the outcome of the study is assessed at the patient level—unless perhaps treatment for each eye is over different time periods. Even in this case, however, response to the first treatment might influence response to treatment in the fellow eye.13 If the outcome is measured at the ocular level, is there any possibility that treatment given to one eye might influence the outcome in the fellow eye perhaps by a centrally mediated response or systemic effects?14 Patient views should also play a key role in choice of study design, anecdotal evidence indicating strong views for fellow eyes to be treated similarly.
Lesson learnt: unit of analysis
Eyes exist in patients, and typically patients have two eyes. This presents challenges in the design, analysis and interpretation of ophthalmic research. This is an issue that has been highlighted previously. It is, however, an issue that still frequently gives rise to statistical errors and it is not uncommon for studies that are brilliant in terms of methodology and clinical trial design to ignore this issue. It is hoped that this paper illustrates the need for careful thought about unit of analysis issues whenever reviewing, designing or analysing ophthalmic research. As outlined in this paper, figure 2 provides a brief overview of when ocular unit of analysis issues may arise and illustrates ways that these can be dealt with. The principles of the International Conference of Harmonization Good Clinical Practice are that each individual involved in conducting a trial should be qualified by education, training and experience to perform his or her respective task.15

Ocular unit of analyses issues. Note: The scenarios provided are fictitious. The principles of International Conference on Harmonization Good Clinical Practice are that each individual involved in conducting a trial should be qualified by education, training and experience to perform his or her respective task.15
Acknowledgments
The posts of CB, KP and WX are partly funded by the National Institute for Health Research (NIHR) Biomedical Research Centre (BRC) based at Moorfields Eye Hospital NHS Foundation Trust and UCL Institute of Ophthalmology. The views expressed in this article are those of the authors and not necessarily those of the NHS, the NIHR or the Department of Health.
References
Supplementary materials
Supplementary Data
This web only file has been produced by the BMJ Publishing Group from an electronic file supplied by the author(s) and has not been edited for content.
Files in this Data Supplement:
- Data supplement 1 - Online supplement
Footnotes
-
Collaborators The following additional members of the Ophthalmic Statistics Group were given the opportunity to view the final paper prior to submission and provide suggestions and comments: Jonathan Cook, David Crabb, Phillippa Cumberland, Gabriela Czanner, Paul Donachie, Andrew Elders, Marta Garcia-Fiñana, Rachel Nash, Toby Prevost, Chris Rogers, Luke Saunders, Selvaraj Sivasubramanium, Irene Stratton, Joana Vasconcelos and Haogang Zhu.
-
Contributors CB drafted the paper. CB, KP and WX reviewed and revised the paper. CJD, TP and NF conducted an internal peer review of the paper.
-
Competing interests None.
-
Provenance and peer review Not commissioned; externally peer reviewed.
-
Data sharing statement Not applicable.