Article Text

Abstract
The pathology of glaucoma has been extensively studied at the level of the retina and optic nerve head. Here the first clinicopathological case of human glaucoma is reported demonstrating degenerative changes in the brain involving the intracranial optic nerve, lateral geniculate nucleus, and visual cortex. Pathological evidence of neural degeneration in this patient is correlated with clinical, optic nerve head, visual field, and neuroradiology findings. Neuropathology in the glaucoma brain is compared to age matched controls. In the presence of advanced human glaucoma with 50% visual field loss, neural damage is evident in multiple vision stations within the brain.
- GHT, glaucoma hemifield test
- H&E/LFB, haematoxylin and eosin/luxol fast blue
- IOP, intraocular pressure
- LGN, lateral geniculate nucleus
- MD, mean deviation
- MRI, magnetic resonance imaging
- PSD, pattern standard deviation
- RGC, retinal ganglion cell
- human glaucoma
- pathology
- visual field
- optic nerve
- lateral geniculate nucleus
- visual cortex
Statistics from Altmetric.com
- GHT, glaucoma hemifield test
- H&E/LFB, haematoxylin and eosin/luxol fast blue
- IOP, intraocular pressure
- LGN, lateral geniculate nucleus
- MD, mean deviation
- MRI, magnetic resonance imaging
- PSD, pattern standard deviation
- RGC, retinal ganglion cell
- human glaucoma
- pathology
- visual field
- optic nerve
- lateral geniculate nucleus
- visual cortex
The pathology of glaucoma has been extensively studied at the level of the retina and optic nerve head. Recently, investigations in experimental monkey glaucoma show glaucomatous injury also at the level of the lateral geniculate nucleus (LGN), and visual cortex.1–6 Here we report the first clinicopathological case of human glaucoma, demonstrating degenerative changes in the brain involving the intracranial optic nerves, LGN, and visual cortex.
CASE REPORT
A 79 year old healthy white male presented for a routine eye examination. Ocular history was negative, and he had no medical history of heart disease, diabetes, or smoking. He used lorazepam as needed for sleeping. His family history was negative for glaucoma.
On examination, best corrected visual acuity for mild hyperopia was 20/20 in each eye and pupils were equally reactive to light. Intraocular pressure (IOP) was 16 mm Hg in both eyes. Angles were wide open with no evidence of pseudoexfoliation or pigment dispersion. Mild nuclear sclerosis was evident in each eye. Optic nerve heads showed large cup to disc ratio of 0.9, with deep excavation and loss of the inferotemporal rim in each eye. No disc haemorrhage was noted. Humphrey 24-2 visual fields showed superior field loss in each eye (fig 1). He was diagnosed with primary open angle glaucoma and prescribed dorzolamide twice daily in both eyes. Later, timolol 0.5% in both eyes was added. At his last known eye examination 6 months later, IOP was 8 mm Hg in both eyes on the same medications and glaucomatous optic neuropathy was stable.

Humphrey visual fields show (A) right eye superior visual field defect with the glaucoma hemifield test (GHT) outside normal limits, mean deviation (MD) −7.38 dB and pattern standard deviation (PSD) 10.78 dB; and (B) left eye superior visual field defect with GHT outside normal limits, MD −14.91 dB and PSD 12.01 dB.
One year later, the patient died of acute viral myocarditis, and the optic nerves and the brain were examined at autopsy. Four pairs of optic nerves and three brains of age matched patients without neurological or eye disease, were studied as controls (table 1).
Comparison of case and controls
This study was performed with institutional ethics review board approval. Brain sectioning of the left cerebral hemispheres and coronal slices showed no infarct, intracranial mass, haemorrhage, or diffuse cortical atrophy. Tissue sections were sampled from orbito-frontal, frontal, sensorimotor, temporal, visual, cingulate, superior and inferior parietal cortices, basal ganglia, thalamus with LGN and hippocampus, brainstem including midbrain and medulla, and cerebellum. Haematoxylin and eosin/luxol fast blue (H&E/LFB) stained sections, Bielschowsky silver stained sections, and β amyloid and tau protein immunostained sections showed no evidence of cerebrovascular, Alzheimer’s, or Parkinson’s disease. The optic nerves and the right cerebral hemisphere posterior to chiasm were cryoprotected, frozen, and serially cut with a sliding microtome (SM3400, Leica, Nussloch, Germany) as previously described.1 Every 15th section was Nissl stained with cresyl violet.
RESULTS
Intracranial optic nerve degeneration in human glaucoma
Intracranial optic nerve tissue was obtained 5 mm anterior to the optic chiasm. Cross sections of 40 μm thickness were immunostained for axons with phosphorylated neurofilament, using antibody SMI31 (Sternberger Inc, Lutherville, MD, USA).7 Optic nerve atrophy in glaucoma compared to control optic nerves was pronounced. Marked axonal loss was also evident inferiorly in right and left glaucoma optic nerves (fig 2).

Prechiasmal intracranial right (A) and left (B) glaucoma optic nerves (arrows) are surrounded by four corresponding control optic nerves (immunostained for phosphorylated heavy neurofilament subunit). Bar indicates 1 mm.
Lateral geniculate nucleus degeneration in human glaucoma
The right cerebral hemisphere containing the LGN of the patient with glaucoma and that of a control brain were evaluated with magnetic resonance imaging (MRI). Serial coronal MRI inversion recovery scans showed high signal intensity of the LGN. The largest LGN cross section in the glaucoma patient appeared smaller than the age matched control (table 1, last row) LGN (fig 3).
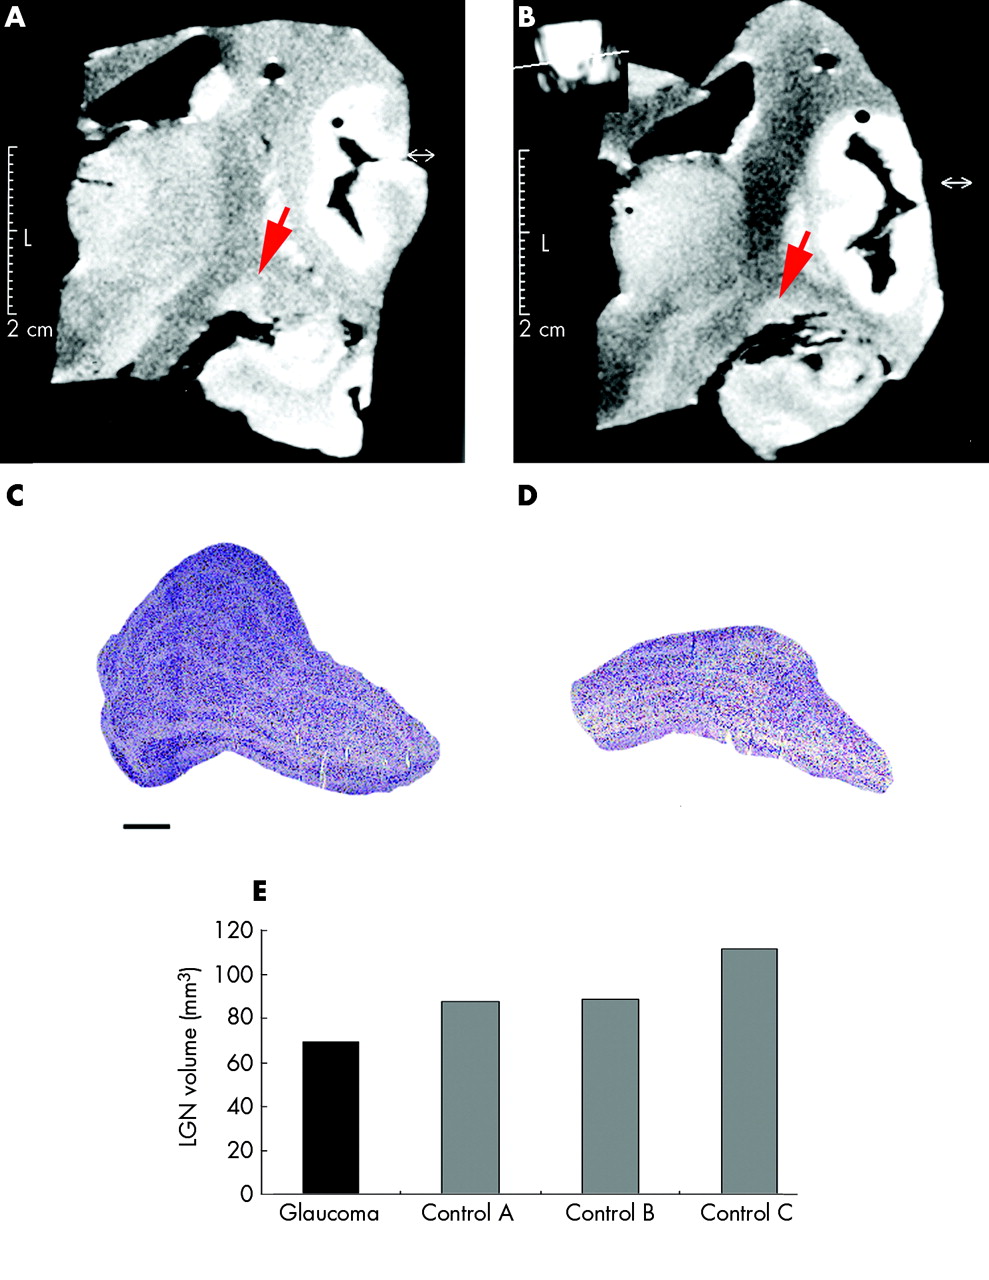
MRI shows high signal intensity of the LGN, and reduced size in glaucoma (B) compared to the control (A). The LGN in glaucoma (D) appears shrunken compared to the control (C) with Nissl stained sections. Bar indicates 1 mm. (E) The LGN volume in glaucoma (black) is reduced compared to controls (grey).
LGN sections stained with Nissl showed six layers from ventral to dorsal, magnocellular layers 1 and 2, and parvocellular layers 3–6. Compared to the control (fig 3C), there was striking overall LGN shrinkage in glaucoma (fig 3D). Right LGN volumes for glaucoma and three age matched controls were calculated using serial frozen sections (50 µm) by point counting (Cavalieri principle and Neurozoom software (Human Brain Project, La Jolla, CA, USA)).1 The LGN volume in glaucoma (69 mm3) was reduced compared to controls (mean 95.9 mm3 (SD 13.5)) (fig 3E).
Magnocellular layers
Light microscopy
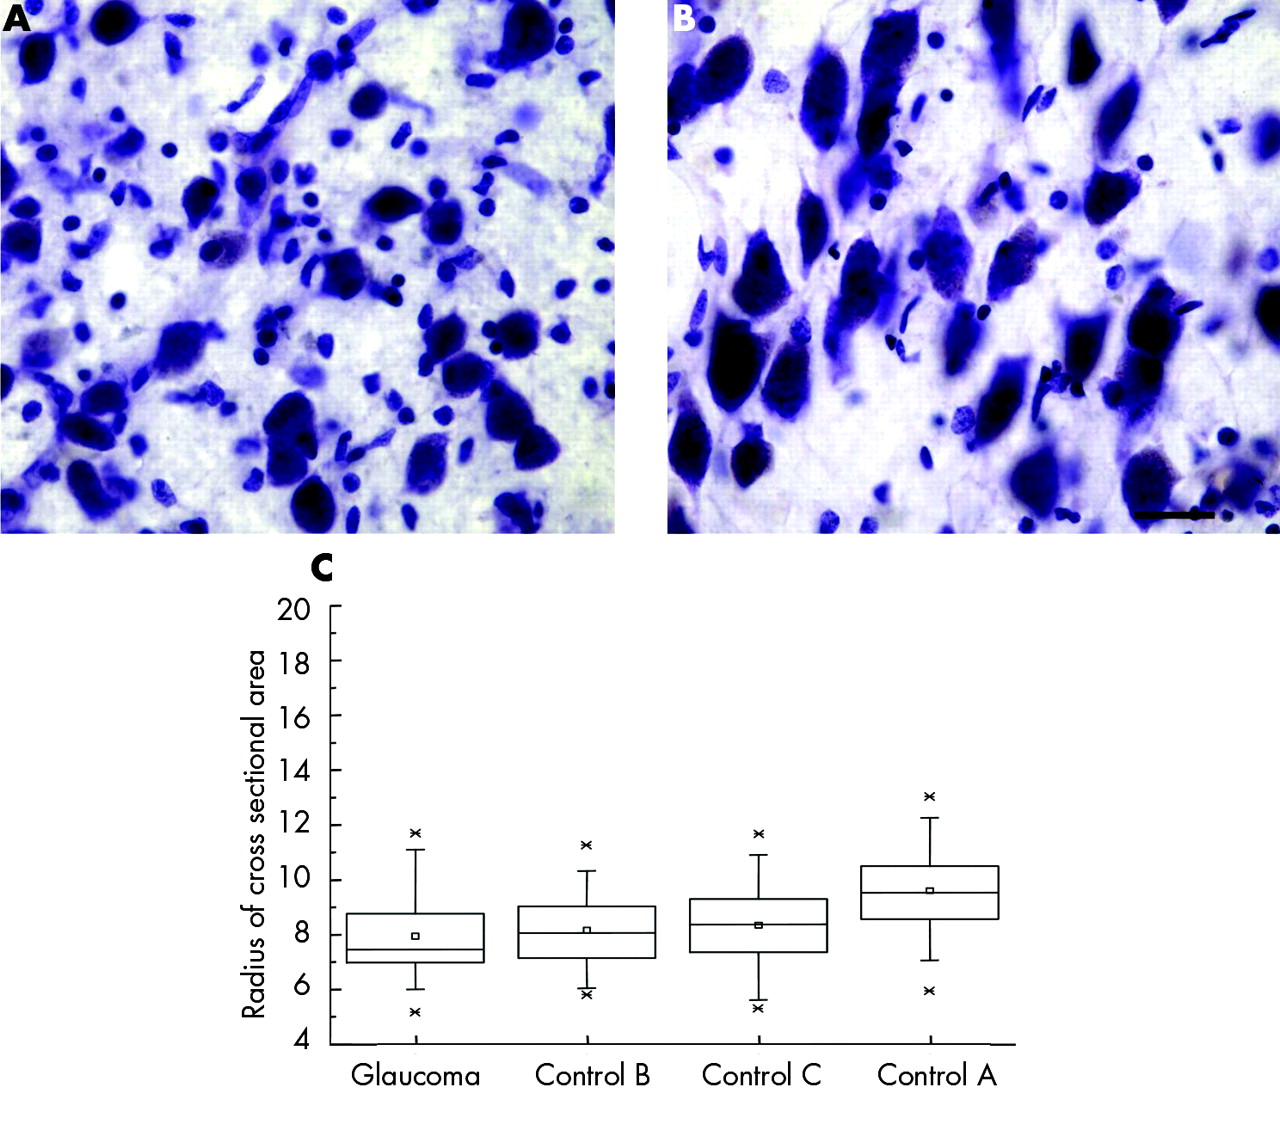
Magnocellular neurons were examined in the posterior-lateral LGN, corresponding to the superior visual field.8,9 High power examination of Nissl stained sections showed neurons with smaller, more globoid cytoplasm and smaller nucleus in glaucoma (fig 4A) compared to stellate neurons seen in the controls (fig 4B). Lipofuscin pigment deposits occupied more of the cytoplasm in glaucoma compared to controls.

Magnocellular LGN neurons appeared smaller in glaucoma (A) than in controls (B). Bar indicates 25 μm. Box plots show neuron radii (µm) (C) in glaucoma and age matched controls. Median, mean, first to third quartiles, 1% and 99%, and minimum and maximum radii are indicated by horizontal lines, small squares, large rectangle, cross signs, and short horizontal lines, respectively (n = 35 for glaucoma index case; and n = 75, n = 74; n = 72 for controls A, B, and C, respectively).
Cross sectional area measurements
Morphometric studies were performed in the right LGN magnocellular layers for the patient with glaucoma and the three age matched controls. Neuron cross sectional area was measured in the right posterior-lateral LGN with unbiased randomised stereological methodology using a nucleator probe (Stereoinvestigator, Microbrightfield Inc, Williston, VT, USA). Contours were drawn around the magnocellular layers in the two most posterior sections at low power (×1.25). Cross sectional area measurements were taken at high power using an oil immersion objective (×60) (table 2).
Cross sectional area measurements (µm2) from glaucoma sample and controls
The radius of the neurons was calculated as the square root of the cross sectional area divided by π. The radius of magnocellular neurons in the index glaucoma case was smaller than each of the age matched controls as seen in box plots in figure 4C. The mean cross sectional area of magnocellular neurons in this index glaucoma case was significantly smaller than each of the age matched controls (p<0.0001; two tailed t test).
Parvocellular layers
Light microscopy
Parvocellular neurons in the posterior-lateral LGN representing the superior visual field were examined.8,9 High power examination of Nissl stained sections showed neurons in glaucoma with smaller, more globoid cytoplasm and smaller nucleus (fig 5A) compared to the elongated neurons seen in controls (fig 5B).
Parvocellular LGN neurons appeared smaller in glaucoma (A) than in controls (B). Bar indicates 25 μm. Box plots show neuron radii (µm) (C) in glaucoma and age matched controls. Median, mean, first to third quartiles, 1% and 99%, and minimum and maximum radii are indicated by horizontal lines, small squares, large rectangle, cross signs, and short horizontal lines, respectively (n = 44 for glaucoma index case; n = 193, n = 76; n = 111 for controls A, B, and C, respectively).
Cross sectional area measurements
Morphometric studies were performed in the right LGN parvocellular layers in the index glaucoma case and three age matched controls. The cross sectional area of neurons in the right posterior-lateral LGN were measured as described above (table 2). The radius of parvocellular neurons in this index glaucoma case was smaller than each of the age matched controls (fig 5C), but this difference was statistically significant with only one of the controls (p<0.0001; two tailed t test).
Visual cortex changes in human glaucoma
In the visual cortex, the superior visual field is represented below the calcarine sulcus. In this area of the brain in glaucoma, cortical ribbon thickness reduction was easily discernible (fig 6A) compared to controls (fig 6B).

The inferior bank of the visual cortex (Nissl stained) showed marked thinning of the cortical ribbon in glaucoma (A) compared to control (B). Arrows indicate upper and lower borders of the cortical ribbon. Bar indicates 250 μm.
DISCUSSION
This clinicopathological case of advanced human glaucoma and visual field loss, demonstrates the presence of central neural degeneration at multiple levels within the visual system. The neural pathology observed within the intracranial optic nerves, posterior-lateral part of the LGN, and the visual cortex below the calcarine sulcus, correlates with clinically apparent inferior rim loss of the optic nerve head and the superior visual field defect. The smaller size of the LGN detected by MRI suggests a possible role for refined neuroradiological assessment of central visual pathways in glaucoma patients. Reduced cell size was observed in LGN neurons in this case of human glaucoma, and has also been observed in experimental primate glaucoma.2,4,6
Neuron loss in the LGN has been shown in the experimental primate model of glaucoma, with neuron numbers derived from three dimensional neuronal density multiplied by LGN layer volume.1,2 In human glaucoma, however, the data on neuron loss in LGN are limited to a single study10 in which LGN volume decrease was not taken into account.1,11 Selective neuron loss in magnocellular layers concluded by the authors was based on two dimensional density measurements,10 and these two dimensional calculations may have overestimated neuron number and underestimated neuron loss in parvocellular layers. Thus, we used three dimensional methodology of the entire LGN in this study to overcome some of these biases.12 Similar studies on a larger number of neuropathological materials are required to accurately assess neuron loss in the LGN in human glaucoma.
A single IOP reading of 16 mm Hg was available in this patient before glaucoma therapy. Thus, while it is possible that this patient had low tension glaucoma, high tension glaucoma cannot be excluded on the basis of this measurement.13 More studies are needed to refine our understanding of central nervous system changes in high and low pressure glaucomas.
On average, there is one retinal ganglion cell (RGC) for every LGN neuron14 with retinotopic representation of the visual field.9,15 As much as 50% RGC loss may occur before detection of visual field loss in human glaucoma.16 In the presence of 50% visual field loss as in this case of human glaucoma, neural degeneration is evident at multiple vision stations in the brain including the visual cortex. A multidisciplinary approach is needed to better understand glaucomatous pathology in the central nervous system at various disease stages.17 Treatment strategies to prevent disease progression in glaucoma should also consider central neural degeneration beyond the retina and optic nerve head.
Acknowledgments
We thank Barbara Thomson, Coordinator, Statistics Consulting, Statistics Department, University of Toronto, and Qiang Zhang for excellent technical assistance. This work was supported by the Glaucoma Research Society of Canada.
REFERENCES
Footnotes
-
↵* Present address: Department of Pathology, University of Western Ontario, London, Canada.
-
Competing interest statement: there are no competing interests to be declared.
Linked Articles
- Editorial
- BJO at a glance