Article Text

Abstract
Background UK estimates of age related macular degeneration (AMD) occurrence vary.
Aims To estimate prevalence, number and incidence of AMD by type in the UK population aged ≥50 years.
Methods Age-specific prevalence rates of AMD obtained from a Bayesian meta-analysis of AMD prevalence were applied to UK 2007–2009 population data. Incidence was estimated from modelled age-specific prevalence.
Results Overall prevalence of late AMD was 2.4% (95% credible interval (CrI) 1.7% to 3.3%), equivalent to 513 000 cases (95% CrI 363 000 to 699 000); estimated to increase to 679 000 cases by 2020. Prevalences were 4.8% aged ≥65 years, 12.2% aged ≥80 years. Geographical atrophy (GA) prevalence rates were 1.3% (95% CrI 0.9% to 1.9%), 2.6% (95% CrI 1.8% to 3.7%) and 6.7% (95% CrI 4.6% to 9.6%); neovascular AMD (NVAMD) 1.2% (95% CrI 0.9% to 1.7%), 2.5% (95% CrI 1.8% to 3.4%) and 6.3% (95% CrI 4.5% to 8.6%), respectively. The estimated number of prevalent cases of late AMD were 60% higher in women versus men (314 000 cases in women, 192 000 men). Annual incidence of late AMD, GA and NVAMD per 1000 women was 4.1 (95% CrI 2.4% to 6.8%), 2.4 (95% CrI 1.5% to 3.9%) and 2.3 (95% CrI 1.4% to 4.0%); in men 2.6 (95% CrI 1.5% to 4.4%), 1.7 (95% CrI 1.0% to 2.8%) and 1.4 (95% CrI 0.8% to 2.4%), respectively. 71 000 new cases of late AMD were estimated per year.
Conclusions These estimates will guide health and social service provision for those with late AMD and enable estimation of the cost of introducing new treatments.
- Prevalence
- incidence
- AMD
- UK
- epidemiology
- clinical trial
This is an open-access article distributed under the terms of the Creative Commons Attribution Non-commercial License, which permits use, distribution, and reproduction in any medium, provided the original work is properly cited, the use is non commercial and is otherwise in compliance with the license. See: http://creativecommons.org/licenses/by-nc/2.0/ and http://creativecommons.org/licenses/by-nc/2.0/legalcode.
Statistics from Altmetric.com
Introduction
Age related macular degeneration (AMD) is a major cause of ocular morbidity in high income countries, accounting for over half of blind and partial sight certifications in the UK.1 However, the number registered underestimates the number with visual loss caused by the condition, as it excludes those who choose not to be registered. Moreover, this figure does not include the appreciable number of those with the condition who do not qualify for registration. There have been a number of attempts to quantify the number with AMD in the UK,2 3 but these estimates differ, and are heavily dependent on the characteristics of studies used to generate the figures; in particular, age of the study sample, case definition of AMD, and whether fundus imaging and independent grading have been used. We have previously quantified the magnitude of effect these characteristics have on the prevalence of AMD.4
While a treatment for geographical atrophy (GA) remains to be established, treatments for neovascular AMD (NVAMD) using photodynamic therapy and antivascular endothelial growth factors exist; the latter is being increasingly used to limit progression of the condition.5 In order to plan adequate healthcare provision, estimates of incidence are required, but these differ between studies.6–9 Estimates suggest that the number eligible for treatment has increased fivefold over a relatively short period.10–12 These estimates are based on certification data10 or from a small number of population cohorts, which have followed up individuals from 5 to 15 years.8 13 14 Extrapolating from these studies to the population at large is highly sensitive to the age distribution of the study population and duration of follow-up. A more robust approach is to use age-specific prevalence rates of late AMD. Data modelled from many studies allow a wider range of ages to be represented compared with the limits of a single incidence study. Robust estimates of prevalence at older ages are of particular importance as this is where late AMD is most prevalent. We have therefore applied age-specific prevalence rates from our recent review (modelled using Bayesian meta-analysis over a wide range of ages)4 to UK population data to provide estimates of the number of prevalent cases and incidence of late AMD, GA and NVAMD.
Materials and methods
Age-specific prevalence data
We estimated the age-specific prevalence of late AMD, GA and NVAMD (for men, women and genders combined) using a Bayesian meta-analysis of 31 populations studies with a combined population of 57 173 (with 1571, 455 and 464 cases of late AMD, GA and NVAMD cases, respectively).4 These prevalence estimates represent the most complete meta-analysis of AMD prevalence in white populations (from Europe, North America and Australia) largely similar to the middle-aged and older population of the UK. Prevalence estimates allowed for study characteristics, such as age of the sample, examination methods and definitions of disease (internationally recognised definitions being preferred).15 16 Prevalence estimates from the Bayesian model were produced by year from 50 to 97 years of age (the oldest reported age in the studies included in the meta-analysis) for men, women and genders combined (Web table 1) based on ‘either eye’ case definitions (including at least one eye, worst eye, one or both eyes) using the International Classification System or Wisconsin Age-Related Maculopathy Grading System and fundus photography.15 16 A 95% credible interval (CrI) of prevalence by year was also obtained from the Bayesian model: a 95% CrI represents the range of values within which the true prevalence is expected to lie with 95% probability.
UK population characteristics
Demographic characteristics for the population of the UK were obtained from the Office of National Statistics. The mean yearly population from 50 to 97 years of age was obtained from estimates for the years 2007–2009.17–19 Prevalence estimates for each year of age from the Bayesian model were applied to these population figures. The Office of National Statistics also provides estimates of the probability of dying at each year of age,20 as well as projections of UK population numbers over time.21 Population projections up to 2020 were used as data beyond this may be less reliable.
Estimating incidence from prevalence
Estimating incidence from age-specific prevalence data has been carried out previously for open angle glaucoma.22 We used this method to estimate the annual incidence by age of late AMD, GA and NVAMD in men and women between the ages of 50 and 97 years. Prevalence estimates for each year of age were used to determine the probability of AMD per year of age. The probability is then converted into an incidence assuming that: (i) the outcome of interest is life-long after diagnosis; (ii) mortality risk is the same in those with and without the disease; and (iii) the disease is stable in the population (with risk factors for the condition remaining constant).
Results
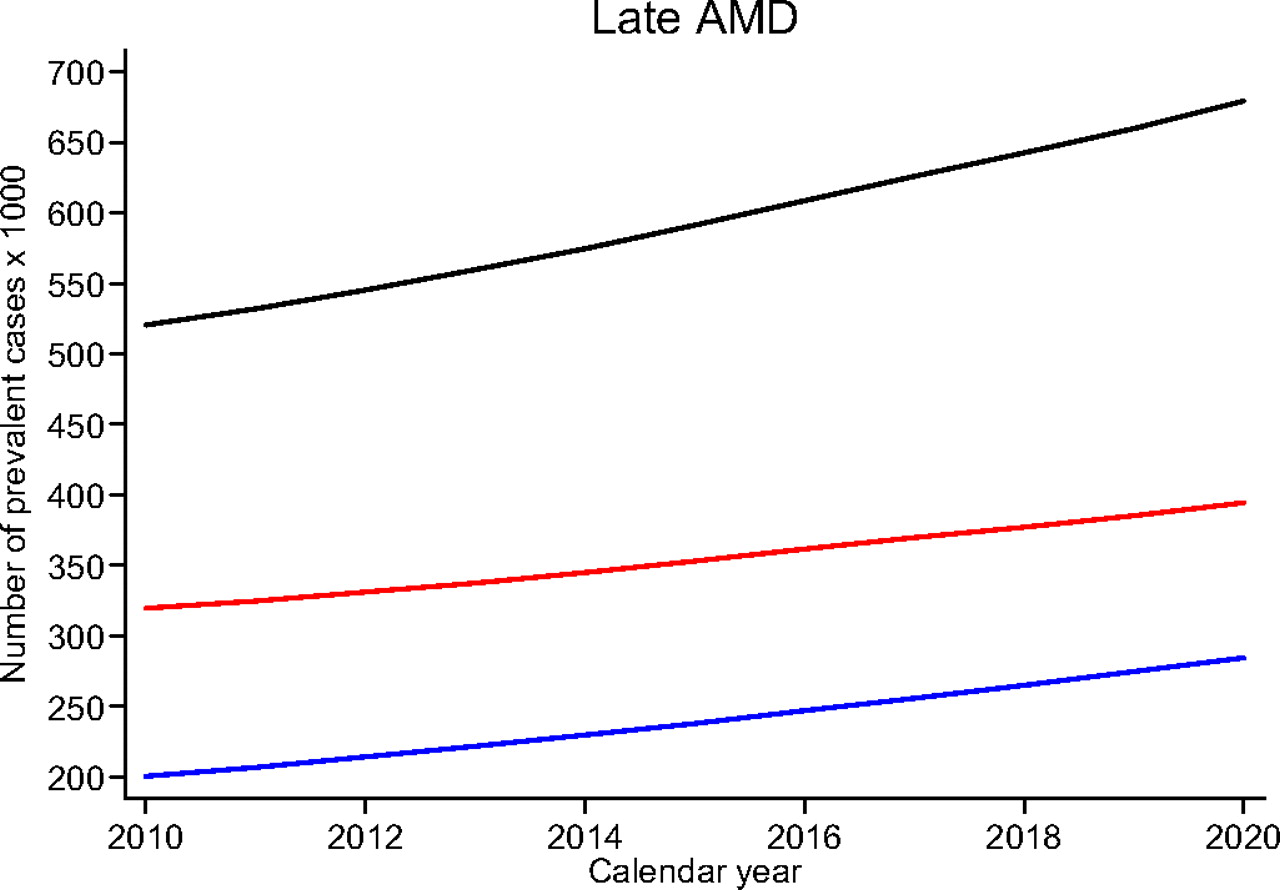
The prevalence of late AMD standardised to the UK population aged 50 years or more was 2.4% (95% CrI 1.7% to 3.3%), increasing to 4.8% (95% CrI 3.4% to 6.6%) in those aged 65 years or more and 12.2% (95% CrI 8.8% to 16.3%) in those aged 80 years or more. Prevalences for GA were 1.3% (95% CrI 0.9% to 1.9%), 2.6% (95% CrI 1.8% to 3.7%) and 6.7% (95% CrI 4.6% to 9.6%) and for NVAMD 1.2% (95% CrI 0.9% to 1.7%), 2.5% (95% CrI 1.8% to 3.4%) and 6.3% (95% CrI 4.5% to 8.6%), respectively. These estimates applied to the UK population result in approximately 513 000 prevalent cases of late AMD (95% Cr I 363 000 to 699 000), 276 000 cases of GA (95% CrI 188 000 to 396 000) and 263 000 cases of NVAMD (95% CrI 185 000 to 361 000). UK age-specific prevalence rates of late AMD, GA and NVAMD are shown for different age groups in Web table 1 for men and women separately; the number of cases is shown graphically in figure 1. The Bayesian model showed little gender difference in GA prevalence, but slightly higher prevalence in women for late AMD, which was explained by the higher prevalence of NVAMD in women.4 Application of these prevalence rates to the UK population, in combination with larger numbers of older women at older ages, results in marked gender differences in the number of prevalent cases, especially between 80 and 90 years of age (figure 1). Overall, the estimated number of prevalent cases of late AMD was 60% higher in women compared with men, with 314 000 cases in women and 192 000 in men. Beyond 90 years of age, there is a sharp decline in the number of AMD cases in both genders (figure 1). Application of these prevalence rates to population projections suggests a linear increase in the number of AMD cases by 2020. There are estimated to be 394 000 women and 285 000 men (679 000 in all) with late AMD by 2020 (figure 2), which is an increase of a third. Data for GA and NVAMD show similar increases (data available from the authors).

Number of prevalent cases (in thousands) of late age related macular degeneration (AMD), geographical atrophy (GA) and neovascular AMD (NVAMD) in men (open blue squares) and women (open red) by 1-year age groups. The dashed blue and red lines are the 95% credible intervals for men and women, respectively.

Projected number of prevalent cases (in thousands) of late age related macular degeneration (AMD) in men (blue line) and women (red line) and combined (black line) from 2010 to 2020.
The overall number of incident cases in those aged over 50 years for late AMD, GA and NVAMD in women was 4.1 (95% CrI 2.4 to 6.8), 2.4 (95% CrI 1.5 to 3.9) and 2.3 (95% CrI 1.4 to 4.0) in the UK per 1000 per year; in men it is 2.6 (95% CrI 1.5 to 4.4), 1.7 (95% CrI 1.0 to 2.8) and 1.4 (95% CrI 0.8 to 2.4), respectively. Incidence by age (figure 3, Web table 2) shows higher rates of NVAMD in women, and slightly higher rates in women for late AMD. Application of these incidence rates to the UK population results in higher numbers of new late AMD, GA and NVAMD cases per year in women compared with men, being most marked between 80 and 90 years of age, with a sharp decline thereafter. The total number of new cases of late AMD, GA and NVAMD per year in men and women was 25 344 (95% CrI 14 500 to 43 900), 16 700 (95% CrI 10 200 to 27 200) and 13 400 (95% CrI 7900 to 23 200) and 45 900 (95% CrI 26 600 to 77 000), 27 000 (95% CrI 16 800 to 44 000) and 26 400 (95% CrI 15 800 to 45 100), respectively.

Graphs on the left had side represent the annual incidence (number per 1000) of late age related macular degeneration (AMD), geographical atrophy (GA) and neovascular AMD (NVAMD) in men (open blue squares) and women (open red circles). The dashed blue and red lines are the 95% credible intervals for men and women, respectively. Graphs on the right hand side represent number of new cases per year in men (blue line) and women (red line) as applied to the UK population.
Discussion
We have applied findings from a recent systematic review 4 based on 31 populations of European ancestry with a wide age range (50–97 years) (including 18 populations from Western Europe with four from the UK23–26) to the population of the UK to model the number of prevalent cases of late AMD, GA and NVAMD. We estimate that there are currently 513 000 (95% Cr I 363 000 to 699 000) prevalent cases of late AMD, 276 000 cases of GA (95% CrI 188 000 to 396 000) and 263 000 cases of NVAMD (95% CrI 185 000 to 361 000). With knowledge of the probability of death by age, and assuming similar mortality in those with and without AMD, the annual number of incident cases is 71 200 (95% CrI 41 100 to 120 900), 43 700 (95% CrI 27 000 to 71 200) and 39 700 (95% CrI 23 700 to 68 300), respectively. While women have slightly higher age-specific prevalence rates of late and NVAMD, it is the much greater number of older women in the UK that results in the gender difference in the number of prevalent and incident cases (figures 1 and 3). This explains the perceived view of an abundance of older women presenting to medical retina clinics with AMD.
How do these numbers compare with previous estimates? Numbers from this study are similar to, but more precise than, our earlier estimates of prevalent cases of 191 000 (95% CI 171 000 to 310 000) with GA and 271 000 (95% CI 179 000 to 405 000) with NVAMD, which combine to give 462 000 with late AMD within the present study's CrIs. Our CrIs also include recent point estimates3 derived by applying findings from another review27 to the UK population (although our NVAMD estimates are lower). There have also been a number of attempts to estimate incidence of NVAMD in the UK in order to plan treatment demand and costs.28 We are not aware of any UK estimates for GA incidence, probably because this is less of a priority given lack of effective treatment (although the need for low vision services remains). Initial estimates of NVAMD requiring photodynamic therapy in England and Wales suggested 5000 patients per year, estimated from either blind and partial sight registrations10 or from two non-UK prospective cohort studies.11 29 30 With the introduction of newer therapies for NVAMD,5 potentially suitable for classic and occult types of choroidal neovascularisation, estimates of the number eligible for treatment have increased from 7000 to 26 000 patients per year.28 The source of these estimates is unclear,28 but Novartis Pharmaceuticals UK also suggested 26 000 new cases of wet AMD in the UK per year, reported as being calculated from our earlier review of prevalence.2 31 This figure is commensurate with estimates that there are 13 000 to 37 000 incident cases of NVAMD in England and Wales per year,28 based on two prospective cohort studies in the Netherlands32 and Australia.8 Our prediction of incidence is higher, but our CrIs are wide and include many of the previously reported estimates (including the popular figure of 26 000 annual cases of NVAMD). Our overall and age-specific annual incidence rates (Web table 2) also appear to be higher than those calculated33 from ‘first eye’ cumulative AMD incidence in other studies.6–9 The exponential rise in prevalence and incidence rates with age (with prevalence rates of late AMD quadrupling per decade)4 makes direct comparisons with estimates from individual studies difficult because they are heavily dependent on the age distribution of the sample at baseline and period of follow-up. Representation of data from older people (especially those aged 80 years or more) is needed to avoid underestimation of population numbers with late stage AMD (while recognising that the number with or developing AMD in a population will ultimately fall with age due to increased mortality). Unfortunately, any single prospective study has limited information on incidence at older ages when AMD is particularly prevalent. Although there are some studies with long durations of follow-up (up to 15 years),8 13 14 results are generally reported as 5- or 10-year incidence rates making it difficult to determine the annual incidence without knowledge of the change in pattern of incidence with time/age. Therefore, estimating incidence from prevalence, particularly at older ages, is an efficient approach and likely to be more accurate in the absence of large studies with follow-up at all ages (particularly at older ages where follow-up is more problematic).
Our numbers are calculated from either eye prevalence rates.4 While this might overestimate any potential visual loss associated with the condition (especially when both eyes are used), this is appropriate when estimating potential therapeutic costs as bilateral disease is less common, and presence of any disease may warrant treatment. Using ‘either eye’ case definitions will result in some individuals being counted in GA and NVAMD groups, but this number is likely to be small. While this may partly explain why the estimated number with GA and NVAMD combined is higher than those estimated with late AMD, a more plausible explanation is that the estimates of prevalence of late AMD are more precise as they are estimated from a meta-analysis of a larger number of studies (31 studies) compared with those for GA and NVAMD (23 studies). Similar to earlier work estimating incidence of glaucoma from age-specific prevalence,22 our calculations assume that: (i) AMD is life-long after diagnosis, (ii) overall mortality risks are the same in those with and without AMD and (iii) AMD is stable in the population (with risk factors for the condition remaining the same). The first assumption is correct, there is no consistent evidence to argue against the second34–36 and we have found no strong evidence in our meta-analysis that late AMD prevalence has changed over time,4 although a recent study suggested that the prevalence of AMD (including early and late forms) may have fallen,37 attributed to improved diets and reductions in smoking prevalence.38 The estimation of incidence for older age groups is the most plausible explanation for our higher numbers, with the peak in number of prevalent and incident cases being just below 90 years of age. The noticeable kink in the decline beyond 90 years of age reflects the sharp decline in births during World War I (1914–1918), followed by the rapid postwar baby boom (approximately 1920).39 While our estimates of NVAMD incidence are high, this may not reflect the number in need of treatment. The type of NVAMD on presentation cannot be estimated from these data, that is, classic or occult, although limited evidence from other sources suggests a ratio of 2:1.11 Moreover, older patients may be too frail to benefit/undergo treatment.
In the absence of any large, geographically representative population study of AMD in the UK, this review provides the best estimates of the number of prevalent and incident cases of late AMD, GA and NVAMD in the largely white older population of the UK. While most of the current older UK population are white (96% white population in England and Wales aged ≥65 years),40 this is likely to diminish in the future. However, evidence suggests similar or lower rates of AMD in populations of non-European ancestry.27 41 Our estimates are based on pooled findings from studies carried out in white populations from North America, Australia and Europe with shared ancestry (including recent23 and historical studies in the UK24–26). All studies contributed to the prevalence estimates used to calculate incidence. We adjusted for differences between studies in methodology which may have biased rate estimates24–26 (such as no fundus imaging and study-specific as opposed to internationally recognised disease definitions).15 16 Projections over the next decade suggest that the number of prevalent cases of late AMD will increase steadily by a third by 2020 due to population ageing. These evidence based estimates can be used to help plan social and healthcare provision for the present and the future.
References
Supplementary materials
Supplementary Data
This web only file has been produced by the BMJ Publishing Group from an electronic file supplied by the author(s) and has not been edited for content.
Files in this Data Supplement:
- Download Supplementary Data (PDF) - Manuscript file of format pdf
- Download Supplementary Data (PDF) - Manuscript file of format pdf
- Download Supplementary Data (PDF) - Manuscript file of format pdf
HTML Page - index.htslp
Files in this Data Supplement:
Footnotes
Funding The work was supported by a grant from the Macular Diseases Society and commissioned on behalf of the Macular Interest Group of Vision 2020, UK.
Competing interests None.
Provenance and peer review Not commissioned; externally peer reviewed.