Article Text

Abstract
Aims To study the variability of central retinal thickness (CRT), its concordance to the fellow eye, and the implications for designing future clinical trials using spectral-domain optical coherence tomography (SD-OCT).
Methods Cross-sectional retrospective analysis of European Genetic Database. 632 eyes of 316 subjects over 60 years of age without macular pathology were examined using SD-OCT.
Results Mean CRT was 280.22 µm and 281.02 µm for the right and left eyes, respectively. There was a strong concordance for all measured values between right and left eyes. Men had significantly thicker CRT than women. Variation up to 23 µm difference between both eyes was seen. To detect a change of at least 30 µm in CRT, a sample size of 90 or 176 per group is needed for a single-arm or double-arm study, respectively (α=0.05, power=0.80, no loss to follow up, assuming SD in future studies=100 µm).
Conclusions Clinical trials using CRT as an endpoint are feasible in terms of sample size needed.
- Imaging
- Macula
- Retina
This is an open-access article distributed under the terms of the Creative Commons Attribution Non-commercial License, which permits use, distribution, and reproduction in any medium, provided the original work is properly cited, the use is non commercial and is otherwise in compliance with the license. See: http://creativecommons.org/licenses/by-nc/3.0/ and http://creativecommons.org/licenses/by-nc/3.0/legalcode
Statistics from Altmetric.com
Introduction
Measurements of retinal thickness using spectral-domain optical coherence tomography (SD-OCT) are gaining more importance in clinical trials. While visual acuity is usually chosen as the primary endpoint, optical coherence tomography measurements are added as a morphological marker. The development of SD-OCT equipped with an eye-tracking system has increased the reliability of retinal thickness measurements.1 ,2 However, little is known about the variability of retinal thickness in normal individuals. Reliable values would help to estimate sample size more precisely. The use of the fellow eye for comparison also requires exact data on the concordance of both eyes in SD-OCT.
In certain clinical trials, using SD-OCT to assess retinal thickness helps to evaluate the effectiveness of a drug or the severity of the disease progression more precisely. SD-OCT serves as an objective morphological parameter. Most trials on age-related macular degeneration (AMD) and diabetic retinopathy include SD-OCT measurements.
Several studies on macular thickness using SD-OCT have shown that SD-OCT parameters are influenced by age, gender and axial length.3 ,4 Therefore, it is logical to study whether fellow eyes of the same individuals can be used as controls as well. To understand the role of fellow eyes, we determined the central retinal thickness (CRT) in SD-OCT in both eyes of eye-healthy persons aged 60 years and older in a large cohort. This age group is of particular interest in many age-related ophthalmological clinical trials, which utilise SD-OCT measurements.
Patients and methods
Subjects were recruited in Cologne, Germany, between June 2009 and June 2011. They were participants in the European Genetic Database which is a German/Dutch project studying the development and therapy of AMD. The study followed the tenets of the Declaration of Helsinki, and was reviewed and approved by the local institutional review board. All participants provided written informed consents.
Main inclusion criterion for the analysis was a best-corrected visual acuity (BCVA) better than 20/25 in both eyes. Exclusion criteria included signs of other ocular disease compromising retinal thickness, such as early or late AMD, macular pucker, macular hole, vitreomacular traction, glaucoma, diabetic macular oedema and so on. All subjects underwent full ophthalmic examinations including BCVA measurement, slit lamp examination, binocular indirect ophthalmoscopy, fundus photography, and SD-OCT. Subjects with insufficient quality of SD-OCT images were excluded from the analysis.
SD-OCT was done using Spectralis HRA+OCT (Heidelberg Engineering, Heidelberg, Germany). It included the acquisition of near-infrared fundus reflectance (λ=830 nm). The high-resolution SD-OCT had an acquisition speed of 40 000 A-scans. The eye tracker allowed point-to-point correlation of near-infrared fundus reflectance and SD-OCT. For each eye, two OCT scan patterns were performed: (1) a block containing 37 B-scans (20°×15°, distance between B-scans: 125 µm) and (2) a star of six B-scans (angle between scans was 30°).
Analysis of retinal thickness
SD-OCT was carried out using Heidelberg Eye Explorer software (V.1.7.0.0., Heidelberg Engineering, Heidelberg, Germany). Retinal thickness was defined by the automated segmentation as the distance between the first signal from the vitreoretinal interface and the signal from the posterior boundary of the outermost high-reflective band that presumably correlates with Bruch's membrane. Using this retinal thickness, a thickness map was produced. A clinically significant macular oedema (CSME) grid was used, as described in Campbell et al.5 This grid contained three rings, each having a radius of 0.5 mm, 1.11 mm and 1.73 mm, respectively, from the centre of the fovea. Using this grid, the macula was divided into nine sectors (figure 1). The CSME grid was manually centred to the centre of the fovea, and segmentation failure was manually corrected.
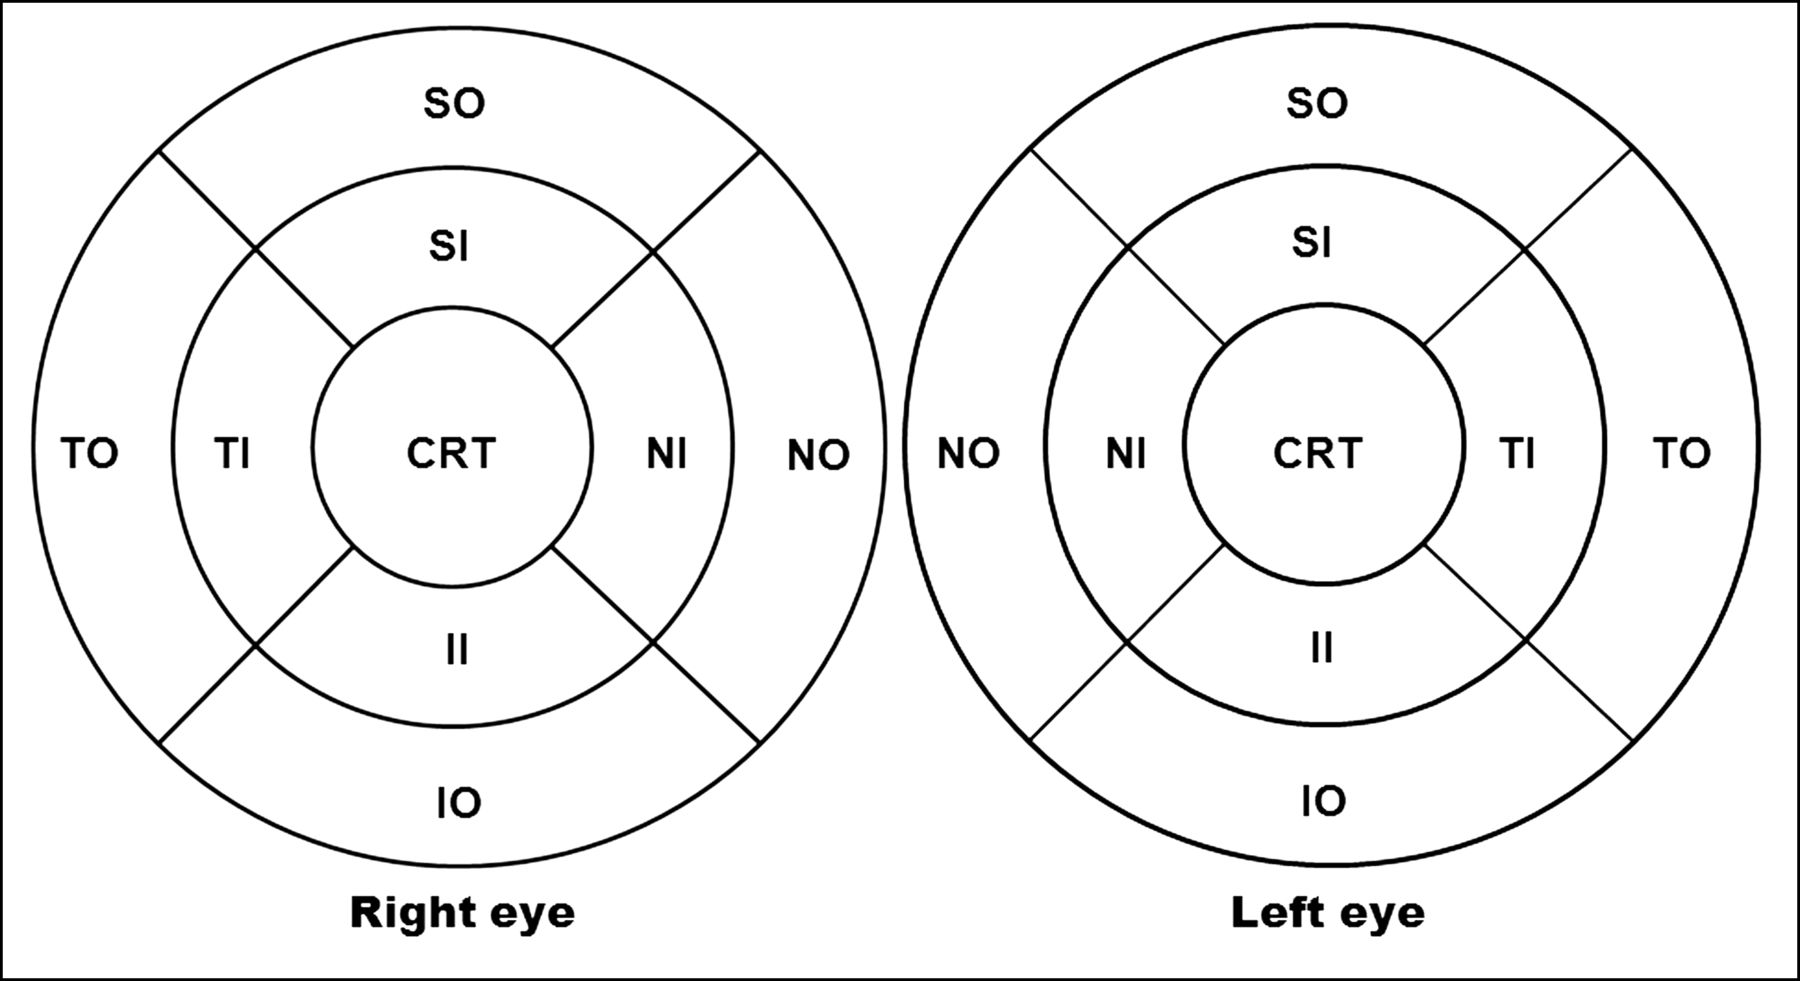
Clinically significant macular oedema grid for both eyes used in this study. The central circle has the radius of 0.5 mm, the middle circle 1.11 mm, and the outermost circle 1.73 mm. CRT, central retinal thickness; SI, superior inner; NI, nasal inner; II, inferior inner; TI, temporal inner; SO, superior outer; NO, nasal outer; IO, inferior outer; TO, temporal outer.
Statistical analysis and sample size calculation
Statistical analyses were carried out using PASW Statistics 18 (Predictive Analytics Software, V.18.0.0). Demographic characteristics of the population are described with summary statistics, including frequency and percentage for categorical data. Continuous data are presented with mean±SD. Student t test for dependent variables is used when comparing the right and left eyes. The concordance of macular measurements between the right and left eyes was also evaluated using the concordance correlation coefficient (rc).6 The CRT concordance of the same individual was additionally analysed using Bland-Altman plot.7 Both rc and Bland-Altman plot were calculated using MedCalc Software (Mariakerke, Belgium).
Comparison between eyes of different subjects was done using a Student t test for independent variables. p Value <0.05 was deemed as statistically significant. All correlations between two values are presented as Pearson product-moment correlation coefficient (r). The partial correlation coefficient between macular measurements and age, spherical refraction and BCVA was calculated using averaged macular measurements of the right and left eyes.
Sample size calculations were done using the G*Power 3 software (available at www.psycho.uni-duesseldorf.de/abteilungen/aap/gpower3/download-and-register). The software is described and developed by Faul et al.8 ,9 Sample size calculations for all hypothetical studies are carried out using the assumption α=0.05, power=0.8 and no loss to follow up.10
Results
We enrolled 632 eyes of 316 subjects for this analysis. The main demographic characteristics of these subjects are shown in table 1. Among them were 133 men and 183 women. No significant difference was found in the baseline characteristics of the spherical refraction and visual acuity in logarithm of the minimum angle of resolution (LogMAR) between both eyes (t test for dependent variables, 2-sided; p=0.99 and p=0.09, respectively).
Demographic characteristics
Age correlated negatively with all macular measurements, except CRT, after adjusted for gender, spherical refraction and BCVA (table 2). These correlations are, however, relatively weak. Spherical refraction and BCVA had no significant influence on macular thickness measurements. CRT was the most robust parameter; it was not influenced by age and spherical refraction in this study. In men, CRT was thicker compared with women (p=0.001) (table 3). In macular volume, however, these gender differences were not statistically significant (p=0.299).
Partial correlation between macular measurements and age, spherical refraction and best corrected visual acuity (BCVA)
Retinal thickness measurements
Concordance between eyes
The retinal morphometrics in all nine subfields in CSME grid are shown in table 3. Overall, there was a high concordance of all measured values between the right and left eyes, but there was a significant difference in the CRT, the superior inner, and the superior outer macular thickness between both eyes (p value=0.01, 0.03, and <0.001, respectively). In myopic eyes (spherical refraction more than −1 diopter), the difference of CRT between right eyes and left eyes was −1.64±4.30 µm (p=0.02). In hyperopic eyes (spherical refraction more than +1 diopter), the difference of both CRTs was 0.79±5.57 µm and was not statistically significant (p=0.08). The CRT difference between the right and left eyes was not correlated with difference in spherical refraction (r=0.015, p=0.801).
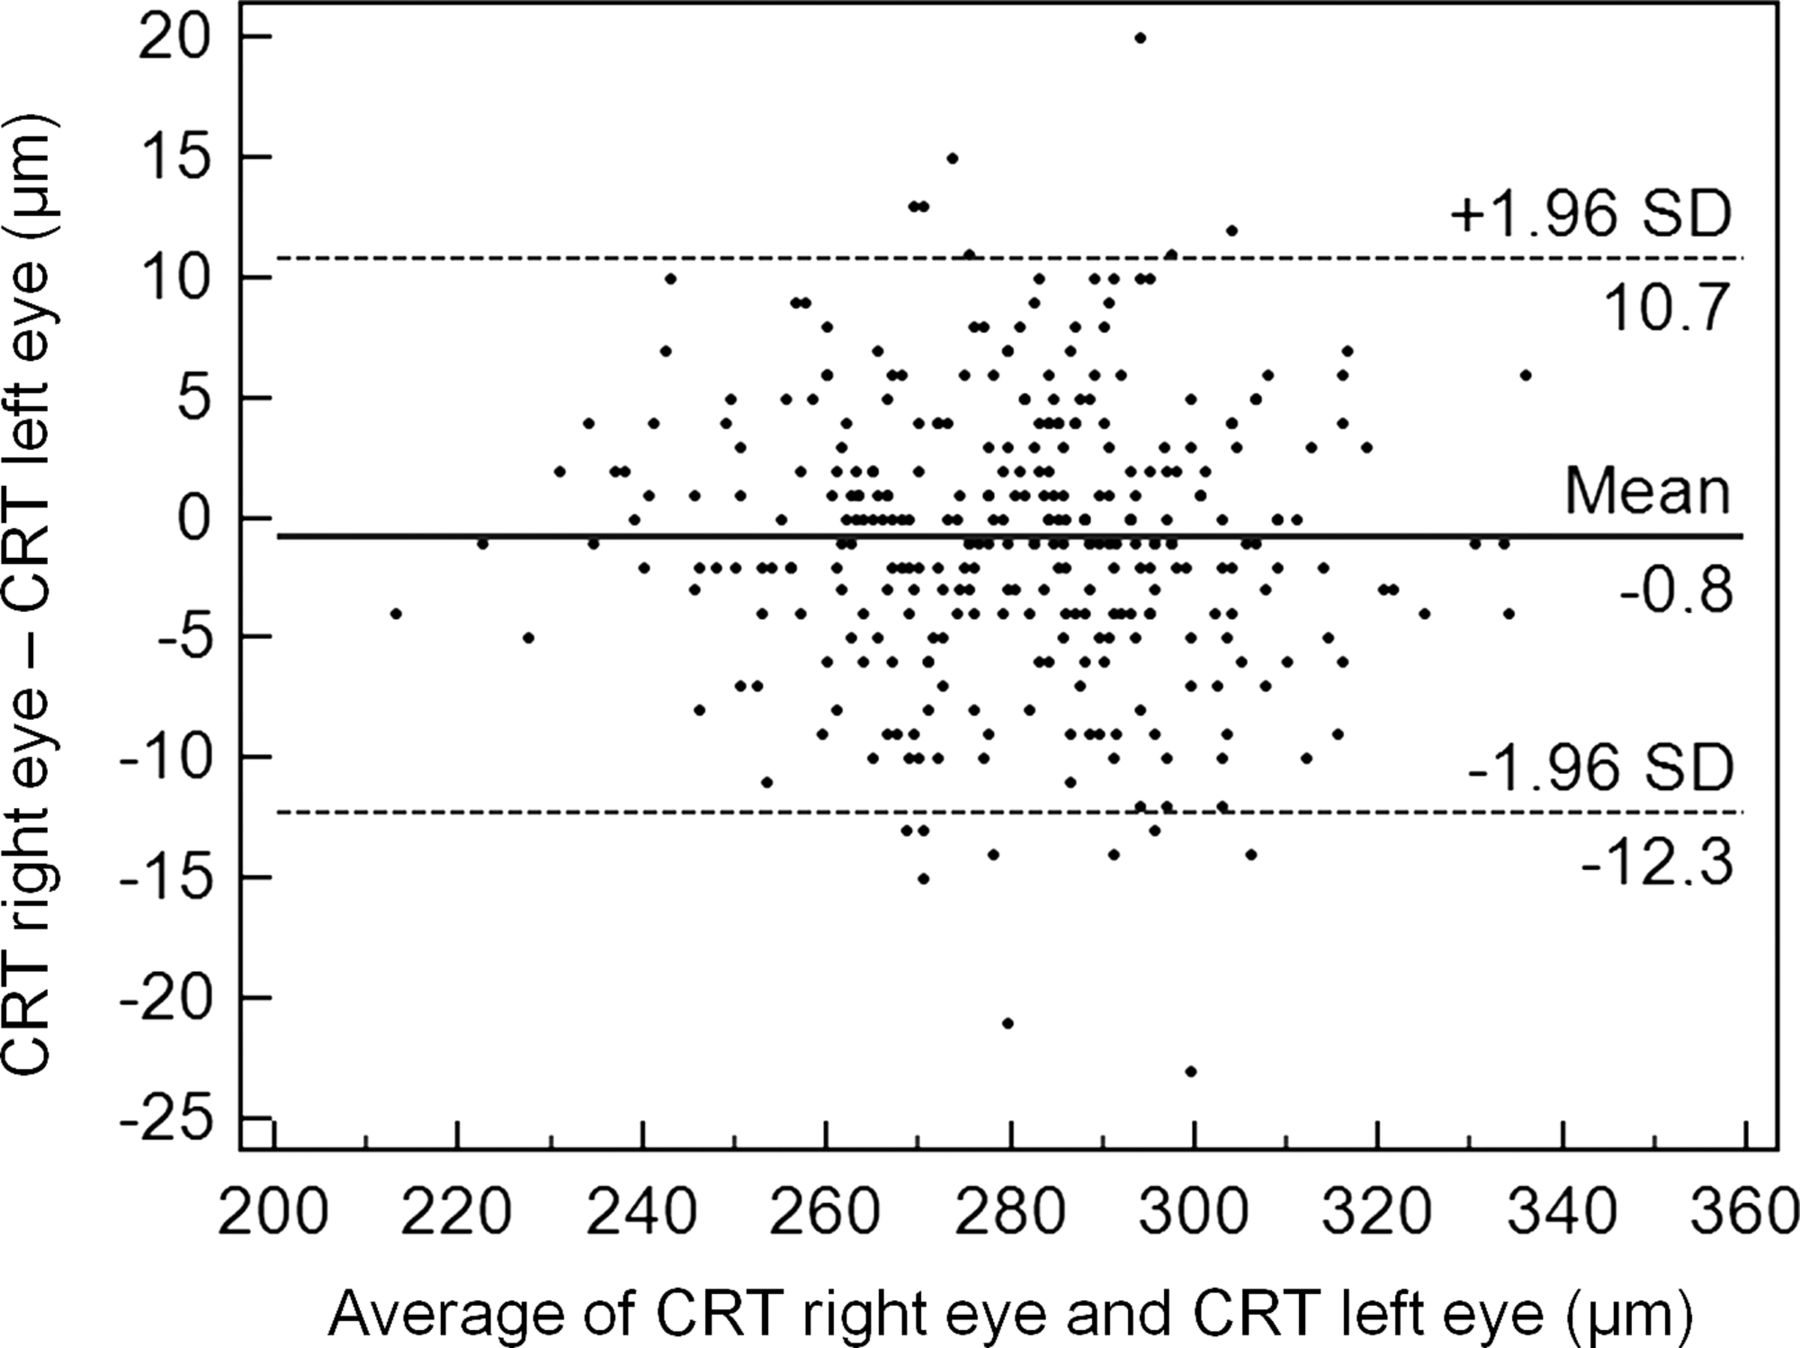
The Bland-Altman plot of CRT between the right and left eyes is depicted in figure 2. The mean difference between the right and left eyes was −0.8 µm (95% CI from −1.45 to −0.14 µm), that is, there is no obvious systematic bias in the CRT differences. The CRT differences are also not dependent on the CRT values.
Bland-Altman plot of central retinal thickness between the right and left eyes.
Analysis of outliers in retinal thickness difference
The concordance of the CRT between both eyes was perfect in 29 of 316 subjects. In 201 subjects, the difference in CRT was between 1 µm and 9 µm, and in 36 subjects the CRT difference was between 10 µm and 23 µm. The mean absolute CRT difference for all subjects was 0.79±5.88 µm (range 0–23). In patients with a difference of CRT of >=15 µm, this difference could not be attributed to spherical refraction, lens status or vitreous adherence.
Sample size calculation
For designing future clinical trials using retinal thickness measurements in SD-OCT as one possible primary endpoint, one must define the sample size needed. In this study, we found retinal thickness differences of up to 23 µm in normal individuals between both eyes. Therefore, a 30 µm threshold was chosen for the detection of macular oedema. Assuming a hypothetical study to detect at least a 30 µm difference using the fellow eye as a control without a prior SD-OCT measurement, a sample size calculation was done for either single-arm or double-arm studies (table 4). In a double-arm study, the 30 µm interindividual CRT differences were chosen, because this value lies outside the 95% CI (278.393 to 282.844 µm) and outside the 99% CI (277.687 to 283.550 µm) for the averaged CRT of the right and left eye (mean 280.619±SD 20.108 µm).
Sample size calculations
The sample size calculation for a single-arm study was based on the aforementioned finding that CRT variation between the right and left eye might exist up to 23 µm. Therefore, a 30 µm CRT difference to detect between both eyes is selected. Unlike in the aforementioned calculations for a double-arm study, this threshold for a single-arm study is based on assumption according to cases suggesting that differences less than 30 µm might not be clinically relevant.11
Although CRT SD of 20 µm is found in our study, the actual SD in a future study taken collectively might vary considerably, that is, it depends on the art of surgery or treatment being studied. Therefore, sample sizes for various SDs are presented.
Discussion
Some authors have examined the characteristics of retinal thickness using SD-OCT. A study by Song et al3 using Cirrus HD-OCT described that retinal thickness of one randomly selected eye of 198 individuals decreases with age. This concurs with our findings, in that we also found a weak negative correlation between macular thickness measurements and age even after adjustments for sex, spherical refraction and BCVA (table 2). This might be due to a decrease in the density of ganglion cells, photoreceptors and retinal pigment epithelium cells brought on with age, which was shown in histology.17 ,18 The decrease in the macular thickness with age was found for all subfields except for the central fovea (CRT), where we found no change with age. This was in line with the findings within the study by Song et al,3 in which the central subfield thickness was not correlated with age. Correspondingly, histopathological studies found a stable cone density in the fovea, when compared with rods.19 ,20
Men had a significantly thicker CRT compared with women, which is in line with other studies3 ,4 ,21 ,22 Only Sabates et al23 found no differences in mean macular thickness with regard to gender, but they examined the mean retinal thickness as opposed to CRT in our study. In contrast to CRT, we found no statistical differences in macular volume between men and women. These gender differences have to be taken into consideration in analysing future clinical trials if two different study arms with imbalance in gender proportions are compared.
Although CRT was not influenced by age and refractive error (table 2), we found intraindividual differences between both eyes in myopia. Although these differences were relatively small (mean −1.64±4.30 µm), this has to be kept in mind when CRT of myopic eyes of the same individuals are compared.
Overall, there was a strong concordance of CRT between both eyes. In clinical trials involving interventions of only one eye, it is possible to use CRT of the fellow eye as a control. The sample size needed to rule out a statistically significant difference is relatively small, that is, 90 patients or 352 patients for a single-arm or double-arm studies, respectively (table 4). The CRT difference between both eyes in this study does not correlate with difference in spherical refractive error, indicating that the differences in CRT between both eyes is not influenced by spherical refraction differences between both eyes. They represent the natural variations in one individual.
Among many others, one useful application of CRT measurements is for detecting macular oedema. In many cases, macular oedema is characterised by intraretinal fluid, that is, cysts or subretinal fluid that can be easily detected using SD-OCT. However, there are cases, in which no fluid is seen on SD-OCT. This vision-relevant macular oedema can only be detected by means of fluorescein angiography, or by measuring the thickening of the fovea by SD-OCT.11 Because fluorescein angiography is an invasive method, using other non-invasive methods for detecting subtle macular oedema might be beneficial. In this case, measurements of CRT using SD-OCT would be appropriate. Our calculations show that the sample size needed to detect such changes is relatively small.
Most clinical trials relied on visual acuity change as the primary outcome measure of treatment efficacy. In some conditions, however, retinal thickness measurement might even improve the validity of the study. In the example of pseudophakia-associated macular oedema stated above, the disease severity might be underestimated if visual acuity was used as an outcome measure alone. In assessing the eye after cataract surgery, the visual acuity might improve, however, if macular oedema occurred, it might be undervalued. Also in clinical trials, assessing the effect of cataract-inducing drugs, such as corticosteroids in diabetic macular oedema,24 ,25 macular oedema due to uveitis,26 central retinal vein occlusion, or branch retinal vein occlusion, using retinal thickness measurements would enhance the informative value of the study if the informative value of BCVA change is restricted due to media opacity.
The strength of our study relies on the relatively large number of subjects. However, there are also some drawbacks, such as the retrospective nature of the analysis and, therefore, prone to bias of uncertain kind. The sample size calculations performed in our study are based on CRT differences and, therefore, suitable for future studies assessing macular oedema involving the fovea or the centre of the macula. The parameters to be used in calculations for studies with respect to macular oedema not involving the fovea are yet to be determined.
In this study, we have provided standard values of persons 60 years of age and older. CRT proved to be a robust parameter not influenced by age and refractive error. The intraindividual difference between both eyes was small. These data will help to design clinical trials with SD-OCT measurements.
References
Footnotes
-
Contributors Study conception and design: AC, SF; data acquisition: AC, JF, EA, KD; analysis and interpretation of the data: AC, SF, BK, CBH; drafting and revising the article: AC, JF, EA, CBH, KD, BK, SF; final approval: AC, JF, EA, CBH, KD, BK, SF.
-
Competing interests None.
-
Patient consent Obtained.
-
Ethics approval Ethics Committee, University of Cologne, Germany.
-
Provenance and peer review Not commissioned; externally peer reviewed.
Linked Articles
- At a glance