Article Text

Abstract
Background/aims The National Institute for Health and Care Excellence (NICE) has recommended the use of ranibizumab for neovascular age-related macular degeneration (AMD) and for diabetic macular oedema (DMO) as part of its health technology appraisal process. In the economic evaluations of both interventions, utility values were derived from members of the general public wearing contact lenses with a central opacity that was meant to simulate the blind spot experienced by many patients with advanced retinal disease. This paper tests the validity of the contact lens simulation, and finding it to be invalid, explores the impact on prior economic evaluations.
Methods Visual acuity, contrast sensitivity and visual fields were assessed with and without simulation lenses in five healthy subjects with normal vision.
Results We identified important differences between the contact lens simulation and vision loss experienced by patients with AMD. The contact lens simulator did not cause the central scotoma which is characteristic of late-stage AMD and which leads to severe difficulty with everyday activities such as reading or recognising faces and objects. The contact lens instead caused a reduction in retinal illumination experienced by the subjects as a general dimming across the retina.
Conclusions A contact lens with a central opacity does not simulate a central scotoma. The clinical differences between simulated and actual AMD suggest there has been an underestimation of the severity of AMD health states. This brings into question the validity of the economic evaluations of treatments for AMD and DMO used by NICE.
- Retina
- Vision
This is an Open Access article distributed in accordance with the Creative Commons Attribution Non Commercial (CC BY-NC 4.0) license, which permits others to distribute, remix, adapt, build upon this work non-commercially, and license their derivative works on different terms, provided the original work is properly cited and the use is non-commercial. See: http://creativecommons.org/licenses/by-nc/4.0/
Statistics from Altmetric.com
Introduction
The National Institute for Health and Care Excellence (NICE) makes recommendations on the use of new and existing treatments within the English National Health Service (NHS) based on clinical and economic evidence. Quality-adjusted life year (QALY)-based cost-utility analysis forms a key component of NICE's health technology appraisal process.1
Treatments for neovascular age-related macular degeneration (AMD) and diabetic macular oedema (DMO) have been appraised in recent years.2 ,3 Both of these conditions can, in advanced cases, lead to the development of an absolute scotoma (a complete absence of retinal function) in the central retina. AMD and DMO have a serious impact on health-related quality of life (HRQoL),4 but no direct impact on length of life making the utility component of the QALY particularly important to the cost-effectiveness calculation. Indirectly, AMD can mediate lower life expectancy and the disease has been estimated to be associated with a decrease in life expectancy of 2 years.5
NICE recommends that the general public value health states to derive utility values for economic evaluation.1 The standard methodology recommended is for the general public to value health state profiles derived from a generic HRQoL Questionnaire such as the EQ-5D.1 ,6
Generic HRQoL instruments have been shown to be relatively insensitive to vision disorders.7 ,8 This has led NICE to deviate from its reference case. Appraisals of treatments for AMD and DMO were based on utilities from Czoski-Murray et al9 which conducted a contact lens simulation of AMD. In the study, members of the general public wore a contact lens with a central opacity that was meant to simulate the patient's view of the world through a central scotoma. Participants then completed a series of HRQoL questionnaires and the time trade-off to produce utility values associated with different levels of AMD severity. These health state utility values were applied to health economic models based on levels of visual acuity (which represents a person's ability to resolve fine detail).
NICE Multiple Technology Appraisal 155 recommended ranibizumab for the treatment of AMD.10 Following appeal and rapid review of Single Technology Appraisal 237, ranibizumab was recommended as an option for treating visual impairment due to DMO if the eye has a central retinal thickness of 400 µm or more at the start of treatment and the manufacturer provides ranibizumab with the discount agreed in the revised patient access scheme (PAS).3
Concern over the validity of this simulation led us to assess the performance of a contact lens occluder. Broadly speaking, scotomas caused by AMD, DMO and similar diseases are a consequence of abnormalities at a retinal level. In advanced cases, these retinal abnormalities lead to dysfunction of the rod and cone photoreceptors in a confined area of the retina (the macula), which results in a blind spot at or near fixation. This blind spot greatly interferes with reading and recognising faces and objects. In contrast, a contact lens sits on the cornea, in front of the nodal point of the eye. Opacities on a contact lens would not be expected to cause a blind spot. This is illustrated in figure 1, which demonstrates image formation in an eye focused at infinity. Ray tracing of image formation for two points in the object plane is shown in Figure 1A. To simulate the effect of the contact lens, an opaque spherical surface which partially fills the pupil is placed into the simulation immediately adjacent to the corneal surface. Figure 1B shows the ray paths with the opacity. It is clear that although fewer rays now contribute to the formation of the retinal images, none the less the images are formed. This can be intuitively understood by considering that rays from all points in the object fall upon all points on the cornea, thus an image will be formed even if most of the cornea is occluded. The image is darker because some of the rays are blocked from reaching the retina, and blurred because image formation by the periphery of the lens and cornea is more affected by aberrations than images formed by rays passing through the centre of the lens.

Ray diagram illustrating the optical effect of a contact lens with an opaque centre. In figure 1A the object (an arrow, left) is focused on the retina (right) with a plus lens (the crystalline lens and cornea, centre). Rays from all points in the object will be imaged onto the retina. In figure 1B, a contact lens is placed in front of the cornea. The contact lens has an opaque central zone which blocks some rays emanating from the object reaching the image. But some rays from all parts of the object still reach the retina. The retinal image is darker with the occluder and the image is blurred somewhat, because the optics at the edge of the crystalline lens have worse aberrations than the central optics, but the retinal image is complete and there is no scotoma.
To illustrate the formation of a complete image, ray tracing was conducted with Zemax optical design software (Radiant Zemax LLC, Redmond, Washington, USA). The Zemax image bitmap analysis tool was used to visualise the retinal image with and without the occluder. In our simulation, the image was subdivided into 200×200 pixels and 200 rays were aimed at each pixel using a single simulation wavelength of 550 nm and the number of rays incident on each pixel is displayed as a greyscale image. The object bitmap was a LogMAR visual acuity test chart. Figure 2A shows the resulting image without occlusion; figure 2B with the occluder. Although 35% of the light falling on the cornea has been occluded, the contrast of the retinal image is more than sufficient for the entire chart to be resolved. While the occluder does shadow the centre of the chart to a greater extent than the periphery, there is no clearly demarcated central area in which rays are entirely occluded as would be consistent with a scotoma.

A simulated image of a logMAR visual acuity test is shown without (A) and with (B) an occluder showing a reduction in luminance of the test chart, but no central opacity.
These illustrations show that the occluder would be expected to cause an overall reduction in the amount of light that reaches the retina, but not to cause a blind spot. While this reduction in retinal illumination may affect vision, the impairment is far less debilitating than that caused by a blind spot on the visual axis.
We measured the effect of the opaque contact lenses on five healthy volunteers who underwent a standard battery of vision tests, comparing their performance with the performance of actual AMD patients with real central scotomas.
Methods
Five control subjects with good visual acuity and no history of eye disease were recruited from colleagues and staff of the UCL Institute of Ophthalmology. Three of the authors (TB, MDC and SWO) acted as participants.
The study was approved by the University College London ethics committee, informed consent was obtained from all participants prior to data collection and the study conformed to the Declaration of Helsinki.
A soft contact lens with an opaque pupil was selected for all participants based on keratometry readings. The lens design was similar to that used in the Czoski-Murray et al study. In all cases, the lens was a 67% water content afocal soft contact lens of diameter 14.5 mm, with a 6 mm black central pupil (Ultravision CLPL, Leighton Buzzard, UK).
All vision tests were performed monocularly with and without the contact lens in place. The test eye was selected by each participant.
The vision tests included distance visual acuity (measured at 4 m using a standard ETDRS acuity chart (Lighthouse Low Vision products, New York, USA)) and contrast sensitivity (measured using either the MARS chart at 40 cm or the Pelli–Robson chart at 1 m).
Microperimetry was performed using the MAIA microperimeter (CenterVue, Padova, Italy). This is a scanning laser ophthalmoscope-based perimetry system which performs visual field testing while simultaneously imaging the retina, enabling the retinal location of each visual field position to be controlled.11 Sixty-eight points were tested over the central 10° of retina, spaced at 2° intervals. Retinal sensitivity was measured using white Goldmann III targets, presented for 200 ms, and thresholds were calculated using an adaptive staircase algorithm. Fixation stability was measured as the area of a bivariate contour ellipse encompassing 95% of fixation points.
Results
The contact lens reduced visual acuity by an average of 17 letters (median logMAR=−0.34; p<0.01) and reduced contrast sensitivity by an average of 7 letters (median logCS=0.36; p<0.01) (table 1). Fixation stability was not affected by the contact lens (p>0.2).
Results of visual tests for each participant, with and without simulation contact lens
Figure 3 shows a Nidek MP-1 microperimetry map superimposed onto an infrared image of the retina. Blue dots show the retinal locations corresponding to the centre of the fixation cross during the test. The density of these points indicates fixation stability. Coloured circles indicate retinal sensitivity. Green circles show better sensitivity (targets seen even when the luminance was reduced by 16–20 dB from a maximum of 127 cd/m2). Yellow, orange and filled red circles show areas of reduced sensitivity (luminance reduced by less than 16 dB). Open red squares show a dense scotoma (not visible at maximum intensity). It can be seen that the contact lens reduces retinal function over the central retina but does not produce any central region of absolute scotoma (with sensitivity less than 0 dB). Median retinal sensitivity without the contact lens was 27.0 dB, and 18.1 dB with the contact lens. The median difference was −8.3 dB.
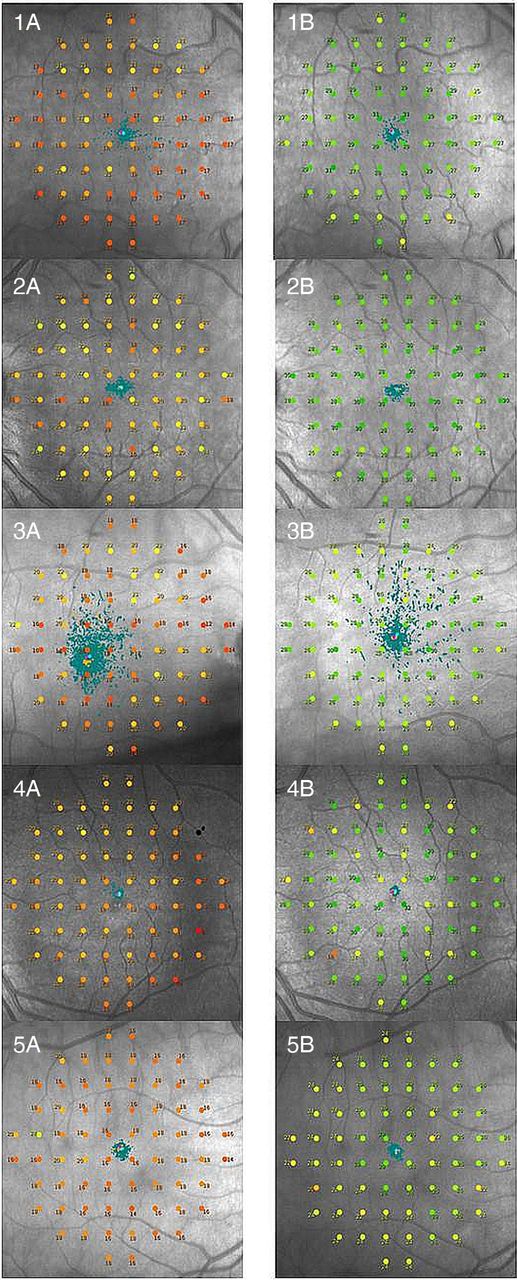
Microperimetry images for each participant with and without simulation contact lens.
For comparison, a microperimetry plot for a subject with AMD is shown in figure 4. It can be seen that this individual has a large area with no retinal function (sensitivity less than 0 dB, black circles on figure 3).

Microperimetry image for a subject with age-related macular degeneration.
Discussion
A contact lens with central opacity reduces retinal illumination across the macula leading to a reduction in visual acuity and contrast sensitivity. It causes a general reduction in retinal sensitivity and increases retinal blur but importantly does not create any area of absolute scotoma. Therefore, a contact lens with a central opacity does not accurately simulate the effects of advanced AMD.
Whether this will impact on the accuracy of the derived utility values is dependent on the strength of the association between visual acuity and utility across eye conditions.
Most studies of vision and utility have shown that utility values worsen as visual impairment increases, although different conditions may affect vision differently; for example some conditions impact on visual field, whereas others affect visual acuity.7 While some studies have correlated utility and visual acuity.12 Others have shown that visual acuity is weakly associated with utility and that other aspects of visual function such as contrast sensitivity and visual field have a large impact on utility.13 ,14
Brown reported utility values using the time trade-off in AMD, cataract and diabetic retinopathy by levels of visual acuity. For the same level of vision (20/70–20/100), patients with AMD reported a mean utility of 0.62, patients with cataract reported a mean utility of 0.71 and patients with diabetic retinopathy reported a mean utility of 0.78.15
Given the more severe impact of reduced acuity on utility in patients with AMD compared with cataract, it can be expected that a true simulation of AMD would lead the public to rate AMD more severely than predicted by a contact lens.
An error of the magnitude of 0.09 on the utility scale is a major shift in a disease that impacts on QALYs through long-term decrease in utility, although the impact on the incremental cost-effectiveness ratio (ICER) of this difference is difficult to quantify.
Evidence from the DMO Evidence Review Group report suggests the ICER is sensitive to the utility values used. ICERs ranged from £16 585 to £39 712 in sensitivity analysis based around the Czoski-Murray et al utility values, compared with £21 504 to £50 879 for the same sensitivity analysis based around Brown utility values. The cost-effectiveness threshold is generally considered to be between £20 000 and £30 000 per QALY for NICE evaluations. Both analyses included the Novartis PAS discount, so represented the actual cost to the NHS.16
Although the contact lens occluder causes a generalised reduction in sensitivity, it does not cause a localised defect characteristic of an absolute central scotoma. Further, at the stage of AMD associated with reduced visual acuity, some absolute central scotoma is to be expected.
A well-reported functional consequence of AMD is reduced fixation stability.17 Poor fixation stability is known to be associated with poorer visual function, particularly for reading.18 Reduced fixation stability was not identified by the contact lens simulation, further limiting its applicability to true macular disease.
This study was conducted in a sample of five participants. Although the sample size was small, the results were consistent, with all observers showing a drop in acuity and contrast sensitivity, but no scotoma. The use of ‘forced-choice’ testing procedures increases the reliability of the tests and reduces the opportunity for subjects to consciously influence the results.
How should central vision loss be simulated? Spectacles with opacities on are not a valid option as eye movements will alter the retinal position of the opacity. Although contact lenses seem like an attractive option to simulate vision loss, we have shown that this does not create a central scotoma. The most appropriate way of simulating a scotoma in people with good vision is to use feedback from an eye tracking system. These devices display an image on a computer screen while simultaneously measuring the position of the eye. Software can produce a scotoma at the region of the image corresponding to the centre of gaze. These systems have been used in research settings19 ,20 but have not, to our knowledge, been used to elicit utility values for AMD states in a public sample.
Alternatively, one could return to the reason for the use of the simulation. The deviation from generic HRQoL questionnaires to derive utilities was due to concern that standard questionnaires were not sensitive to changes in visual function due to limitations with the descriptive system. Future work to enhance the sensitivity of generic questionnaires may again place vision disorders on a common health state utility scale required for economic evaluation.
Conclusion
A contact lens with a central opacity does not simulate a retinal scotoma that is characteristic of diseases of the central vision like AMD. Opaque contact lenses reduce retinal illumination which leads to a reduction in visual acuity and contrast sensitivity, but the overall dimming effect bears little resemblance to a central scotoma, which is the hallmark of AMD.
The association with a lower level of visual acuity is not AMD specific and contact lens utilities could represent many causes of visual impairment. The visual acuity association has been shown to be different across disorders; therefore, public valuations using this method may misinform the public.
The use of these utility values in economic evaluations such as those used to inform NICE decision making may lead to an incorrect estimation of the cost effectiveness of treatments for AMD and other eye diseases that cause central scotomas.
References
Footnotes
-
Contributors TB, MDC, PW and SWO and GSR designed the research. MC collected the data. TB wrote the manuscript. TB had final responsibility for the overall content. All authors read and approved the final manuscript.
-
Funding Fight for Sight Programme Grant 1777, Moorfields Special Trustees, National Institute for Health Research (NIHR) Biomedical Research Centre based at Moorfields Eye Hospital NHS Foundation Trust and UCL Institute of Ophthalmology.
-
Competing interests TB and GSR receive funding from Moorfields Special Trustees and the National Institute for Health Research (NIHR) Biomedical Research Centre based at Moorfields Eye Hospital NHS Foundation Trust and UCL Institute of Ophthalmology. The views expressed are those of the authors and not necessarily those of the NHS, the NIHR or the Department of Health. Funders played no role in the design of the study, analysis of the data or preparation of the manuscript.
-
Ethics approval University College London.
-
Provenance and peer review Not commissioned; externally peer reviewed.
Linked Articles
- At a glance