Article Text

Abstract
Aim To examine the relationship between the two UK vision standards for driving: the ability to read a number-plate at 20 m and achieving 6/12 (+0.30 logMAR).
Methods 120 participants were assessed without refractive correction in this cross-sectional study. Vision was assessed with a Snellen chart, Early Treatment of Diabetic Retinopathy Study (ETDRS) style logMAR letter chart and logMAR chart using Landolt rings. Ability to read a post-2001 number-plate was assessed outdoors.
Results For all charts, there was an ‘overlap zone’ of visions within which it was uncertain whether participants would pass the number-plate test. Within this zone, sensitivity and specificity of the 6/12 cut-off for predicting number-plate performance were reasonable for Snellen and ETDRS style charts, but poor for Landolt. All participants with 6/7.5 Snellen (+0.10 logMAR ETDRS) or better could read a number-plate. Some participants (2–6%) with vision between this level and 6/12 could not read a number-plate, and 14%–15% could read a number-plate but not achieve 6/12.
Conclusions To best predict drivers’ ability to read a number-plate, vision should be assessed using a logMAR letter chart or a Snellen chart scored by full line. Drivers with 6/7.5 (+0.10 logMAR) or better vision can be advised that they meet the driving standard. Drivers with acuity between 6/9 and 6/12 (+0.12—+0.30 logMAR) should be advised to check their ability to read a number-plate, as some may not be able to. Clinicians will see patients who can read a number-plate, but do not achieve 6/12, who will need improved vision to meet visual requirements for driving.
- Vision
This is an Open Access article distributed in accordance with the Creative Commons Attribution Non Commercial (CC BY-NC 4.0) license, which permits others to distribute, remix, adapt, build upon this work non-commercially, and license their derivative works on different terms, provided the original work is properly cited and the use is non-commercial. See: http://creativecommons.org/licenses/by-nc/4.0/
Statistics from Altmetric.com
Until recently, the visual acuity standard for driving a car (Group 1 license) in the UK has been ‘the ability to read in good daylight (with the aid of glasses or contact lenses, if worn) a registration mark fixed to a motor vehicle and containing characters 79 mm high and 50 mm wide from 20 m’ (ie, a post-September 2001 number-plate).1 It has previously been of interest to understand the relationship between this ‘number-plate test’ and visual acuity, given that the tasks are different,2–4 so as to predict from clinical visual acuity measurement who would be likely to pass and fail the driving standard.2 ,3 ,5 ,6
However, in 2012, an additional standard was introduced that ‘the visual acuity (with the aid of glasses or contact lenses, if worn) must be at least 6/12 (Snellen, decimal 0.5) with both eyes open, or in the only eye if monocular’,1 in order to bring the UK into compliance with European Union (EU) directives.7 Given that there is now a specific acuity standard in addition to the number-plate test, and that these two standards have to be independently met, the relevant question becomes to what extent do these two standards pass and fail the same drivers? In particular, the rule change potentially means that some people who were eligible to drive will now be excluded.
No guidance has been provided by the Driver and Vehicle Licensing Agency (DVLA) regarding which charts to use or how to determine drivers’ vision. We therefore compare performance on several commonly used visual acuity charts with the number-plate test in order to provide clinicians with evidence on how to assess vision to give appropriate guidance to their patients on their visual fitness to drive.
Methods
Participants holding full or provisional driving licenses were recruited for this cross-sectional study from the staff and student population of Anglia Ruskin University. All participants gave informed consent, and ethical approval was received from Anglia Ruskin University. The tenets of the Declaration of Helsinki were observed.
Vision was assessed in a well-lit clinical examination room in the University Eye Clinic with computer generated test charts (Thomson Test Chart 2000 XPert software, V.11.09; Thomson Software Solutions, Hatfield, Herts) presented on an LCD screen at 6 m via a mirror. Vision of participants was assessed binocularly without refractive correction for the three commonly encountered chart designs outlined below in a single session. For each chart, participants were given the available letter choice, were instructed not to squint and to continue to attempt to read the symbols even once they thought they were guessing.
-
Snellen chart. Charts of this type are still commonly used in UK ophthalmological and optometric practice. Letters were presented in sans-serif 5×4 format from the British Standard selection D, E, F, H, N, P, R, U, V, Z.8 Letter size varied from 6/60 (one letter) to 6/4 (eight letters). A 6/7.5 line was present and there were five letters on the 6/12 line. Snellen chart design does vary, and this layout was chosen as the most typical. Participants started reading at 6/60 and continued until no more than one letter on a line was seen correctly.9 Vision was initially scored as the smallest line on which all letters were read correctly.
-
LogMAR progression chart using letters (ETDRS style chart). This chart type is the research standard10 and is becoming more commonplace in ophthalmology departments.3 Letters were presented in sans-serif 5×5 format from the Sloan letter selection C, D, H, K, N, O, R, S, V, Z that is used in the ETDRS chart.10 Letter size decreased in 0.1 logMAR steps between rows from +1.4 logMAR to -0.4 logMAR. Lines of letter size +0.8 logMAR and smaller had five letters per line. Participants started reading at +1.4 logMAR and continued until no more than one letter on a line was seen correctly.9 Vision was scored on a letter by letter basis, assigning a score of 0.02 logMAR for each letter correctly seen.11
-
LogMAR progression chart using Landolt rings (Landolt ring chart). Landolt rings are the International Standards Organisation (ISO) reference optotype,12 and consist of a letter C rotated so that the gap falls along one of four major or four oblique meridians. These were presented in 5×5 format in one of the eight positions. In each line of five symbols, three were presented along major meridian and two in oblique positions.12 All other aspects of presentation and scoring were identical to those described for the ETDRS style chart.
The ability to read a number-plate was tested outdoors in daylight at a distance of 20 m in line with DVLA regulations.1 Participants attempted to read three clean sample post-September 2001 style number-plates with black characters 79 mm high and 50 mm wide on a yellow background. If the participant read at least one plate without error they were deemed to have passed.
Results
There were 120 participants: 46 men and 74 women, mean age 25±10 years, range 18–66 years. Of these, 99 normally wore refractive correction for driving and 21 did not. Table 1 outlines the parameters examined for each test chart, and table 2 summarises the performance of each chart.
Definitions of the parameters used to compare vision with the ability to read a number-plate
Summary of the performance of each test chart in predicting the ability to read a number-plate at 20 m
Snellen chart
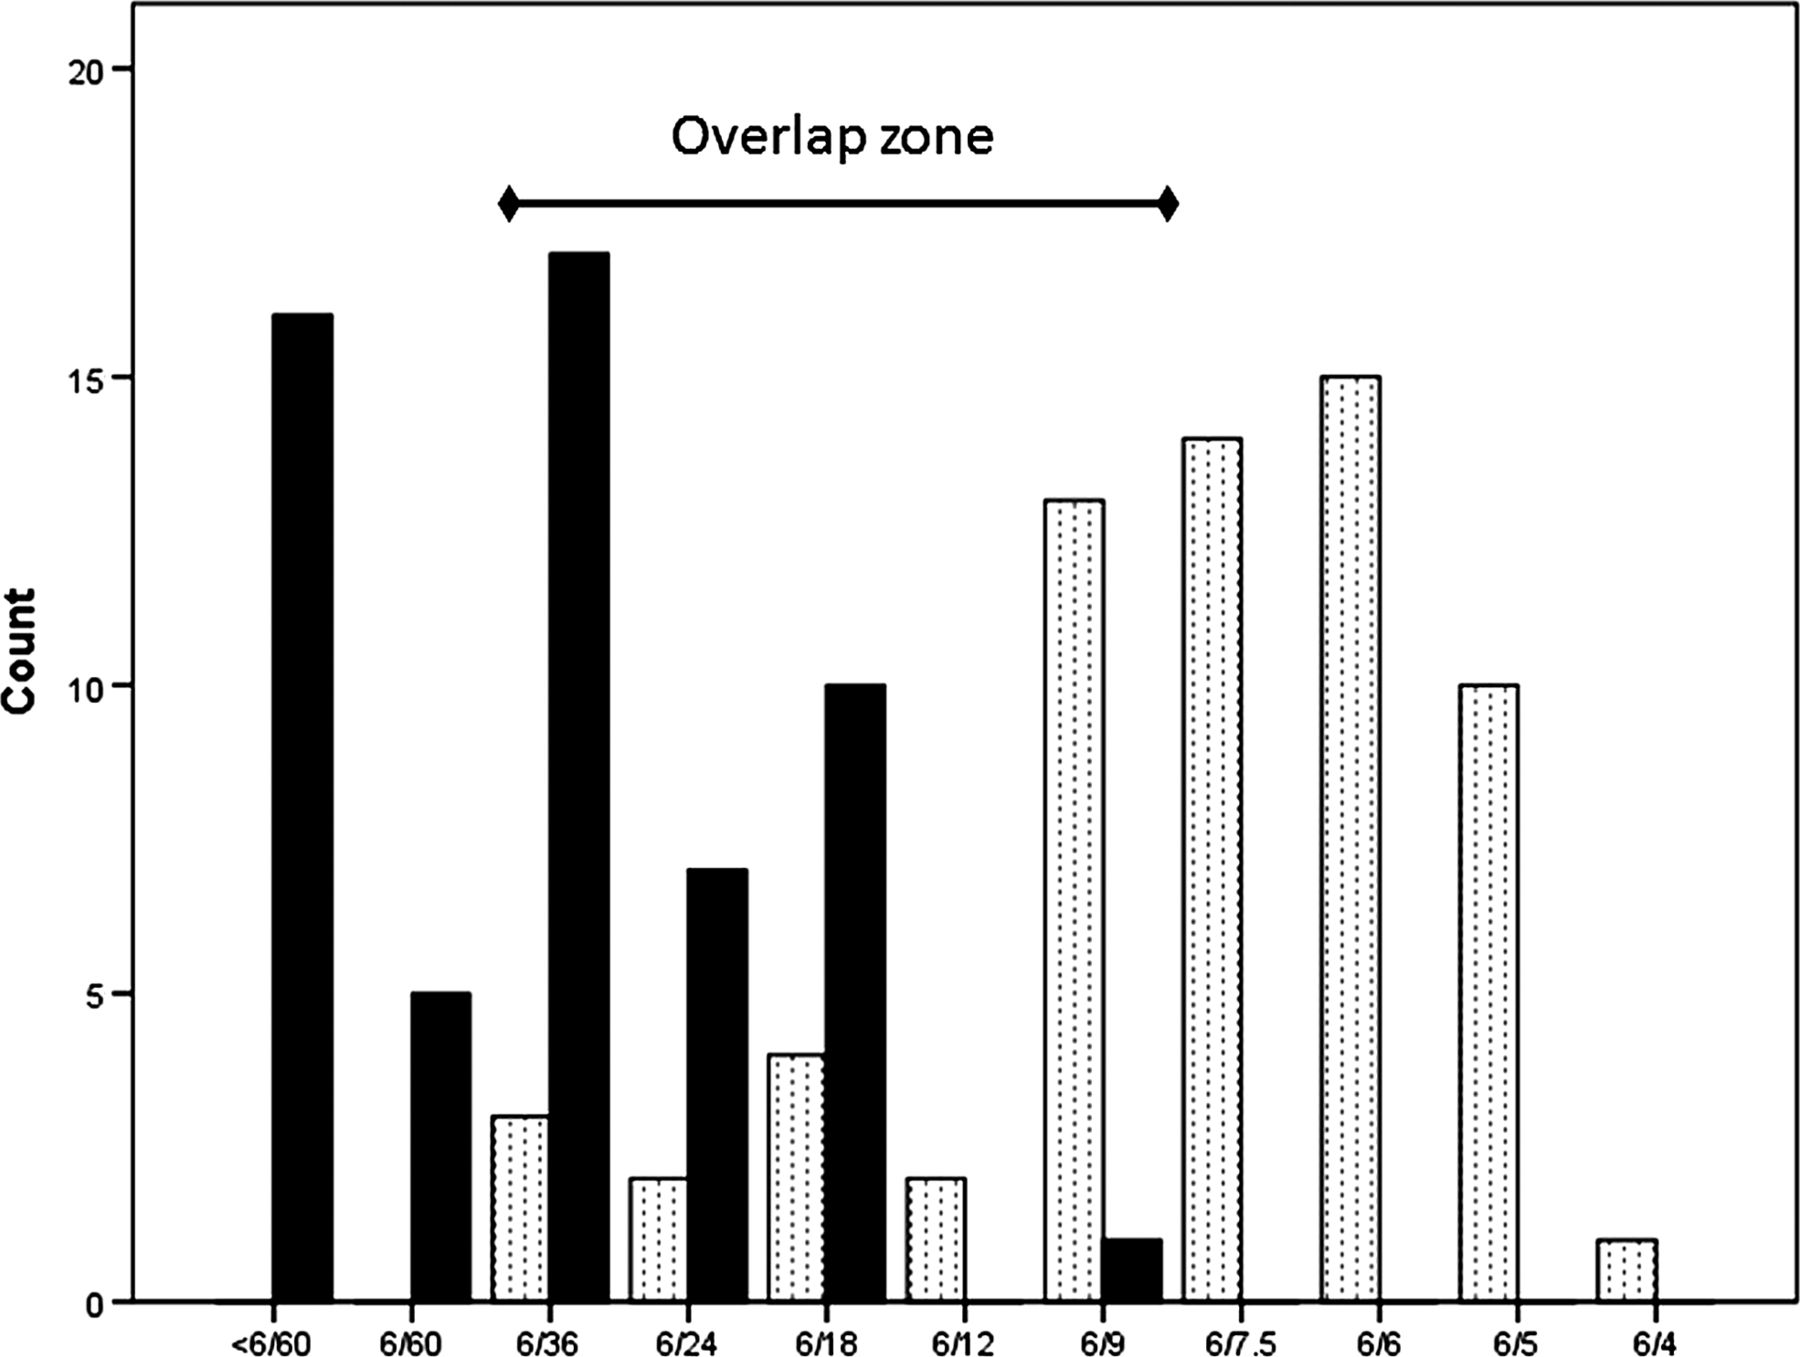
For the Snellen chart, when assigning vision as the lowest line on which all letters were read correctly, all participants with vision of 6/7.5 or better could read a number-plate at 20 m, and no participant with worse than 6/36 was able to successfully read a number-plate (figure 1). The analysis therefore concentrates on the subset of participants (n=59) with vision in the ‘overlap zone’ between 6/9 and 6/36 where there was uncertainty whether someone with this level of vision would pass the number-plate test.
The relationship between Snellen acuity (x-axis), defined as the lowest line on which all letters were read correctly, and the ability to pass (dotted bars) or fail (filled bars) the number-plate test by reading a number-plate without error at 20 m. The overlap zone, or the range of visions within which passing or failing the number-plate test is uncertain, is indicated.
Table 3 shows that within the overlap zone, 49 subjects (83%) fell into the same category for both tests, either passing both or failing both. One subject (2% of sample; false negatives in table 2) met the 6/12 standard, but was unable to read a number-plate. Nine subjects (15% of the sample; false positives in table 2) could read a number-plate, but did not meet the current visual standard for driving as their vision fell below 6/12.
The relationship between achieving 6/12 Snellen (all letters seen correctly) and passing the number-plate test for the 59 participants with vision in the overlap zone between 6/9 and 6/36
Within the overlap zone, sensitivity of the 6/12 cut-off to identify those who will fail the number-plate test was 97%, and specificity of the 6/12 cut-off to identify those who will pass the number-plate test was 63% (see also table 2). No other acuity cut-off value improved the specificity while maintaining the sensitivity beyond that provided by a value of 6/12.
The analysis above considers a subject to have achieved 6/12 only if they could read every letter on the 6/12 line. However, it has been considered14–16 that a patient achieves an acuity if he or she reads more than half of the letters on a line; for the 6/12 criterion, a more lenient 3 out of 5 or 60% correct threshold. Using this definition, the extent of the overlap zone was unchanged, and the false positive rate was slightly reduced (12%). However, the false negative rate rose to 14%, and both the sensitivity (82%) and specificity (54%) of the 6/12 cut-off were reduced.
ETDRS style chart
For the ETDRS style chart, the overlap zone was between +0.12 and +0.84 logMAR (6/7.9 and 6/41.5 Snellen equivalent) and included 50 participants (table 2). A total of 6% of the sample would meet the +0.30 logMAR standard for driving, but were unable to read a number-plate. Overall, 14% of the sample could read a number-plate, but could not achieve +0.30 logMAR. No other acuity cut-off value improved the specificity (62%) while maintaining the sensitivity (91%) beyond that provided by a cut-off of +0.30 logMAR.
Landolt ring chart
Vision was generally poorer with the Landolt ring chart, and the overlap zone was between +0.30 and +0.98 logMAR (n=51). In all, 2% of the sample could meet the +0.30 logMAR standard for driving but were unable to read a number-plate. However, 35% of the sample could read a number-plate but were unable to achieve +0.30 logMAR with this chart.
Discussion
EU directives7 aim to standardise the level of vision required to drive across the EU so that license holders in one member state will meet the requirements to drive in others. However, the directives are open to interpretation as to how they are applied in each member state. In the UK, the directive has been addressed by introducing an acuity standard of 6/12 in addition to the existing number-plate test rather than replacing it. Therefore, the new visual acuity standards for driving require that a Group 1 driver must be able to both achieve the pre-existing standard of reading a number-plate at 20 m and achieve a visual acuity of 6/12 in line with EU regulations.
The DVLA currently offers no guidance to clinicians on which charts to use or how to define an acuity of 6/12. Using a Snellen chart of the format used here, which has the same number of letters and similar spacing on the 6/12 line as the logMAR charts, the 6/12 cut-off best reflects the ability to pass the number-plate test when the acuity is scored as the lowest line that a subject can read in full. Using a definition of being able to read at least half the letters on the line reduces the sensitivity of the cut-off value. On the basis of this study, if a clinician has to use a Snellen chart, it is recommended that the definition of 6/12 be considered as being able to read every letter on the 6/12 line and that a 6/12 line with at least five letters is used.
Given the vagaries of Snellen chart design and line scoring, a more appropriate solution when advising if a patient's vision is good enough to drive would be to use a logMAR chart with letter optotypes which can be scored on a letter by letter basis. With the ETDRS style chart used here, a cut-off value of +0.30 logMAR (6/12 equivalent) reflects the ability to read a number-plate relatively well.
We also suggest on the basis of this study that despite being the ISO reference optotype,12 Landolt ring symbols are not used by clinicians as they may inappropriately increase the numbers of patients failing to meet the +0.30 logMAR visual standard (false positives in table 2).
However, when comparing two different tests it is inevitable that the agreement between them will not be perfect. The ability to read a number-plate is uncertain within a range of visions described here as the ‘overlap zone’ (tables 1 and 2). These overlap zones help to identify the patients to whom clinicians can give definitive advice: those with acuity of 6/7.5 Snellen or +0.10 logMAR or better all passed the number-plate test in this sample, and could be advised that they had visual acuity that was consistent with meeting the visual standards for driving. If using a Snellen chart, one with a 6/7.5 line is therefore recommended, as in its absence drivers would need to demonstrate 6/6 vision before it could be assumed that they would be able to read a number-plate.
Some patients will appear to meet the visual standard in the test room, but will be unable to read a number-plate at the correct distance. These patients (false negatives in table 2; 2%–6% of the participants within the overlap zone on the Snellen and ETDRS style charts) will have acuity in the region of 6/12 to 6/9 Snellen or +0.30 to +0.12 logMAR. Care should therefore be taken when making recommendations to patients with vision that only just meets the standard, and they should be advised that they must also check their ability to read a number-plate at 20 m.
Patients to whom this may be particularly relevant include those with cataract, as an acuity of 6/12 or worse is being applied in some areas as a criterion for National Health Service funded cataract surgery. Some patients with vision slightly better than 6/12 may find themselves in a position that they are unable to automatically qualify for cataract surgery, but should not drive as they are unable to read a number-plate.
A larger group of patients (false positives in table 2; 14%–15% of the participants within the overlap zone on the Snellen and ETDRS style charts) will believe themselves to meet the visual standards for driving as they can read a number-plate at 20 m, and would have met the standard prior to 2012, but will fail to achieve the 6/12 standard in the examination room and thus do not meet the new standard. The clinician will need to inform the patients that they must either improve their acuity with refractive correction for driving or, if acuity cannot be improved with correction, that the patients do not meet the visual standards to drive and that it is their duty to inform the DVLA,1 following General Medical Council guidance.17
We chose to examine participants with uncorrected refractive error, as inadequate refractive correction is a common reason for failing the number-plate test.18 This could be considered to be a limitation of the study, as results may not generalise to those with ophthalmic pathology limiting best corrected visual acuity, although a similar range of visions within which a number-plate pass can be achieved has been seen by others2 ,3 ,5 ,6 in relation to previous visual standards for driving. This is the first study to investigate the impact of the new regulations on visual fitness to drive.
Summary and conclusions
From 2012, car drivers in the UK must be able to read a number-plate at 20 m and have a visual acuity of 6/12 or better. To assess drivers’ vision, it is recommended that a logMAR progression letter chart (such as an ETDRS) or Snellen chart scored by full line is used. Drivers with 6/7.5 (+0.10 logMAR) or better can be advised that they meet the visual standard. Drivers with acuity between 6/9 and 6/12 (+0.12 to +0.30 logMAR) meet the visual acuity standard but should be encouraged to check their ability to read a number-plate, as some may not be able to. Clinicians will see patients who can read a number-plate but do not achieve 6/12, who will now need to improve their vision in order meet the visual requirements for driving.
Acknowledgments
This research received no specific grant from any funding agency in the public, commercial or not-for-profit sectors.
Footnotes
-
Contributors KL and SR designed the study. MFK acquired the data. All three authors analysed and interpreted the data, contributed to manuscript preparation, approved the final version, and are accountable for all aspects of the work.
-
Competing interests None.
-
Ethics approval Anglia Ruskin University Faculty of Science and Technology Ethics Committee.
-
Provenance and peer review Not commissioned; externally peer reviewed.
Linked Articles
- At a glance