Article Text

Abstract
Background/aims To examine the reproducibility of lesion dimensions of the retinal pigment epithelium (RPE) in neovascular age-related macular degeneration (AMD) with polarisation-sensitive optical coherence tomography (PS-OCT), specifically imaging the RPE.
Methods Twenty-six patients (28 eyes) with neovascular AMD were included in this study, and examined by a PS-OCT prototype. Each patient was scanned five times at a 1-day visit. The PS-OCT B-scan located closest to the macular centre presenting with RPE atrophy was identified, and the longitudinal diameter of the lesion was quantified manually using AutoCAD 2008. This procedure was followed for the identical B-scan position in all five scans per eye and patient. Reproducibility of qualitative changes in PS-OCT was evaluated. Interobserver variability was assessed. Results were compared with intensity-based spectral-domain OCT (SD-OCT) imaging.
Results Mean variability of all atrophy lesion dimensions was 0.10 mm (SD±=0.06 mm). Coefficient of variation (SD±/mean) was 0.06 on average (SD±=0.03). Interobserver variability assessment showed a mean difference of 0.02 mm across all patients regarding RPE lesion size evaluation (paired t test: p=0.38). Spearman correlation coefficient was r=0.98, p<0.001. Results revealed a good overall reproducibility of ∼90%. PS-OCT specifically detected the RPE in all eyes compared with conventional intensity-based SD-OCT that was not capable to clearly identify RPE atrophy in 25 eyes (89.3%, p<0.01).
Conclusions PS-OCT offers good reproducibility of RPE atrophy assessment in neovascular AMD, and may be suitable for precise RPE evaluation in clinical practice. PS-OCT unambiguously identifies RPE changes in choroidal neovascularisation compared with intensity-based SD-OCT that does not identify the RPE status reliably.
- Retina
- Imaging
- Degeneration
- Macula
- Neovascularisation
This is an Open Access article distributed in accordance with the Creative Commons Attribution Non Commercial (CC BY-NC 4.0) license, which permits others to distribute, remix, adapt, build upon this work non-commercially, and license their derivative works on different terms, provided the original work is properly cited and the use is non-commercial. See: http://creativecommons.org/licenses/by-nc/4.0/
Statistics from Altmetric.com
Introduction
The retinal pigment epithelium (RPE) is significantly involved in the pathogenesis of neovascular age-related macular degeneration (AMD). AMD-specific alterations lead to RPE cell death and vision loss.1–3
Spectral-domain optical coherence tomography (SD-OCT) detects retinal alterations in choroidal neovascularisation (CNV). However, SD-OCT lacks RPE-specific detection because intensity-based contrast is comparatively weak, and enhanced penetration depth from RPE atrophy is not always detectable, particularly when investigating small atrophy dimensions. Polarisation-sensitive OCT (PS-OCT) has been introduced as a relatively new imaging modality4–17 that overcomes these limitations by measuring the polarisation state of light, thereby specifically imaging the RPE based on its tissue-specific contrast.8–10 ,12 Melanin-containing structures like the RPE,9 ,10 ,16 the iris pigment epithelium14 or accumulations of pigment-loaded macrophages in outer retinal layers depolarise. Besides, in drusen and geographic atrophy (GA),13 ,14 ,17 PS-OCT frequently shows RPE atrophy in neovascular AMD.11 Identification of disease-specific patterns in CNV is significant regarding the status and progression of RPE disease, potentially contributing to a better pathophysiological understanding of neovascular AMD.
Aim of this study was to examine the quantitative reproducibility of RPE atrophy dimensions in eyes with neovascular AMD using PS-OCT in addition to assess the reproducibility of qualitative changes detected by PS-OCT. Results are discussed with reference to standard imaging techniques, as well as the advantages of the specific physical properties of PS-OCT.
Patients and methods
Twenty-six randomly selected patients (28 eyes) with neovascular AMD previously confirmed by biomicroscopy and a standardised fluorescein angiography (FA) were included into this prospective cross-sectional trial. Patients underwent a comprehensive ophthalmological examination, including best-corrected visual acuity (BCVA), slit-lamp biomicroscopy, FA and SD-OCT (Cirrus HD-OCT; Carl Zeiss Meditec, Dublin, California, USA) prior to study participation.
The local ethics committee approved the study protocol that adhered to the ethical tenets of the Declaration of Helsinki. Each patient gave written informed consent. Following patient inclusion, specific RPE imaging by PS-OCT was performed.
Exclusion criteria were other retinal pathologies, including GA and macular dystrophies.
Four treatment-naïve patients (four eyes) and 22 patients (24 eyes) previously treated with ranibizumab (Lucentis; Novartis Pharma AG, Basel, Switzerland) were included. Earlier treatment with ranibizumab was prescribed based on routine clinical examinations. Untreated patients who were initially clinically diagnosed with neovascular AMD on the same day of PS-OCT imaging were immediately treated as needed following routine clinical BCVA assessment, biomicroscopy, FA and SD-OCT imaging.
Imaging procedures and properties of OCT devices
A PS-OCT prototype developed by the Center for Medical Physics and Biomedical Engineering, Medical University of Vienna, measuring multiple physical parameters simultaneously (reflectivity, retardation, optic axis orientation, degree of polarisation uniformity (DOPU))12 was used for RPE and outer retinal layer imaging.13 The device includes a scanning laser ophthalmoscopy channel, acquiring fast online fundus images. High-resolution three-dimensional datasets are obtainable in 3.3 s. Raster scanning speed is 20 000 A-scans/s; axial resolution is 4.5 µm in tissue. Three scanning patterns are available: 64×1024, 128×512 and 256×256 (B-scans×A-scans). In this study, the 128×512 pattern was used, covering 6.2×6.7×3.3 mm3. The PS-OCT device operates at a centre wavelength of 839 nm with a full width at half maximum bandwidth of 58 nm. Probe power is 700 μW on the cornea.13
RPE segmentation is based on Stokes vector analysis.12 Stokes vector elements were derived from PS-OCT data, and averaged over adjacent pixels by calculating the mean value of each Stokes vector element within a rectangular window. Then DOPU (a quantity related to the classical degree of polarisation) was calculated as a function of position. The RPE is characterised by low DOPU values, providing its selective differentiation. Based on a defined threshold of the DOPU parameter allowing for RPE segmentation in PS-OCT, areas of DOPU <0.8 were selected and used to generate an overlay of the segmented RPE onto the intensity image provided by PS-OCT.12 ,13 This procedure enabled the visualisation of overlying retinal layers together with the RPE with a precise topography and demarcation.
In the DOPU images of figures 1–4, depolarising material is represented in green to blue colour (ie, the RPE or depolarising material in outer retinal layers or at the RPE level), polarisation-preserving tissue (ie, the photoreceptor layer and inner retinal layers) is visualised in yellow, orange or red colour.

Five repeated polarisation-sensitive optical coherence tomography (PS-OCT) measurements (1–5) of a patient diagnosed with choroidal neovascularisation secondary to neovascular age-related macular degeneration that show zones of retinal pigment epithelial (RPE) atrophy. Left: intensity B-scans with RPE overlay; middle: corresponding degree of polarisation uniformity images with respective RPE atrophy lesions; right: enlarged views of repeated measurements showing the lesion extensions and the manual segmentation lines (black). Rectangles represent sectors of PS-OCT B-scans comprising RPE atrophy and measured RPE atrophy section lengths, enlarged on the right.
Cirrus intensity-based SD-OCT achieves 5 µm axial resolution at 25 000 A-scans/s (scanning area=6×6 mm2). The 512×128×1024 scanning pattern was used. Cirrus SD-OCT was used in the context of the clinical evaluation of patients with neovascular AMD who were consequently included into this study.
Repeatability assessment of RPE atrophy section length using PS-OCT
To determine the repeatability of the section length of CNV-related RPE atrophy, five repeated measurements during a single visit were performed. RPE atrophy lesions with a minimum horizontal diameter of 100 µm were included in our study. Following RPE segmentation, the respective B-scan located closest to the macular centre presenting with RPE atrophy was quantified manually using AutoCAD (US Metric). Thereby, the measurement of the linear diameter of RPE atrophy in five independent B-scans per examination and eye was performed. Reproducibility of RPE atrophy section lengths was assessed in each eye by comparing the size of RPE atrophy in a set of five individual measurements. The initial starting point of the analysed B-scan was determined at the first point of identifiable RPE atrophy starting from left to right. Subsequently, the cursor was set to the next spot where intact RPE was again observable. This procedure was followed for every atrophic zone in the B-scan until all RPE atrophy zones were included into the measurement process, sparing zones of intact RPE. By adding up all RPE atrophy distances per B-scan, a final result per measurement was obtained. Two independent readers evaluated interobserver agreement.
Qualitative reproducibility of accumulating depolarising material present (accumulations of depolarising material at the RPE level and in outer retinal layers) was assessed by analysing five repeated PS-OCT datasets per eye in all eyes included into this study. Intensity-based SD-OCT images revealing hyper-reflective foci in outer retinal layers and hyper-reflective lesions at the RPE level were compared with PS-OCT images concerning correlations of depolarising material at corresponding locations. Both readers performed the qualitative analysis.
DOPU images were primarily used for identifying regions of RPE atrophy and accumulations of depolarising material, as DOPU images represent the condition of the RPE and related alterations most accurately, and are the basis for generating overlays of the segmented RPE onto the intensity image. Overlays of the segmented RPE and related depolarising structures with the intensity scan are also presented in the current study to make results most apprehensive to the reader.
PS-OCT images were compared with corresponding Cirrus OCT images regarding RPE atrophy identification.
Data analysis
Manual RPE atrophy size evaluation was performed in a total of 140 PS-OCT B-scans. For reproducibility analyses, mean values, SD (SD±) and a coefficient of variation analysis (SD±/mean) were used. Mean variability of all RPE atrophy section lengths was calculated. The variability describes the value of the minimum atrophy size subtracted from the maximum value measured within the five scans recorded per eye. Interobserver agreement was evaluated applying the paired t test and the Spearman correlation coefficient. Regarding the comparison analysis of RPE lesions identified by PS-OCT with conventional intensity-based Cirrus-OCT imaging, the percentage of eyes where zones of RPE atrophy corresponded clearly to PS-OCT images was assessed. Statistical significance was defined with p<0.05. Statistical software used was Med Calc V.11.5.1.0 and Excel 2011.
Results
Mean age of patients was 81 years (SD±=7.6 years); 18 patients were female; 8 were male. Thirteen right eyes and 15 left eyes were included. Mean BCVA was 0.46 Snellen (range 0.05–0.8). Two patients saw hand movements; two patients were able to count fingers.
Mean RPE atrophy dimensions of all eyes (of all 140 B-scans) detected by PS-OCT were 0.74 mm (SD±=0.55 mm, median=0.66 mm, range 0.14–2.06 mm). Mean variability of all atrophy section lengths was 0.10 mm (SD±=0.06 mm). Average coefficient of variation (SD±/mean) was 0.06 (SD±=0.03). No outliers or far-out values were statistically identifiable. Results are summarised in table 1.
RPE atrophy section lengths detected by PS-OCT in 26 patients (28 eyes) with CNV related to neovascular AMD
Figure 1 shows a representative example of a 73-year-old female patient with neovascular AMD and respective PS-OCT images revealing RPE atrophy. All five measurements, including manually quantified RPE atrophy dimensions are shown. The DOPU images offer specific RPE identification due to its intrinsic depolarising properties. The RPE is shown as a greenish band. In the atrophic zone, the green band is missing. The respective atrophy section length was repeatedly manually quantified regarding its linear diameter (black line). Mean atrophy section length was 0.31 mm (SD±=0.04 mm) in this patient, the coefficient of variation was 0.13 and variability of atrophy section lengths was 0.11 mm, representing good reproducibility of ∼90%.
Mean RPE atrophy size in untreated eyes was 0.78 mm (SD±=0.57 mm) and 0.52 mm (SD±=0.34 mm) in treated eyes. Mean variability of RPE atrophy section lengths in the untreated group was 0.10 mm (SD±=0.06 mm) and 0.06 mm (SD±=0.03 mm) in the treated group. Coefficients of variation in the untreated and treated groups were 0.06 (SD±=0.03) and 0.05 (SD±=0.02), respectively.
PS-OCT unambiguously identified the RPE and associated atrophy in all eyes compared with conventional intensity-based SD-OCT that did not clearly identify borders of the atrophic zone in 25 eyes (89.3%, p<0.01, figure 2).

Comparison of RPE atrophy detection by PS-OCT and intensity-based SD-OCT in eyes with neovascular age-related macular degeneration. (A) shows the unambiguous identification of RPE atrophy in PS-OCT clearly corresponding to the intensity-based OCT images; (B) illustrates an example where the unambiguous identification of atrophic RPE is only possible using PS-OCT imaging. Note that in (B), it is not possible to clearly identify the borders of the atrophic zone (rectangle). RPE atrophy sections indicating RPE atrophy borders (arrows) are illustrated. DOPU, degree of polarisation uniformity; PS-OCT, polarisation-sensitive optical coherence tomography; RPE, retinal pigment epithelium; SD-OCT, spectral-domain optical coherence tomography.
Interobserver variability
Differences of RPE atrophy measurements of all eyes were not statistically significant between both readers (p=0.38). Spearman correlation coefficient was r=0.98 with p<0.001 (slope of the trend line=0.98). Mean RPE atrophy size of all eyes was 0.74 mm (SD±=0.55, range 0.14–2.06, coefficient of variation=0.06 (SD±=0.03)) for reader 1 and 0.76 mm (SD±=0.55, range 0.14–2.09, coefficient of variation=0.08 (SD±=0.05)) for reader 2, respectively.
In addition to RPE atrophy, our patients frequently revealed accumulations of depolarising material in outer retinal layers, potentially related to intraretinal macrophages and exudates (particularly at the level of the outer nuclear layer) (figure 3). Accumulations of depolarising material were further found at the RPE level, possibly depicting the latter’s potential of proliferative activity (figure 4). Accumulations of depolarising material were imaged reproducibly in all PS-OCT datasets, and correlated well with hyper-reflective foci in SD-OCT (figure 3).
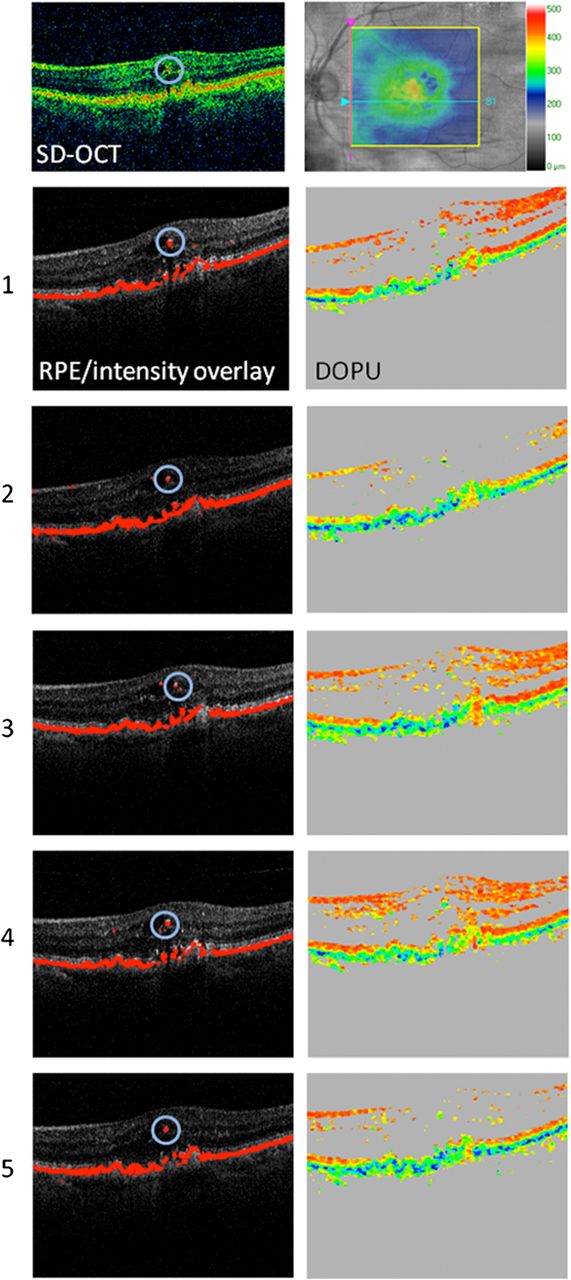
Qualitative reproducibility assessment of depolarising foci in outer retinal layers in a patient with neovascular age-related macular degeneration imaged by PS-OCT. All five repeated measurements (1–5) are shown. Note that regions of accumulations of depolarising material in outer retinal layers (circles) were repeatedly visualised by PS-OCT. Further, an intensity SD-OCT image is shown (top left), revealing a correlation of hyper-reflective foci and depolarising material in PS-OCT. A retinal thickness map is illustrated at the top right. Depolarising hyper-reflective foci in outer retinal layers may represent RPE-derived material or melanin-containing macrophages. DOPU, degree of polarisation uniformity; PS-OCT, polarisation-sensitive optical coherence tomography; RPE, retinal pigment epithelium; SD-OCT, spectral-domain optical coherence tomography.

Qualitative reproducibility assessment of depolarising material accumulated at the level of the RPE in a patient with neovascular age-related macular degeneration imaged by PS-OCT. All five repeated measurements (1–5) are shown, representing identical B-scan locations. Regions of accumulations of depolarising material at the RPE level (blue circles) were imaged reproducibly by PS-OCT. The intensity-based SD-OCT image is shown, revealing increased hyper-reflectivity (orange circle), corresponding to accumulated depolarising material at the RPE level present in PS-OCT. However, a precise demarcation of RPE-related accumulations is only unambiguously identifiable by PS-OCT, not by intensity-based SD-OCT. DOPU, degree of polarisation uniformity; PS-OCT, polarisation-sensitive optical coherence tomography; RPE, retinal pigment epithelium; SD-OCT, spectral-domain optical coherence tomography.
Discussion
Comparability, repeatability and objectivity are essential factors when implementing a new method and novel diagnostic approaches.
Previous investigations showed that PS-OCT provides precise identification of the RPE in AMD.11 ,13 ,14 ,17 However, data confirming the repeatability of the method in neovascular AMD are still missing (essential to assess its clinical applicability). The present study evaluates the reproducibility of RPE atrophy quantification in patients with neovascular AMD using PS-OCT. Further, the qualitative reproducibility of the detection of depolarising material at the RPE level and within retinal structures by PS-OCT is analysed.
Our results showed an average repeatability of RPE atrophy size measurements of ∼90%, signifying good reproducibility. Moreover, interobserver agreement was excellent (Spearman correlation coefficient r=0.98 with p<0.001), confirming the objectivity of PS-OCT when applied for RPE atrophy detection in CNV.
Further, the similar reproducibility of RPE atrophy section lengths in the untreated and the treated group indicates that RPE atrophy measurements in PS-OCT are reproducible in patients with different disease stages, independent of treatment intervention. (Although, patient numbers in the untreated group were too small to reliably determine statistical significance between the treated and untreated group).
This study also showed that PS-OCT reproducibly detects accumulations of depolarising material in outer retinal layers (corresponding to hyper-reflective foci in intensity-based SD-OCT, figure 3) and at the RPE level (figure 4), possibly representing migrating RPE cells and exudates. These results are relevant as previous in vitro histological studies have showed that RPE recovery is accomplished by RPE proliferation and hyperplasia.18 The reproducible in vivo detection of these RPE-related alterations, therefore, is of high scientific and clinical value. These findings make the method potentially suitable for the analysis of pathologically affected RPE regarding the latter's loss and/or accumulation.
Although it has been shown previously that conventional SD-OCT imaging is applicable for evaluating GA in dry AMD,19–22 less work has been done describing RPE atrophy quantitatively in neovascular AMD.23 The assessment of atrophy dimensions by RPE-specific PS-OCT imaging, as performed in the current study, allowed to demonstrate the advantages of PS-OCT, evaluating RPE lesions related to neovascular AMD reproducibly, compared with standard intensity-based SD-OCT monitoring, showing limitations in clearly detecting the borders of the atrophic zone in the majority of eyes (figure 2). Apart from the RPE specificity of PS-OCT, another reason for this may be that RPE atrophy in CNV is partially very small, different to GA in dry AMD (characterised by circumscribed RPE atrophy of at least 250 μm in longest diameter),24 making the differentiation of atrophic RPE in intensity-based SD-OCT particularly difficult due to layers with similar reflectivity.
This study may further be used as a cornerstone for the evaluation of RPE atrophy progression during follow-up in patients with CNV treated with anti-vascular endothelial growth factor (anti-VEGF), enhancing our understanding about disease-specific pathophysiological characteristics. Detection of subtle RPE atrophy (ie, in the beginning of the treatment phase with anti-VEGF in patients with neovascular AMD) or other lesions (ie, accumulations of depolarising material at the RPE level and in outer retinal layers) may provide considerable impact in the estimation of prognosis regarding the prospective condition of the RPE of an individual patient. Nevertheless, this remains to be investigated in larger prospective clinical trials.
Our group13 has recently shown that PS-OCT achieves high reproducibility of automatic RPE atrophy size determination in GA (coefficient of variation was 0.07 on average (range 0.01–0.19) revealing a repeatability of ∼90%). The findings of the current study and of previous investigations, therefore, underline the potential of the clinical applicability of PS-OCT in neovascular and dry AMD.
A limitation of the present study is that RPE atrophy size was obtained manually, instead of using automatic atrophy-quantification algorithms. The integration of an eye tracker function would potentially improve repeatability of measurements in next-generation PS-OCT devices.5 Although only one central PS-OCT B-scan has been used for reproducibility analysis, this method seems justified as similar approaches have been used in previous studies.25 Automated en-face assessment of RPE atrophy area in CNV, similar as recently shown in patients with GA in dry AMD,13 would be desirable, as this approach would allow for a precise topographic analysis of the full atrophy dimensions imaged in an entire PS-OCT dataset. Further, patterns of the partially diffusely distributed RPE atrophies could be analysed using the RPE specificity of PS-OCT, improving our understanding about RPE atrophy characteristics and the RPE-related disease course of CNV. Automated PS-OCT segmentation algorithms are, however, presently not designed to assess RPE atrophy dimensions planimetrically in CNV yet, as recently shown for GA.13 ,17 Algorithms automatically measuring the whole area of RPE atrophy in CNV are currently being developed, and will be used in future investigations.
In conclusion, PS-OCT proved evidence of good reproducibility in RPE atrophy quantification related to neovascular AMD with an excellent interobserver agreement. Further studies are needed to analyse the reproducibility of RPE atrophy dimensions in different retinal diseases involving RPE atrophy (ie, macular dystrophies or myopia) to demonstrate the full clinical potential of PS-OCT.
Acknowledgments
The critical analysis and editing of this manuscript by Aner Gurvitz is gratefully acknowledged.
References
Footnotes
Contributors The study was conducted by CS, KT, BB, MP, CKH and US-E; data collection and data management were performed by CS and KT; data was analysed by CS; interpretation of the data was done by CS, KT, BB, MP, CKH, EG and US-E; the manuscript was prepared and written by CS; critical revision of the manuscript was performed by CKH and US-E.
Funding This study was supported by an independent scientific grant (FWF grant P19624-B02, Austrian Science Fund) and the European Union (FP7 HEALTH programme grant 201880, FUN-OCT).
Competing interests None declared.
Patient consent Obtained.
Ethics approval Ethics Committee, Medical University of Vienna.
Provenance and peer review Not commissioned; externally peer reviewed.
Linked Articles
- At a glance