Article Text

Abstract
Background/aims To evaluate baseline low-luminance visual acuity (LLVA) as a predictor of visual acuity improvement in patients with neovascular (wet) age-related macular degeneration (wAMD) receiving antivascular endothelial growth factor A (anti-VEGF) therapy.
Methods In the HARBOR trial, 1084 treatment-naïve patients ≥50 years of age with subfoveal wAMD received intravitreal ranibizumab 0.5 or 2.0 mg monthly or as needed. To measure LLVA, patients read a normally illuminated ETDRS (Early Treatment Diabetic Retinopathy Study) chart with a neutral density filter placed in front of the study eye. Patients were assigned into quartiles based on the magnitude of the difference between best-corrected visual acuity under optimal luminance (BCVA) and LLVA (BCVA–LLVA gap). The association between mean change in BCVA from baseline and BCVA–LLVA gap at baseline was analysed using a general linear model.
Results A smaller baseline BCVA–LLVA gap predicted significantly higher BCVA gains over 24 months (p<0.0001 at each month; Pearson correlation), even after controlling for baseline BCVA or stratifying by treatment arm. Patients in the smallest baseline BCVA–LLVA gap quartile gained an average of +13.4 letters compared with +2.4 letters for patients in the widest baseline BCVA–LLVA gap quartile. At months 12 and 24, the smallest baseline BCVA–LLVA gap quartile had the highest proportion of ≥15−≥30-letter gain, and the widest baseline BCVA–LLVA gap quartile had the highest proportion of ≥15-/≥30-letter loss (p<0.0001; Fisher's exact test).
Conclusions The baseline BCVA–LLVA gap is a significant predictor of visual acuity response to anti-VEGF treatment in patients with wAMD.
Trial registration number NCT00891735; Post-results.
- Macula
- Vision
- Drugs
- Degeneration
- Neovascularisation
This is an Open Access article distributed in accordance with the Creative Commons Attribution Non Commercial (CC BY-NC 4.0) license, which permits others to distribute, remix, adapt, build upon this work non-commercially, and license their derivative works on different terms, provided the original work is properly cited and the use is non-commercial. See: http://creativecommons.org/licenses/by-nc/4.0/
Statistics from Altmetric.com
Introduction
Currently, it is difficult to reliably predict how individual patients with newly diagnosed neovascular (wet) age-related macular degeneration (wAMD) will respond to antivascular endothelial growth factor A (anti-VEGF) therapy. Presently, from the available clinical trial data, we can inform patients that after 2 years of treatment, they have a mean chance of gaining 7.6–9.1 letters, a 30%–40% chance of gaining ≥3 lines of vision, and a ∼10% chance of losing ≥3 lines of vision.1 However, it is difficult to identify upfront which patients will do well and which will fare poorly.2 ,3 Currently, no validated models exist to help retina specialists predict how different subgroups will respond to treatment.4 Patients desire to know as much as possible about their prognosis upon diagnosis, as do physicians, hence, the interest in finding predictors of treatment outcomes with anti-VEGF therapy.
Herein, we report a new analysis from the HARBOR trial of ranibizumab (Lucentis, Genentech Inc, South San Francisco, California, USA) in wAMD, which suggests that low-luminance visual acuity (LLVA) assessment at baseline may have utility in estimating a patient's potential for vision improvement with anti-VEGF monotherapy. We will refer to best-corrected visual acuity (BCVA) assessed under optimal illumination as ‘BCVA’ and to BCVA assessed under low luminance as ‘LLVA’. LLVA has been shown to be predictive of visual acuity (VA) loss in patients with geographic atrophy, the atrophic or ‘dry’ form of late-stage AMD.5 The objective was to investigate if the baseline relationship of LLVA to BCVA has any clinically meaningful correlation with treatment outcomes in patients with wAMD enrolled in HARBOR.1 ,6 Our hypothesis was that a greater drop in vision under the ‘stress’ of low-luminance conditions may be a manifestation of more advanced disease and, therefore, the magnitude of the gap between BCVA and LLVA at baseline may be a predictor of a wAMD patient's capacity for visual function improvement.
Materials and methods
Study design
HARBOR (ClinicalTrials.gov identifier: NCT00891735) was a 24-month, phase III, randomised, multicentre, double-masked, dose-response study that evaluated the efficacy and safety of intravitreal ranibizumab 0.5 mg monthly (n=275), 0.5 mg as needed (PRN) (n=275), 2.0 mg monthly (n=274) or 2.0 mg PRN (n=273) in treatment-naïve patients ≥50 years of age with subfoveal neovascular AMD and baseline BCVA of 20/40 to 20/320 (Snellen equivalent). After 3 months, PRN groups were evaluated monthly for retreatment eligibility based on Early Treatment Diabetic Retinopathy Study (ETDRS) charts and spectral-domain optical coherence tomography (SD-OCT) (Cirrus HD-OCT III; Carl Zeiss Meditec, Inc, Dublin, California, USA) criteria.6 The study was approved by institutional review boards, adherent to the Declaration of Helsinki and compliant with the Health Insurance Portability and Accountability Act. Written informed consent was obtained from all participants prior to study entry. Detailed methods for the HARBOR study have been reported previously.1 ,6
BCVA and OCT were performed monthly. OCT images were graded at baseline, day 7 and months 1 through 4, 6, 9, 12, 18 and 24. LLVA was evaluated at baseline, and months 3, 6, 9, 12, 15, 18, 21 and 24.
BCVA was measured first under normal lighting conditions, followed immediately by LLVA measurement (both using ETDRS charts at a distance of 4 m). LLVA was measured as described by Sunness and colleagues (figure 1A).5 To replicate low-luminance conditions, patients read an ETDRS chart under normal lighting with a 2.0-log-unit neutral density filter (ie, a grey film that decreases luminance 100-fold; Kodak Wratten filter; Kodak, Rochester, New York, USA) placed just in front of the best lens correction for the study eye. In this analysis, all four ranibizumab treatment groups were pooled and then divided into quartiles based on the BCVA–LLVA difference at baseline.

(A) Assessing vision under standard and low-luminance conditions. (B) Mean VA change from baseline over 24 months. All treatment groups pooled. Error bars represent 95% CIs. BCVA, best-corrected visual acuity; ETDRS, Early Treatment Diabetic Retinopathy Study; LLVA, low-luminance visual acuity; VA, visual acuity.
Outcome measures
The primary end point of the HARBOR study was the mean change from baseline in BCVA at month 12.6 In this analysis, the main outcome measure was BCVA change (ETDRS letters) from baseline over 24 months in the pooled patient population. Post hoc analyses were performed on the prospective data to compare the following outcomes by baseline BCVA–LLVA gap quartiles: mean BCVA change (ETDRS letters) from baseline over 24 months, and BCVA gain or loss of ≥15 and ≥30 ETDRS letters from baseline at months 12 and 24.
Statistical analysis
Analysis of variance (ANOVA) was used for baseline comparisons of continuous outcomes among treatment groups. The relationship between BCVA and LLVA at baseline was analysed by linear regression. The association between the baseline BCVA–LLVA gap and BCVA change from baseline was analysed using Pearson correlations and a general linear model with and without baseline BCVA; statistical testing was performed using the t distribution. Gap quartiles were compared using ANOVA and the χ2 test. Vision gain/loss from baseline (per cent of patients) were compared across quartiles by Fisher's exact test. Statistical significance was defined as p<0.05. No imputation was used for missing values and no adjustment was made for multiple comparisons. All analyses were conducted using the SAS software, V.9.3 (SAS Institute).
Results
Baseline patient characteristics
Baseline demographics and characteristics of the four treatment groups in the HARBOR study have been previously described.6 The mean age was 78.7 years and patients were mostly white (∼60% female). Approximately 46% and 38% of patients in each treatment group had minimally classic or purely occult choroidal neovascularisation (CNV) lesion types, respectively.
Since mean BCVA (range: 53.6–54.5 letters) and mean LLVA (range: 28.2–29.3 letters) at baseline were similar across the four treatment arms, patients were pooled for analyses (N=1084). Excluded were 12 patients due to unavailable LLVA and one patient due to a missing baseline LLVA. In each treatment group, patients with better BCVA at baseline also generally had better LLVA at baseline (linear regression, p<0.0001).
Quartiles were defined based on the difference (gap) between BCVA and LLVA at baseline, where quartile 1 had the narrowest gap of ≤17 letters and exhibited the worst BCVA and the best LLVA at baseline (table 1). These patients were more likely to have smaller CNV lesions and less subretinal fluid. Quartile 4 patients had the largest BCVA–LLVA gap of ≥33 letters (table 1), with baseline BCVA (57.6 letters) comparable to the BCVA in quartiles 2 and 3, but having the worst LLVA of 15.4 letters, the largest CNV lesions, the most subretinal fluid, and the most classic lesions.
Baseline characteristics of quartiles based on baseline gap between standard and LLVA from the HARBOR study
Visual acuity outcomes
At month 24, the mean LLVA vs BCVA change from baseline (ETDRS letters) was +15.4 vs +8.7, respectively, or ∼77% greater (figure 1B). There was no linear relationship between the absolute baseline LLVA and BCVA change from baseline in the pooled treatment groups (month 12, p=0.21; month 24, p=0.17). However, clinically and statistically significant differences in VA emerged when patients were stratified by the baseline BCVA–LLVA gap quartiles (figure 2). A smaller baseline gap predicted higher BCVA gains over 24 months (figure 2), with mean gains of +13.4 and +2.4 ETDRS letters in quartiles 1 and 4, respectively; at each month, a comparison among quartiles was statistically significant (p<0.0001 by ANOVA). As a continuous measure, the gap magnitude was negatively correlated with BCVA change from baseline (p<0.0001 at each month based on Pearson correlations ranging from −0.256 at month 3 to −0.273 at month 24) and the association remained statistically significant after controlling for baseline BCVA (p<0.0001 from a basic multivariate linear model). These outcomes remained consistent when patients were stratified by baseline BCVA (figure 3A) and treatment group (p<0.05 at each month for each treatment group based on ANOVA) (figure 3B).
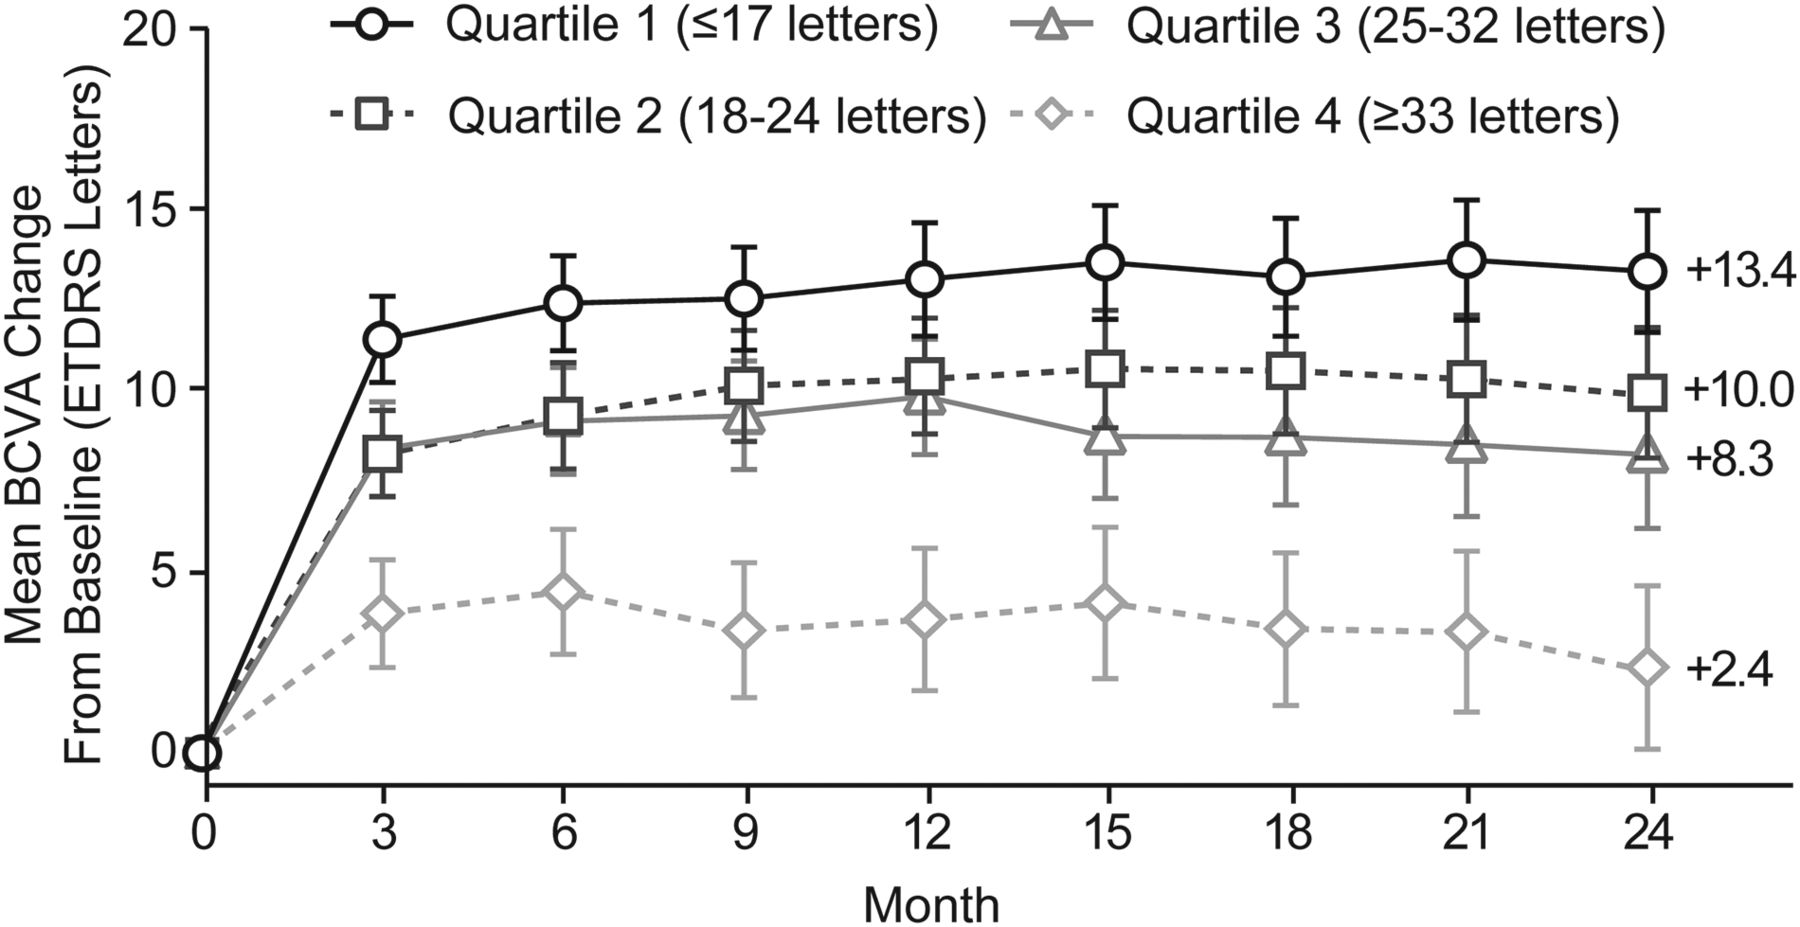
Mean standard vision change from baseline over 24 months by baseline vision gap quartiles. Negative correlation between baseline BCVA–LLVA gap and BCVA change from baseline: p<0.0001 at each month based on Pearson correlation from linear regression. The n values for baseline gap quartiles 1, 2, 3 and 4 are 307, 263, 246 and 268, respectively. All treatment groups pooled. Error bars represent 95% CIs. BCVA, best-corrected visual acuity; ETDRS, Early Treatment Diabetic Retinopathy Study; LLVA, low-luminance visual acuity.

(A) Mean standard vision change over 24 months by baseline vision gap quartiles after controlling for baseline standard vision. (B) Mean standard vision change over 24 months by baseline vision gap quartiles after stratifying by treatment group. Association between baseline BCVA–LLVA gap and BCVA gain, controlling for baseline BCVA: p<0.0001 at each month based on a basic multivariate linear model with the gap magnitude considered a continuous measure. Association between baseline BCVA–LLVA gap and BCVA gain, stratifying by treatment group: p<0.05 at each month for each treatment group based on ANOVA. The n values for baseline quartiles of worst to best BCVA are 287, 269, 271 and 257, respectively. All treatment groups pooled. Baseline n values are 272, 270, 271 and 271 for ranibizumab 0.5 mg monthly, 2.0 mg monthly, 0.5 mg PRN and 2.0 mg PRN, respectively. ANOVA, analysis of variance; BCVA, best-corrected visual acuity; ETDRS, Early Treatment Diabetic Retinopathy Study; LLVA, low-luminance visual acuity; PRN, as needed.
A greater proportion of patients with the smallest BCVA–LLVA gap gained ≥15 letters at months 12 and 24 (44%–49%) compared with the widest BCVA–LLVA gap (24%–26%) (figure 4A; p<0.0001 by Fisher's exact test). Furthermore, almost 20% of patients with the widest gap lost ≥15 letters at month 24 compared with only 3% of patients with the smallest gap (figure 4B; p<0.0001 by Fisher's exact test). The proportions of patients with 30-letter gain or loss are depicted in figure 4C and D.

Standard vision gain and loss at months 12 and 24 by baseline vision gap quartiles. (A) Patients who gained ≥15 ETDRS letters from baseline; (B) patients who lost ≥15 ETDRS letters from baseline; (C) patients who gained ≥30 ETDRS letters from baseline; (D) patients who lost ≥30 ETDRS letters from baseline. *p<0.0001; †p=0.0010; based on Fisher's exact test. BCVA, best-corrected visual acuity; ETDRS, Early Treatment Diabetic Retinopathy Study.
Discussion
The results from this analysis of the large HARBOR trial suggest that the BCVA–LLVA gap at baseline is a statistically and clinically significant predictor of VA outcomes in wAMD patients receiving anti-VEGF treatment. These outcomes remained consistent even when patients were stratified by baseline BCVA, demonstrating that this is not a result of patients gaining more vision simply because they started with poorer baseline vision and had more potential letters to gain—their gains were a manifestation of the degree of the gap. Regardless of baseline vision, patients with the largest gap always performed the worst (figure 3). Patients with the narrowest gap had the highest percentage of three-line and six-line vision gainers, while those with the widest gap had the highest percentage of three-line and six-line losses at months 12 and 24 (figure 4).
Our hypothesis was that a greater drop in vision under low luminance may be a manifestation of more advanced wAMD disease associated with more limited capacity for VA improvement. In our study, a wider BCVA–LLVA gap was associated with significantly lesser vision gains with treatment. It should be noted that although the patients with the widest baseline BCVA–LLVA gap consistently gained the least number of ETDRS letters, these patients still had much better vision outcomes compared to the sham group from the MARINA study, in which patients lost on average nearly three lines of vision throughout 2 years.7 Measuring the BCVA–LLVA gap is straightforward and could potentially better characterise the wAMD patient population. Limitations of the HARBOR analysis are the lack of a comparison sham group and inclusion of only treatment-naïve patients. Additional data are needed to confirm if the BCVA–LLVA gap is predictive of treatment response in previously treated patients.
The search for clinical biomarkers in wAMD has produced a number of important observations. Sunness and colleagues reported that in patients with geographic atrophy, the low-luminance deficit at baseline was a strong predictor of subsequent VA loss.5 In wAMD, younger age, better baseline VA and smaller CNV lesions have a strong association with better final VA in response to anti-VEGF treatment.4 Patients with the ‘T’ allele in tSNP rs30250008 or a darker iris colour9 also tend to experience better visual outcomes with anti-VEGF therapy. Predictors for suboptimal response include diabetes mellitus,10 initial fibrovascular and serous pigment epithelial detachment,11 predominantly or minimally classic lesions,12 and high-risk alleles in CFH, ARMS2 and VEGF-A.10 ,13 ,14 OCT studies have also revealed anatomic response factors, including photoreceptor inner segment/outer segment junction (IS/OS) status.15 ,16 While IS/OS and external limiting membrane (ELM) integrity have been shown to be correlated with final photoreceptor integrity in wAMD, they were not analysed in the HARBOR study.17 In our study, patients with the largest BCVA–LLVA gap appeared to have more advanced disease manifested by significantly larger CNV lesions, more subretinal fluid and more classic lesions (table 1).
The slow increase in light sensitivity is called the dark-adaptation process and is related to the rate of regeneration of photopigments and to the intracellular concentration of calcium. However, we can only speculate about the nature of the molecular defect(s) underlying the striking correlation between the BCVA–LLVA gap and BCVA gain in response to anti-VEGF treatment. Dark adaptation may be impaired very early in wAMD and may be a functional stressor to the photoreceptors. It has been previously demonstrated that fellow eyes in patients with wAMD with relatively slow foveal dark-adaptation rates were especially likely to develop subretinal neovascularisation.18 Fellow eyes with normal VA of patients with unilateral wAMD tend to have foveal cones that are normal in number but function abnormally.19 It may be that as the disease progresses and photoreceptors become more compromised, dark adaptation becomes progressively impaired. Eyes with early wAMD and less photoreceptor damage may be expected to perform relatively better under low-luminance conditions and have a smaller gap.
In the HARBOR trial, LLVA was tested immediately after BCVA. Adaptation time was not prespecified in the protocol. Therefore one possibility is that the BCVA–LLVA gap is a reflection of patients’ ability for rapid dark adaptation (first 10 min). The early rapid phase of dark adaptation is cone mediated.20 Our patients with the widest BCVA–LLVA gap had the most subretinal fluid. The photoreceptors are expected to die when detachment separates them from the retinal pigment epithelium and the choriocapillaris, their source of oxygen and nutrients.19 It is likely that the smallest BCVA–LLVA gap patients had healthier photoreceptors with greater potential for functional recovery, while patients with the widest BCVA–LLVA gap may have had greater degrees of photoreceptor cell death making visual recovery much less likely. Patients with larger CNV lesions likely had more photoreceptor and ELM destruction and lower likelihood of structural and functional recovery.
Since all HARBOR patients had subfoveal wAMD, it is likely that a significant number of cone cells were already lost or in a state of distress. Therefore the BCVA–LLVA gap could be a measure of the degree of foveal cone cell dysfunction in wAMD, which is also associated with SD-OCT qualitative pathologic structural abnormalities. Dark adaptation deteriorates with age.21 In our analysis, there was no imbalance in age across the BCVA–LLVA quartiles (table 1), suggesting that the natural process of ageing did not drive the differences.
In summary, the difference between BCVA measured under standard and low-luminance conditions (BCVA–LLVA gap) at baseline was a potent predictor of VA outcomes in patients with wAMD treated with ranibizumab enrolled in the HARBOR trial. The significance of our study is its demonstration that, in a large representative wAMD population, a relatively simple, inexpensive, and straightforward functional test, the measurement of the baseline BCVA–LLVA gap, yields specific subgroup predictive capability with a high degree of statistical significance.
Acknowledgments
Third-party writing assistance for this manuscript was provided by Grace H. Lee, PharmD, of Envision Scientific Solutions, and funded by Genentech, Inc.
References
Footnotes
Contributors All authors were involved in the conception and design of this analysis, acquisition of data or analysis and interpretation of data. They all were involved in the revision of the article for intellectual content and the approval of the final version to be published. HS provided statistical advice and analysis.
Funding Genentech, Inc, South San Francisco, California, USA, participated in the design and conduct of the studies; data collection, analysis and interpretation of results; preparation, review and approval of the manuscript and the decision to submit the manuscript for publication.
Competing interests REPF has received research support from Aerpio, Alcon, Allergan, Bausch & Lomb, Genentech, Inc, GlaxoSmithKline, L-Path, Pfizer, Regeneron and Rigel. HS and IS are employees of Genentech, Inc, and IS is a stockholder in Roche.
Ethics approval The study protocol was approved by institutional review boards or ethics committees for each clinical site. Written informed consent was obtained from all participants prior to study entry.
Provenance and peer review Not commissioned; externally peer reviewed.
Linked Articles
- At a glance