Article Text

Abstract
Aim To explore the application of intraoperative wavefront aberrometry (IWA) for aphakia-based biometry using three existing formulae derived from autorefractive retinoscopy and introducing new improved formulae.
Methods In 74 patients undergoing cataract surgery, three repeated measurements of aphakic spherical equivalent (SE) were taken. All measurements were objectively graded for their quality and evaluated with the ‘limits of agreement’ approach. ORs were calculated and analysis of variance was applied. The intraocular lens (IOL) power that would have given the target refraction was back-calculated from manifest refraction at 3 months postoperatively. Regression analysis was performed to generate two aphakic SE-based formulae for predicting this IOL. The accuracy of the formulae was determined by comparing them to conventional biometry and published aphakia formulae.
Results In 32 eyes, three consecutive aphakic measurements were successful. Objective parameters of IWA map quality significantly impacted measurement variability (p<0.05). The limits of agreement of repeated aphakic SE readings were +0.66 dioptre (D) and −0.69 D. Intraoperative biometry by our formula resulted in 25% and 53% of all cases ±0.50D and ±1.00 D within SE target, respectively. A second formula that took axial length (AL) into account resulted in improved ratios of 41% and 70%, respectively.
Conclusions A reliable application of IWA to calculate IOL power during routine cataract surgery may not be feasible given the high rate of measurement failures and the large variations of the readings. To enable reliable IOL calculation from IWA, measurement precision must be improved and aphakic IOL formulae need to be fine-tuned.
- Clinical Trial
- Optics and Refraction
Statistics from Altmetric.com
Introduction
Modern microincisional phacoemulsification techniques have increased the expectations of both patients and surgeons that accurate refractive outcomes can be achieved. However, these expectations are not always met, and the proposed targets of ≥55% within 0.50 dioptre (D) and ≥85% within 1.00 D of emmetropia in virgin eyes are not yet reached in every unit.1
Real-time biometry during cataract surgery could improve refractive outcomes, and be especially valuable in more challenging cases, for instance, after refractive surgery.2 ,3
Numerous studies argue that intraoperative wavefront aberrometry (IWA) may well become an indispensible tool in future cataract surgery.4–6 To date, three intraocular lens (IOL) formulae based on intraoperative autorefractive retinoscopy have been published,7–9 but IWA-based formulae have not yet been reported. This study examines whether IWA can reliably produce repeatable results and aims to systematically explore which variables may influence IWA-based IOL calculations.
Methods
This is a prospective study of 74 consecutive patients attending Hamburg University Eye Hospital for routine consecutive cataract surgery and was approved by the Hamburg ethics committee, adhering to the tenets of the declaration of Helsinki. Once informed consent was obtained, standard preoperative assessment and measurements were conducted on 80 eyes, including manifest refraction and slit lamp examination. Participants with ocular comorbidities impacting on optical media transparency other than cataract were excluded.
Conventional IOL calculation was performed using the Haigis formula10 with the IOL-Master (V.3, Carl Zeiss Meditec, Germany) and the resulting IOL (targeting emmetropia in most instances) was implanted rather than the one suggested by aberrometry. The surgical technique followed a standard routine and was performed under topical anaesthesia by three surgeons (SJL, TK and GR) all of whom used the same lid speculum, ophthalmic viscosurgical device (OVD, Polyvisc 2%, Polytech, Germany) and superior trapezoidal 2.4 mm clear corneal incision. Surgery was not altered (and only insignificantly delayed) by the IWA measurements. A continuous circular capsulorrhexis was created, aiming for a 5.5 mm diameter. Phacoemulsification was performed with a vertical chop technique. In all cases the same type of foldable monofocal IOL (A-constant 118.4) was implanted in the capsular bag. One of two optometrists evaluated the manifest refractive outcome 3 months after surgery.
Intraoperative data on sphere, cylinder and axis were generated for a back vertex distance of 12 mm with a Conformité Européene-certified commercially available Hartmann–Shack aberrometer (dynamic range −10 D to +25 D sphere and 0 to −5 D of cylinder) that was mounted to the surgical microscope (Zeiss OPMI Lumera T, Germany). The aberrometer uses an infrared wavelength of 850 nm.
Three repeated IWA measurements were attempted during aphakia for every patient. Before each measurement was taken, the surgeon filled the anterior chamber (AC) with OVD, aiming for a normal intraocular pressure (IOP), which was monitored by palpation. Correct alignment of the visual axis was ensured by inspection of the Purkinje–Sanson images I and II through the operating microscope. An optometrist (the same person at each case) was then asked to take the measurement. To determine the measurement quality, the individual wavefront map percentage was calculated using a standardised automated procedure with ImageJ (V.1.47 g for Mac, National Institutes of Health, USA).
Statistical analysis
The data were analysed with STATA (release 11, StataCorp. 2009, USA). Conventionally scaled refraction poses a problem for statistical analysis. For this reason, Thibos and Horner's formulae (p. 81)11 were used to transform conventional refractive data into power vector components.
Bland–Altman plots on spherical equivalent (SE) differences were calculated for repeated measurements during aphakia with test–retest reliability coefficients as a measure for intraclass correlation. Repeated measure ANOVA was applied to test whether measurement differences could be explained by variability in refractive state, corrected distance visual acuity (CDVA) or age.
The IOL that would have given the target refraction, the so-called adjusted IOL, was back-calculated from manifest refraction 3 months postoperatively using Holladay’s refractive vergence formula.12 Regression analysis was performed to generate two aphakic SE-based formulae to predict this adjusted IOL, giving the so-called predicted IOL. Refractive outcome is reported in terms of the difference between the 3-month postoperative manifest SE and the planned refractive outcome (prediction error). Once adjustments for differing back vertex distances and A-constants had been made, the data of this study were inserted into the published aphakia formulae by Ianchulev,7 Leccisotti8 and Wong9 and the corresponding calculations were computed.
Results
A total of 77 eyes from 74 patients were measured with IWA. In six bilateral cases, one eye was randomly excluded. In five further eyes no IWA data could be obtained, leaving 69 eyes (38 right and 31 left) for analysis. The mean age of those patients (40 male and 29 female) was 69.39 years (SD 11.39). Table 1 provides further data including IWA.
Biometric and refractive data
When three measurements of intraoperative refraction (termed M5, M6 and M713) were possible, these data were assessed through difference means plots and are presented with their limits of agreements in figure 1.

Reproducibility of three intraoperative wavefront aberrometry aphakia measurements (labelled M5, M6, M7). Bland–Altman plot comparing repeated spherical equivalent (SE) measurements. Mean difference is shown by solid black line and limits of agreement by dashed lines. N=30.
The measurement failure rate was 43.96% (91 out of 207 gross measurement attempts). All three repeated aphakia measurements could be generated in 32 eyes. Two IWA maps and their refractive data were excluded from analysis because the cylinder measurements were outside the dynamic range of the aberrometer. All spherical measurements were within range.
The mean quality score of those IWA maps within the dynamic range of the aberrometer across the three aphakia measurements was 30.07% (N=30, SD 11.83; 100% corresponds to the highest possible area of the best IWA map). A significant (p<0.05) inverse direct relationship of IWA quality scores and measurement accuracy was found with linear regression analysis. However, correlation was low (figure 2). There was no significant difference in IWA map quality among the three surgeons performing the operations (SJL 30 , TK 28 and GR 16 eyes operated upon, respectively (F(4, 52)=0.414, p=0.798)).
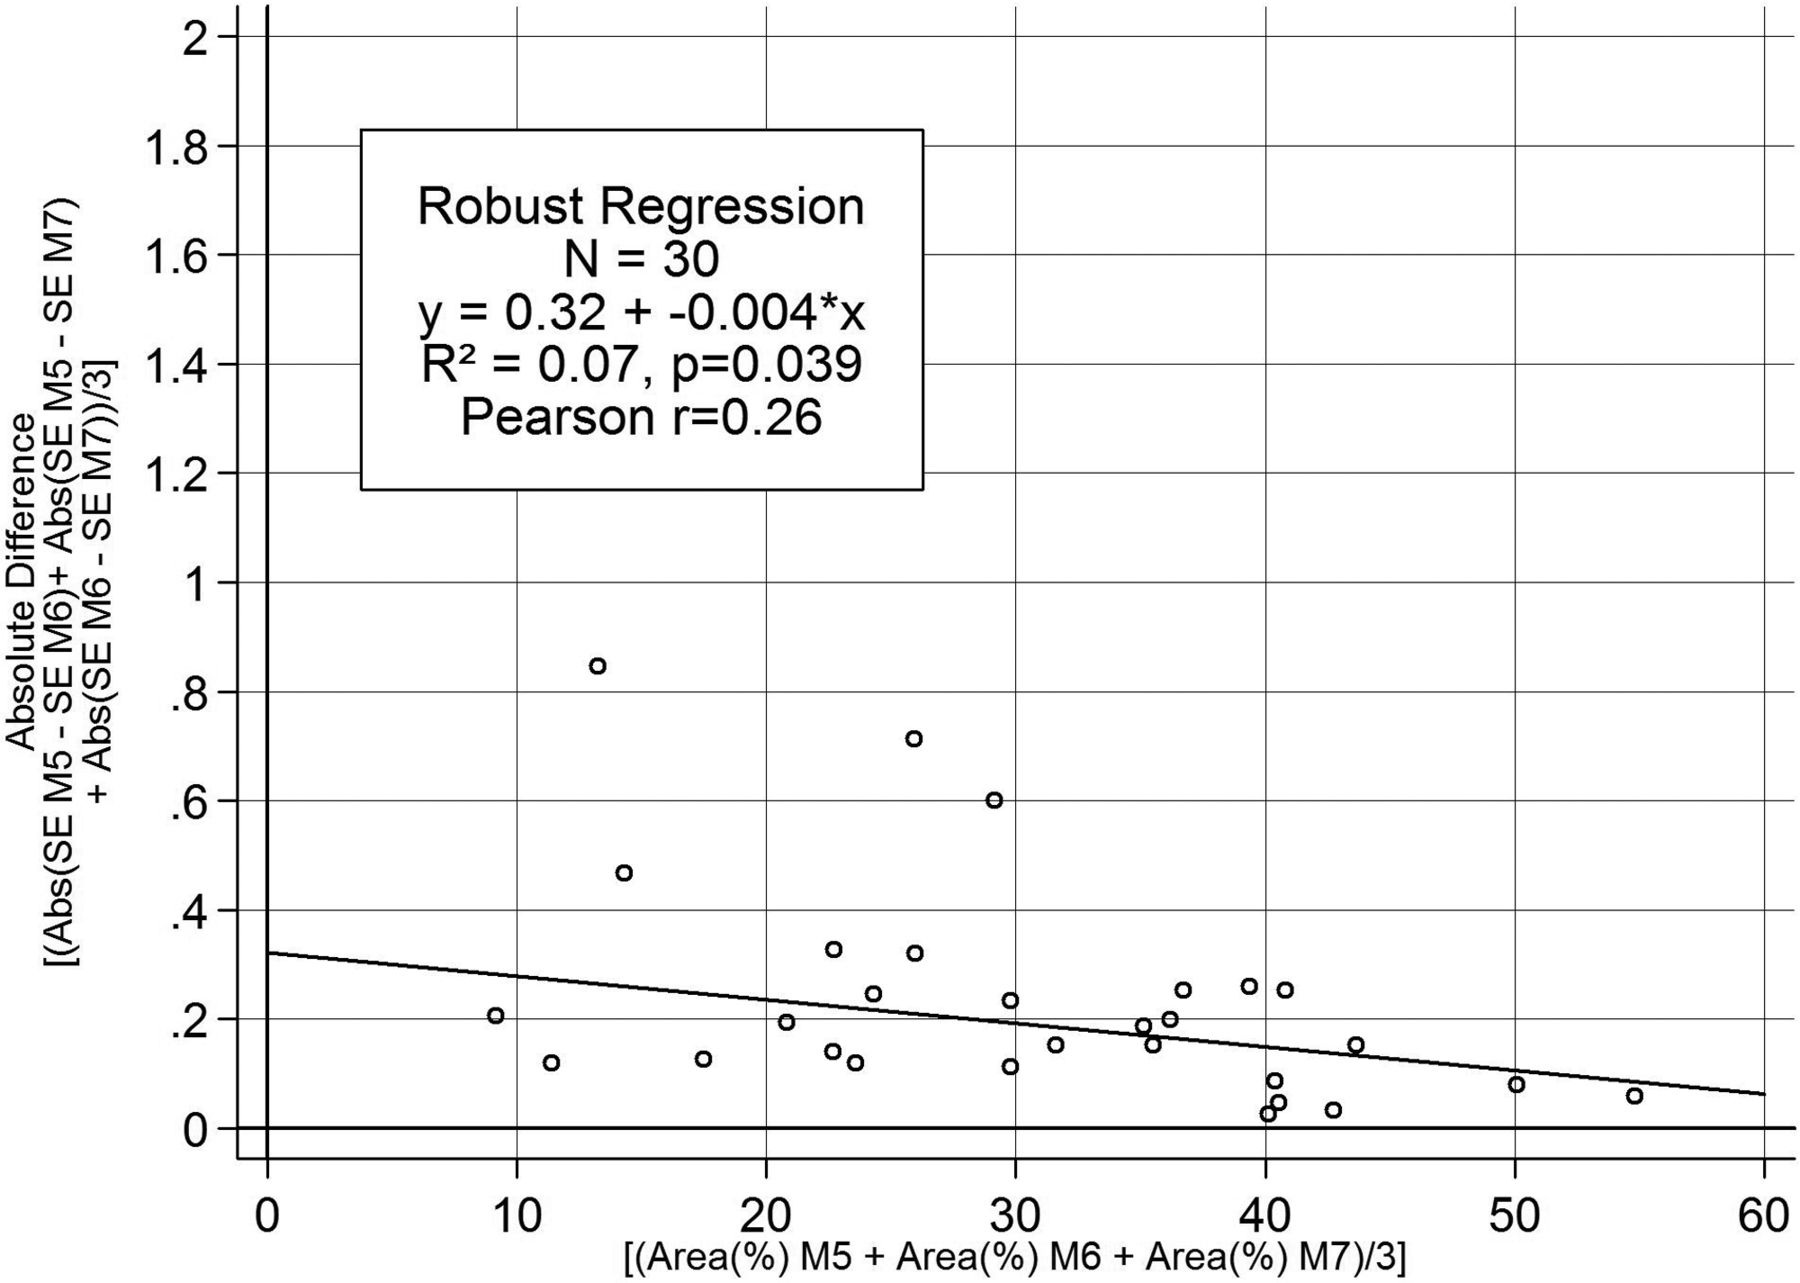
Linear regression analysis of spherical equivalent (SE) threefold measurements and quality scores during aphakia (labelled M5, M6, M7) demonstrates the higher the quality score (x-axis), the lower the dioptric difference among repeated measurements (y-axis).
Repeated measure ANOVA revealed no statistically significant explanatory variables to account for differences between threefold measurements during aphakia (table 2).
Partial Etas (η2) for interaction effects of the possible explanatory variables in mixed ANOVA models for threefold measurements during aphakia with OVD (N=30)
As table 3 describes, ORs predicting measurement failure revealed no significant influence of age, refractive parameters, axial length (AL) and cataract grade as defined by Pentacam Nuclear Staging analysis with the Pentacam (Oculus, Wetzlar, Germany).
ORs from the logistic regressions for predicting measurement failure (N=65)
The IOL power required to achieve emmetropia as by our aphakia-based formula, called LiHue, is presented in table 4, and figure 3A shows the corresponding regression plot.
Formulae to calculate the emmetropic IOL from the aphakic SE

(A) Linear regression analysis on the distribution of adjusted intraocular lens (IOL) power (calculated with Holladay's refractive vergence formula)13 and aphakic spherical equivalent. N=64 (One eye had missing k values and four eyes were lost to the 3-month follow-up). (B) Linear regression analysis on the distribution of adjusted IOL power (calculated with Holladay's refractive vergence formula)12 and predicted IOL power as derived from LiHue/AL formula, differentiating between axial length <25.5 mm and >25.5 mm.
Had these IOLs been implanted, 25.0% and 53.13% of all cases would have been within ±0.50 D and ±1.00 D of SE target, respectively, as back-calculated from Holladay’s transformed refractive vergence formula (table 5).12
Top: absolute and relative numbers for how often the two new proposed aberrometry-derived formulae, the LiHue and LiHue/AL, would have calculated a different IOL from the one implanted, how the refractive outcome would have been affected and how accurately astigmatism was measured during aphakia as compared with postoperative refraction at 3 months. Bottom: mean and median prediction errors for three published aphakia formulae (derived from autorefractive retinoscopy), LiHue/AL and LiHue as compared with conventional biometry with the Haigis formula Top
Eyes with low SE (ie, myopic eyes) showed higher variation of the adjusted IOL. This was compensated for by a modified second formula (called LiHue/AL) that takes AL into account, differentiating between eyes shorter or longer than 25.5 mm (table 4). This formula yielded outcomes of 40.63% and 70.32% within ±0.50 D and ±1.00 D SE target, respectively. Figure 3B shows the corresponding regression plot.
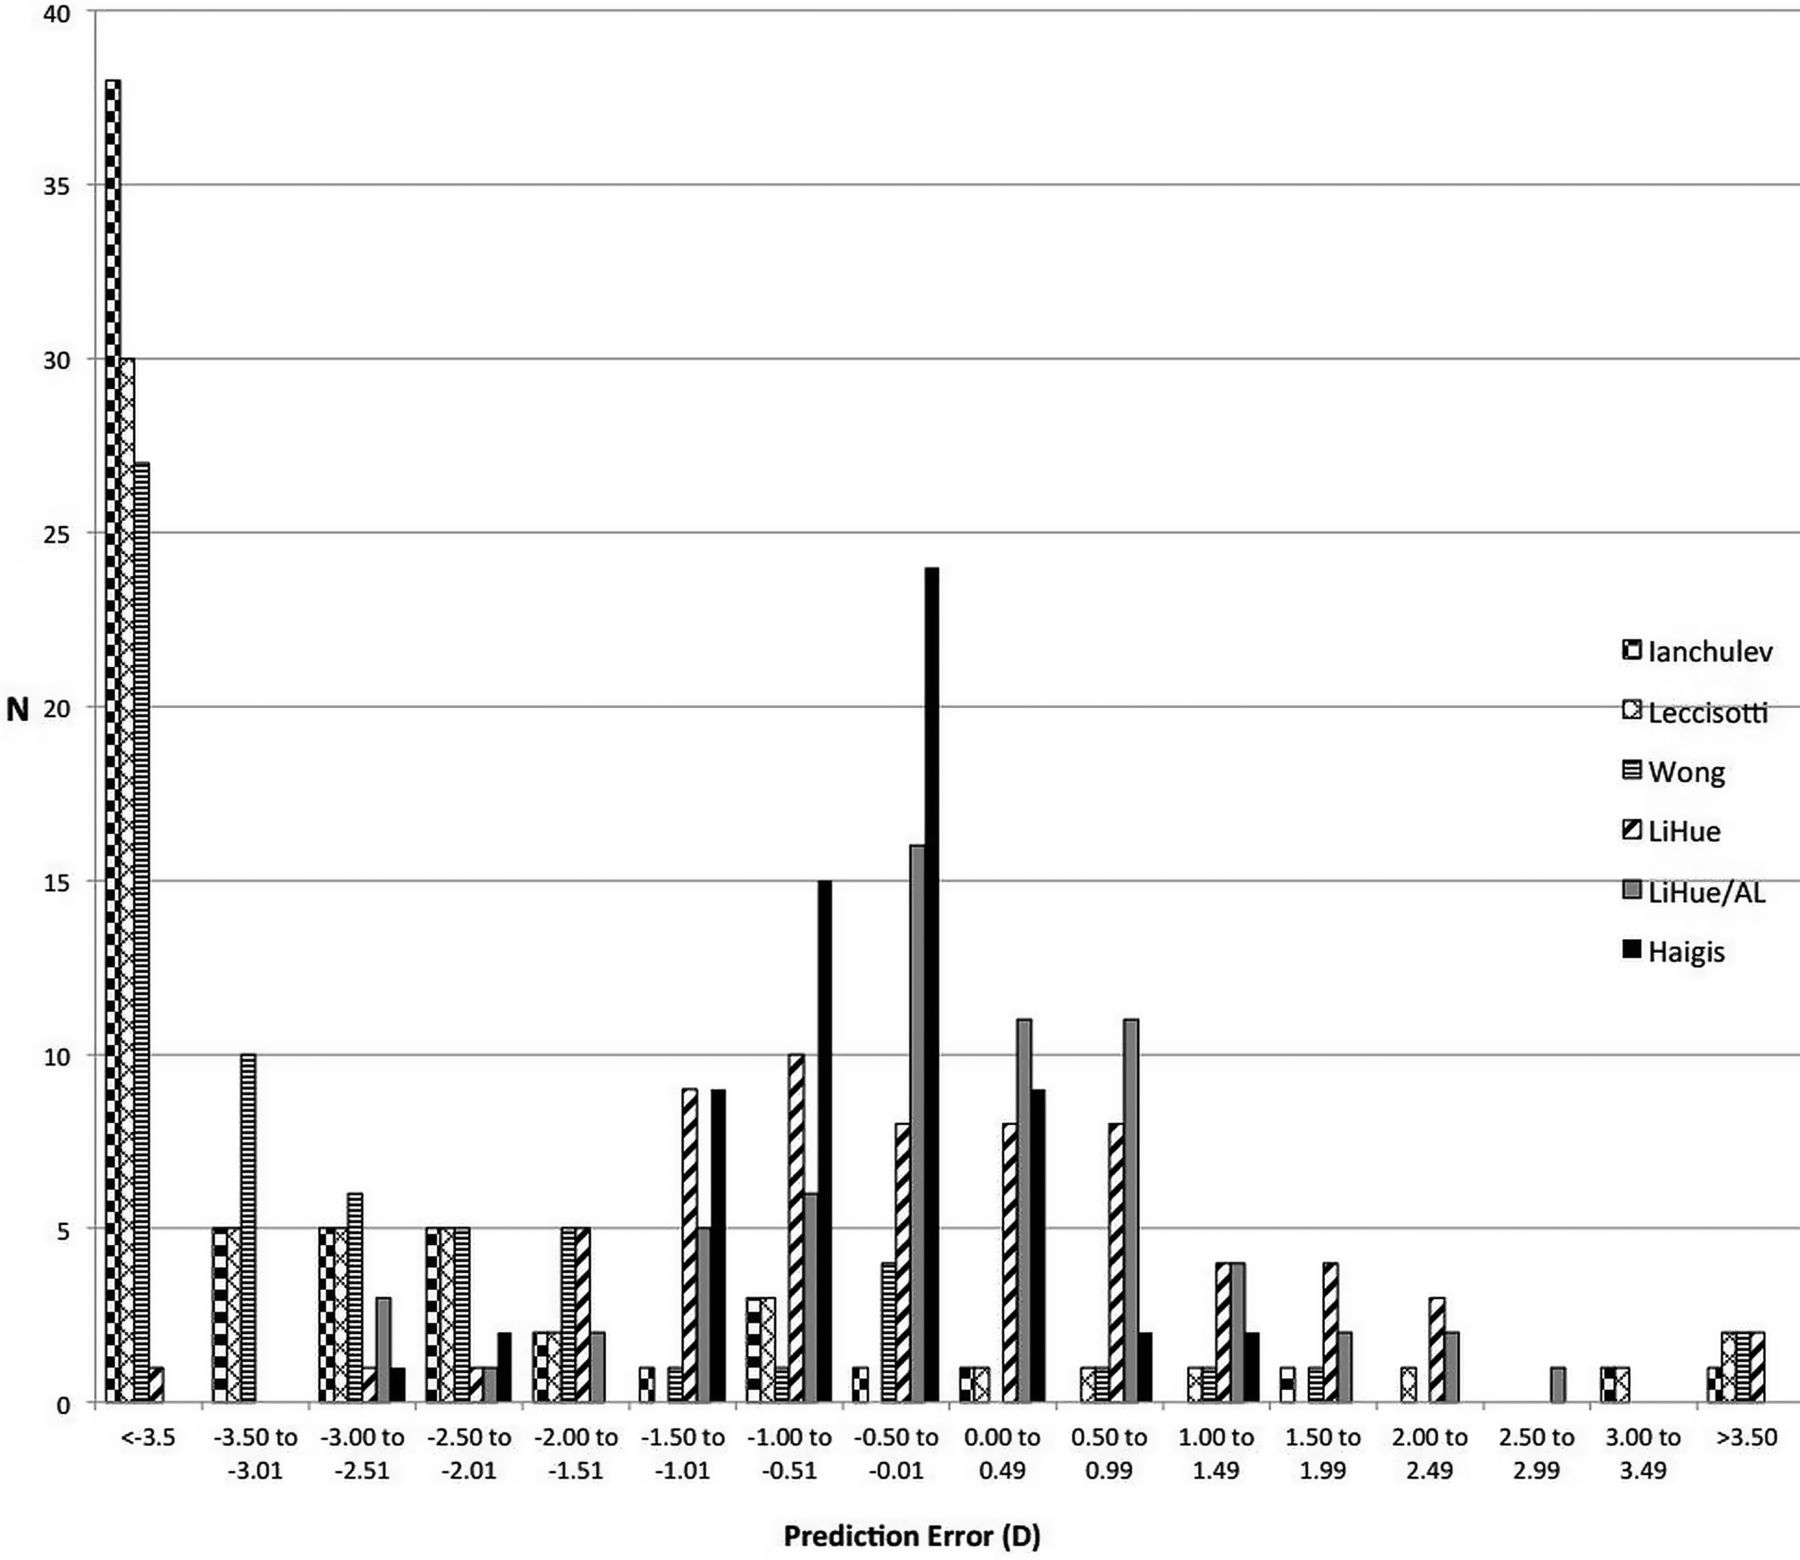
Table 5 presents how IOL calculation by IWA would have improved/worsened the refractive outcome. It also shows how accurately astigmatic measurements by IWA predicted the result at 3 months postoperatively. Furthermore, mean and median prediction errors and within target ratios for the three published aphakia formulae by Ianchulev,7 Leccisotti8 and Wong9 (computed with our dataset) as compared with our newly derived aberrometry-based formulae and with conventional biometry with the Haigis formula10 are described. The distribution of the prediction errors is illustrated in figure 4.
Distribution of the prediction errors using five different intraocular lens power aphakia-based calculation formulae. N=64.
Discussion
This prospective study evaluates the utility of Hartmann–Shack IWA during cataract surgery. It also proposes two new aberrometry-derived intraoperative formulae to calculate IOL power.
Quality of IWA
IWA measurements during and directly after cataract surgery can be problematic. In a previous case series of 10 eyes 1 h after cataract surgery, measurement success was as low as 25%.14 Similarly, we were successful in all three attempted measurements during aphakia in only 30 out of 64 eyes. The limits of agreement for those were as wide as +0.66 D and −0.69 D (figure 1). Therefore, selecting an IOL based on these measurements would be problematic.
In an attempt to understand these trends, we examined the impact of certain variables in three ways. First, ORs showed that no variable had a statistically significant impact on measurement success (table 3). Second, ANOVA failed to detect explanatory variables for measurement variability such as refractive state, CDVA or age (table 2). Third, we identified that higher IWA map quality (defined as percentage of map integrity) significantly correlated with lower mean measurement differences of SE (p<0.05, figure 2). Hence, future aberrometers could have an integrated quality measure, for example, based on IWA map quality. A limitation of our study is whether IWA map area is a reliable surrogate parameter for measurement quality and further research should seek to explore in detail a connection between these two parameters.
Status of intraoperative biometry
To date, intraoperative biometry has been limited to autorefractive retinoscopy with handheld instruments. Although the developers of the ORA Talbot–Moiré interferometry intraoperative device (WaveTec Vision, USA) claim excellent refractive outcomes,3 ,6 no data on the intraoperative formulae, measurement failure and reproducibility have been reported or independently validated. Furthermore, Ianchulev et al used pooled results from 66 different investigators, including fellow eyes and a range of differing IOL designs, which makes analysis and generalisation very difficult.3 By contrast, strengths of our study are that only one observer took the intraoperative measurements and that only one IOL design was used. Given that Talbot–Moiré interferometry is a relatively new method compared with the established Hartman–Shack aberrometry, a randomised prospective trial comparing both methods would be of great interest.
To explore how reliable IOL calculations could be performed with IWA, we derived two formulae to predict the emmetropic IOL based on the aphakic SE. Predictive accuracy was found to significantly improve when an AL term was incorporated into the equation (table 5, figure 4). However, when compared with results of conventional preoperative biometry, both the LiHue and LiHue/AL formulae resulted in a worse refractive outcome in 70.3% and 65.6% of the cases, respectively (table 5).
When comparing the refractive outcomes derived from our newly described formulae to those computed with the three previously published aphakia formulae, the latter performed significantly worse (table 5). Figure 4 shows that this is mainly due to a marked overestimation of IOL power (most prominent with the Ianchulev formula), which would leave the patients more myopic than intended. The authors of those aphakia formulae report considerably higher within-target ratios with their own datasets.7–9 This is to be expected since regression formulae always best describe the data they were derived from.15 Still, the marked difference highlights the known limitations of regression formulae with their sensitivity to differing clinical settings, surgical techniques, effective lens position and especially biometric devices (in this case: handheld autorefractive retinoscopy vs IWA).15
Challenges for intraoperative aberrometry
We suggest that seven factors may impair the precision and quality of the IWA measurements. First, during surgery, the patient is in a supine position. In our previous study13 changing the posture from seated to supine led to cyclotorsion and apparently also to a myopic SE shift. Second, the lid speculum may be responsible for significant changes in cylinder power and axis depending on how much the patient squeezed.14 Third, varying corneal wound integrity and hydration may lead to an altered corneal curvature, resulting in significant changes of refraction. Fourth, hydration of the vitreous could also lead to altered optical media. Fifth, when the surgery is performed under topical anaesthesia, eye movements are a source of error, and so eye tracking would be highly desirable. Sixth, the refractive index difference between OVDs and aqueous humour as well as the measurement wavelength may have an effect on the results.16 In our study, the same OVD was used in all cases. Seventh and most importantly, the intraoperative state is not physiological. Hence, AC depth and IOP may show great variations, leading to significant alterations of the refractive state of the eye. We found in an earlier study that higher measurement quality scores were achieved when the AC was filled with OVD as compared with balanced salt solution.13
We would expect that some of these variables could be controlled by intraoperative optical coherence tomography measurements of AC depth and real-time monitoring of IOP.17 In our study we attempted to make sure the IOP was normal on palpation before each reading was taken, although this is a subjective and imprecise method.
Options of intraoperative aberrometry
Before IWA can be used to guide intraoperative biometry planning,18 further studies are needed and more efforts are required to enhance the measurement precision and quality of IWA, especially when using multifocal or toric IOLs.
To judge the success of an objective method of refraction, a ‘gold standard’ for comparison is required, which, to date, does not exist for intraoperative refraction.19 Difficulties arise when comparing manifest refraction (especially when carried out by different observers),20 autorefraction and aberrometry-based refraction with each other, for example, by different reference planes.21 ,22 Therefore, we compensated for that by taking back vertex distance into account when we inserted our data into the other aphakia formulae. An additional challenge to all of these methods is to guarantee a constant distance between the cornea and the device during measurements, especially with higher dioptric values as encountered during aphakia.
In conclusion, IWA seems feasible without disturbing the surgical workflow, but more efforts are required to improve the precision and quality of measurements before it can reliably and consistently guide the surgical refractive plan during cataract surgery. Further studies are needed to compare different methods of intraoperative refraction with each other and to evaluate how IWA could be optimised for accurate and reliable IOL calculation.
Acknowledgments
We are grateful to Kieran Loft, BSc (Hons) MCOptom, for his revision of the manuscript and to Jan Dräger and Milena Pahlitzsch for data collection.
References
Footnotes
J. O. Huelle presented parts of this study to the XXXII Congress of the ESCRS, September 2014, London, UK.
Contributors Conceived the study's questions: SJL, GR, TK and JOH. Developed the manuscript: JOH, SJL, TK and VD. Coordinated manuscript development and completed first draft of the manuscript: JOH. Edited the manuscript: SJL, VD, NH and JOH. Performed part of writing or editing of the manuscript: SJL, VD and NH. Made an intellectual contribution to the manuscript: GR, TK and NEH. Calculated statistics: VD and JOH. Advised on the manuscript: SJL, TK and NH. Approved final version of the manuscript prior to submission: SJL, GR, JOH, VD and NH. Guarantor: GR.
Competing interests None declared.
Ethics approval Hamburg Ethical Committee.
Provenance and peer review Not commissioned; externally peer reviewed.
Data sharing statement The authors have full control of all primary data and agree to allow BJO to review the data upon request.
Linked Articles
- At a glance