Article Text

Abstract
Background/aims Patients with rhegmatogenous retinal detachment (RRD) who develop postoperative proliferative vitreoretinopathy (PVR) have been found to have higher preoperative laser flare values than patients with RRD who do not develop this complication. Measurement of laser flare has therefore been proposed as an objective, rapid and non-invasive method for identifying high-risk patients. The purpose of our study was to validate the use of preoperative flare values as a predictor of PVR risk in two additional patient cohorts, and to confirm the sensitivity and specificity of this method for identifying high-risk patients.
Methods We combined data from two independent prospective studies: centre 1 (120 patients) and centre 2 (194 patients). Preoperative aqueous humour flare was measured with a Kowa FM-500 Laser Flare Meter. PVR was defined as redetachment due to the formation of traction membranes that required reoperation within 6 months of initial surgery. Logistic regression and receiver operating characteristic analysis determined whether higher preoperative flare values were associated with an increased risk of postoperative PVR.
Results PVR redetachment developed in 21/314 patients (6.7%). Median flare values differed significantly between centres, therefore analyses were done separately. Logistic regression showed a small but statistically significant increase in odds with increasing flare only for centre 2 (OR 1.014; p=0.005). Areas under the receiver operating characteristic showed low sensitivity and specificity: centre 1, 0.634 (95% CI 0.440 to 0.829) and centre 2, 0.731 (95% CI 0.598 to 0.865).
Conclusions Preoperative laser flare measurements are inaccurate in discriminating between those patients with RRD at high and low risk of developing PVR.
- Retina
- Aqueous humour
- Vitreous
- Treatment Surgery
Statistics from Altmetric.com
Introduction
Rhegmatogenous retinal detachment (RRD) is a common eye condition whose prevalence increases with age. While surgical repair is effective in most cases, in 5%–10% of patients, reattachment is complicated by the formation of epiretinal and/or subretinal contracting membranes.1 This complication is called proliferative vitreoretinopathy (PVR) and often leads to recurrent detachments and a poor prognosis in terms of regaining vision.
While pharmaceutical drug therapies have been proposed for PVR—including anti-inflammatory drugs, antiproliferative drugs and heparin—all these drugs have potential side effects.2–7 Therefore, to optimise the benefit/risk ratio of drug therapies, it is crucial to select only those patients at high risk of developing PVR.
Several risk prediction models have been proposed to help identify these high-risk patients. These models are based on clinical characteristics such as aphakia, vitreous haemorrhage, preoperative PVR, extent and duration of detachment and high vitreous levels of protein.8–10 Also the presence of certain gene polymorphisms has been shown to be associated with a higher risk of PVR.11 However, validation studies have shown the models to have a low sensitivity, specificity and positive predictive value, making them unsuitable for supporting treatment decisions.12
A different potential predictor for PVR development was found by Schroder et al.13 They found preoperative anterior chamber flare—caused by reflection of laser light by proteins in aqueous humour—to be a strong predictor for PVR development. Patients with a preoperative flare value higher than 15 photon count per millisecond (pc/ms), measured objectively with a laser flare metre, had a 16-fold higher risk of developing PVR.13
Based on these findings, measurement of laser flare would provide an objective, rapid and non-invasive method for identifying high-risk patients. The purpose of our study was therefore to validate the use of preoperative laser flare values as a predictor of PVR risk in two additional patient cohorts from Germany and the Netherlands, and to confirm the sensitivity and specificity of this method for identifying high-risk patients.
Methods
The University of Kiel in Germany (centre 1) and the Rotterdam Eye Hospital in The Netherlands (centre 2) both conducted a prospective study on the predictive value of preoperative aqueous humour flare values on the development of PVR. As both studies were set up independent from each other, study protocols differed slightly.
In centre 1, 138 patients with a primary RRD were included in the study between April 2012 and June 2015. From January 2014 until October 2014, 208 patients with a primary RRD were included in centre 2. Patients with additional ocular pathologies such as active uveitis, active vasculitis, retinal vein occlusion, diabetic macular oedema, proliferative diabetic retinopathy, exudative age-related macular degeneration and primary PVR grade C or higher, were excluded. Approval was obtained from the research ethics committee and institutional review board. All patients gave written informed consent.
We measured aqueous flare in the anterior chamber with a Kowa FM-500 Laser Flare Meter (Kowa Company, Japan) preoperatively in both eyes. In centre 1, we made 10 measurements per eye in the morning prior to surgery in an undilated eye and recorded the mean. In centre 2, we made seven measurements for each eye and discarded the highest and the lowest value, leaving the average and SD of five measurements. The measurement of the study eye was made 15 min after instillation of a drop of 0.5% tropicamide, while the fellow eye remained undilated.
We recorded the lens status, visual acuity, type of surgery, number of retinal tears, the extent of retinal detachment, the presence of rolled over edges and medication history.
Standard treatment after surgery in centre 1 consisted of the administration of dexamethasone and gentamicin eye drops (Dexamytrex) five times daily, which was reduced during 6 weeks. In centre 2, therapy consisted of the administration of prednisolone acetate eye drops (Pred Forte) four times daily, which was reduced during 4 weeks. Deviations from this protocol were also recorded.
Clinically relevant PVR was defined as reoperation for redetachment due to PVR membranes, within 6 months of initial surgery. This information was extracted from the patients file or when not conclusive by contacting the patient or his/her referring ophthalmologist.
Analysis
We compared patient characteristics for the two centres using an independent samples t-test and χ2 tests. To compare the flare values, an independent-Samples Kruskal-Wallis test and Mann-Whitney U-test were used. We performed logistic regression to see to what extent a higher preoperative flare value increased the risk of postoperative PVR development. Receiver operating characteristic (ROC) analysis was used to test the sensitivity and specificity of preoperative flare values in discriminating between PVR and no PVR development. The Wilcoxon signed-rank test for related samples was used to compare flare values in undilated versus dilated eyes and with versus without fluorescein administration. Statistical analyses were performed with IBM SPSS statistics V.21.
Results
We recruited a total of 346 patients at the two centres, but we excluded 32 of them from the analysis for various reasons. For details, see figure 1. The characteristics of the remaining 314 patients are tabulated in table 1. The two patient populations were comparable and differed only in the type of surgery patients received and in the number of patients who presented with their macula still attached. Out of 314 patients, 46 patients needed additional surgery within 6 months. We diagnosed only 21 of these patients with a redetachment due to epiretinal membranes or subretinal strands associated with PVR. Six patients had a persistent detachment (resurgery within 1 week) due to a missed or insufficiently closed break and the remaining patients had redetachments caused by new breaks, not completely closed old breaks, a macular hole or giant tear, without any signs of traction due to epiretinal membranes or subretinal strands.
Patient characteristics
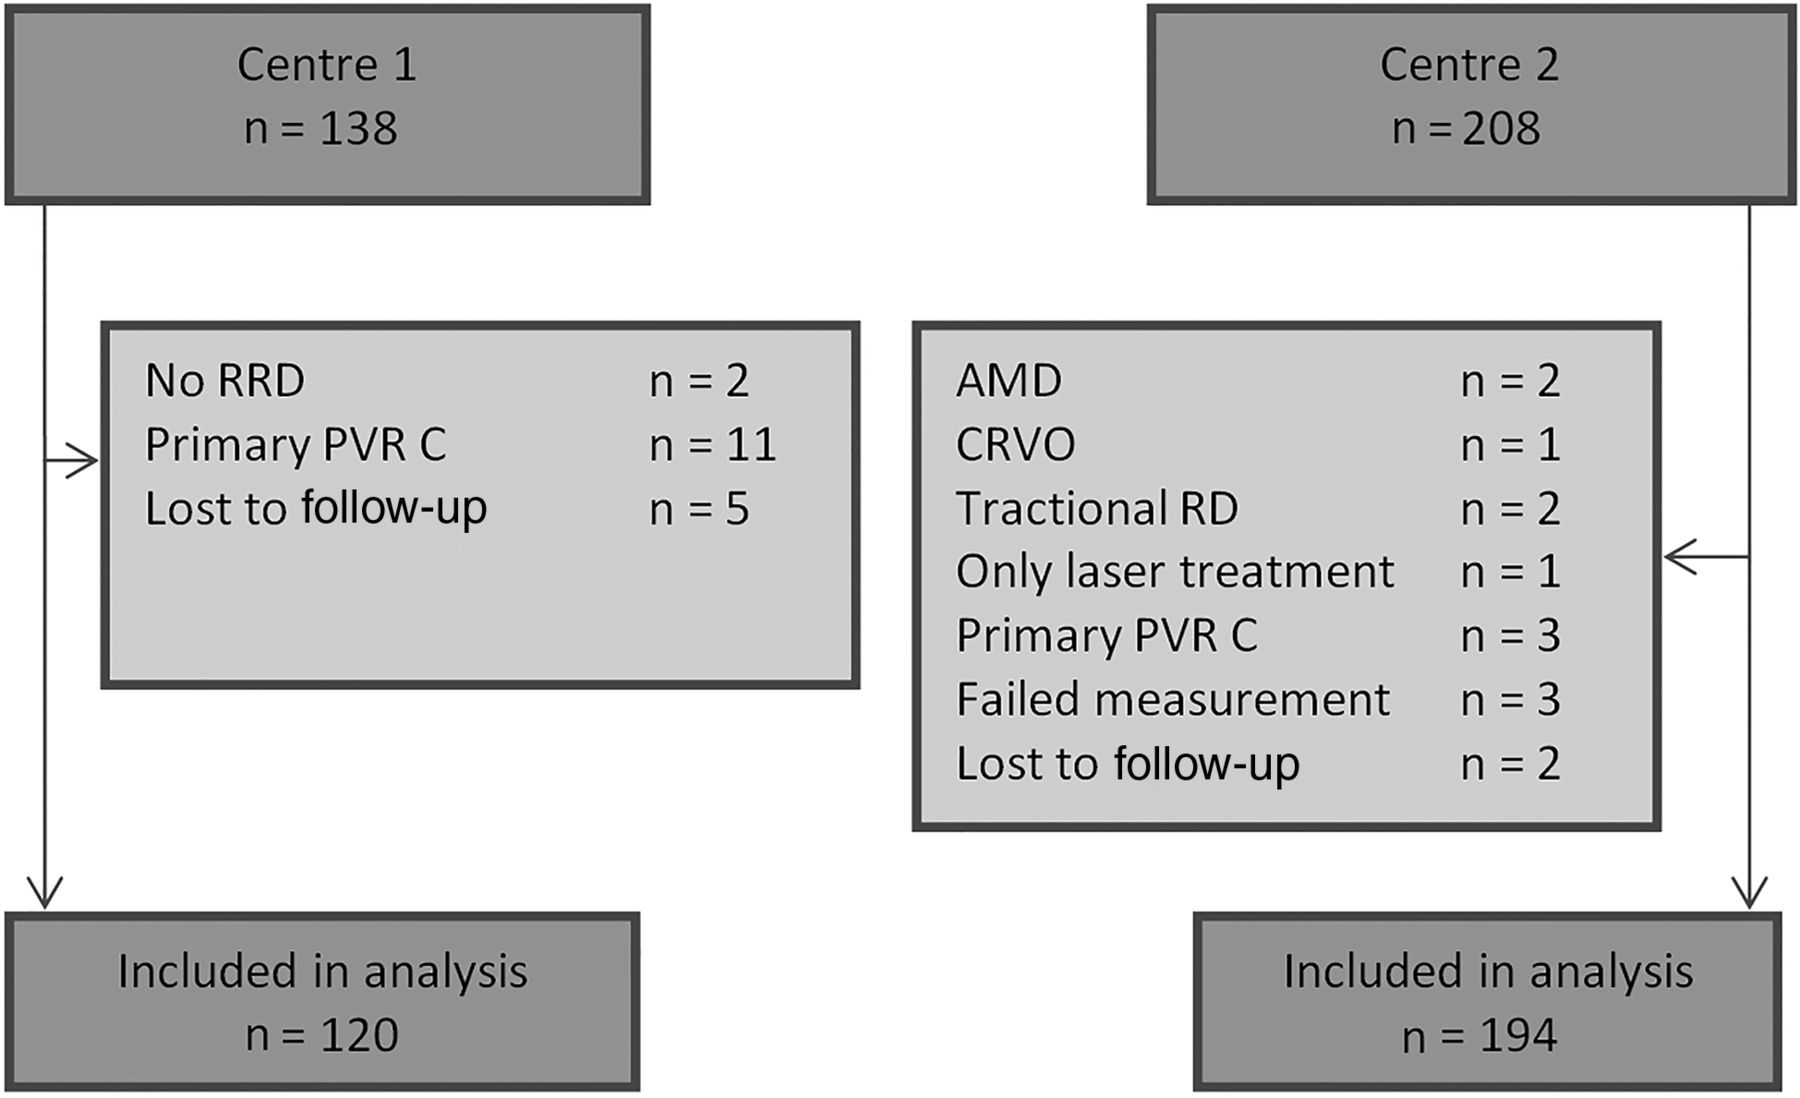
Flowchart of patient selection. PVR C, proliferative vitreoretinopathy grade C; rhegmatogenous retinal detachment, RRD.
Preoperative flare values
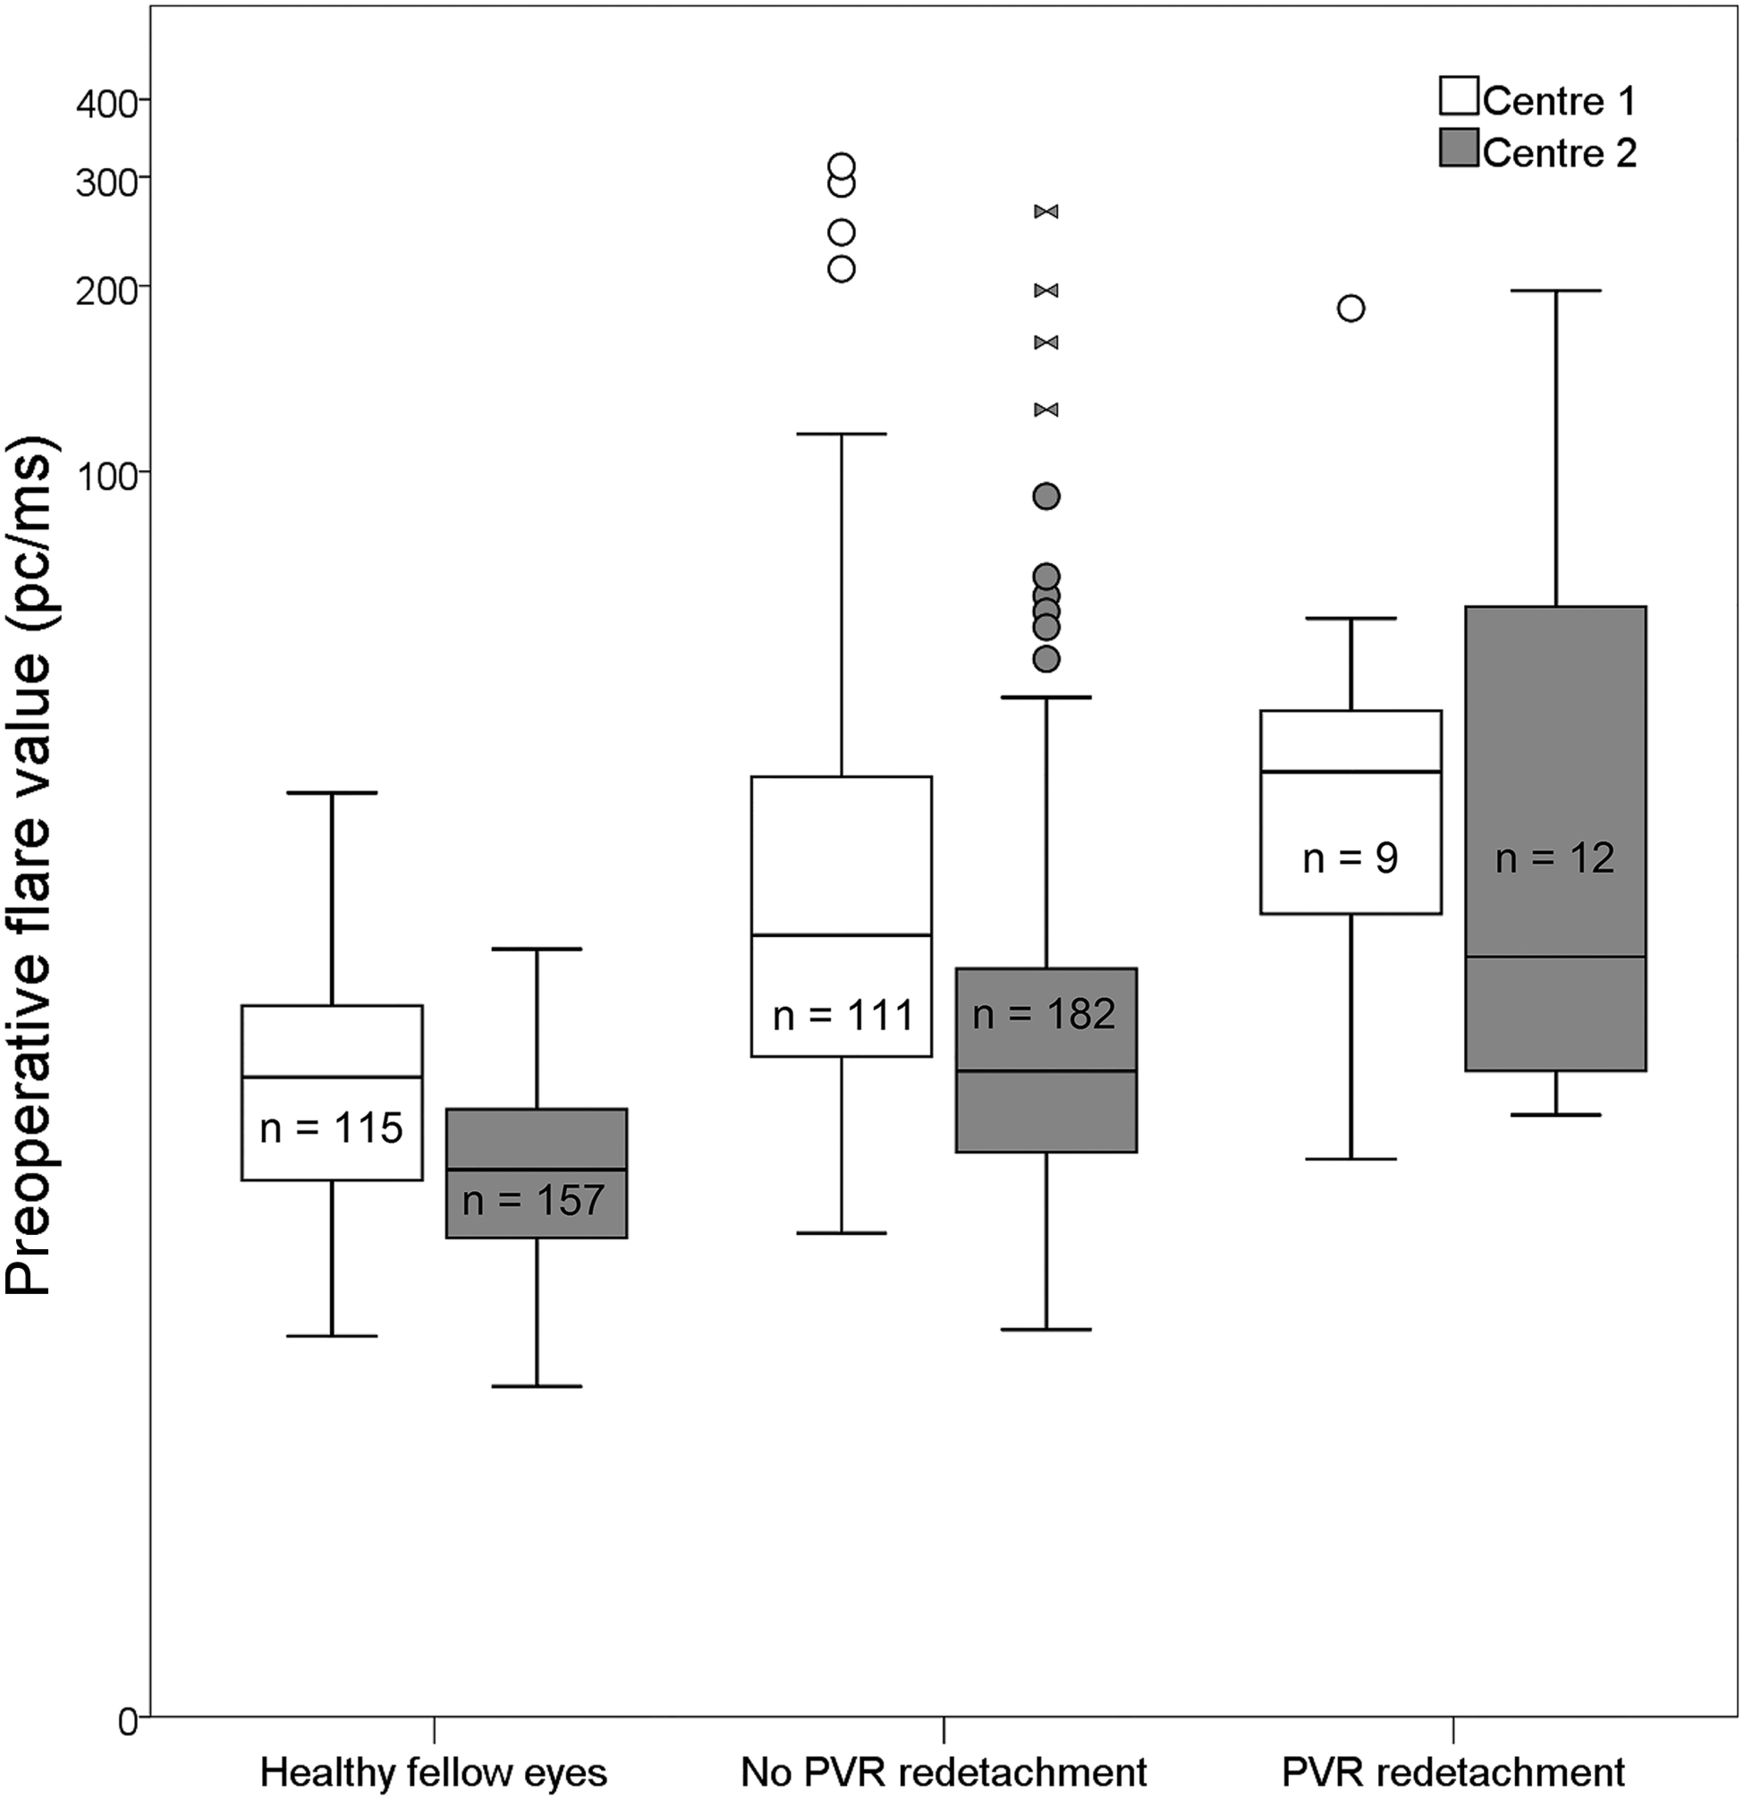
The flare values measured in centre 1 were significantly and systematically higher than in centre 2. We therefore decided to perform logistic regression and ROC analysis for each centre separately. Table 2 shows these median preoperative flare values per centre and the results of the Mann-Whitney U test for the whole patient group and for the different subgroups. Flare values are expressed in pc/ms. Figure 2 shows the distribution of flare values and their median for the different centres and groups.
Median flare values (pc/ms) in subgroups and healthy fellow eyes
Boxplot showing the distribution of flare values on a logarithmic scale for healthy fellow eyes, patients with no proliferative vitreoretinopathy (PVR) (including patients with redetachments due to other reasons) and patients with PVR.
For each centre, an independent-samples Kruskal-Wallis test was performed to compare preoperative flare values of healthy fellow eyes, eyes with no PVR redetachment and eyes with PVR redetachment. For both centres, significance was demonstrated (p<0.0001). Post hoc analysis per centre involved pairwise comparisons among the three groups. Statistically significant differences were demonstrated for all comparisons, except for the comparison between patients with and without PVR redetachment in centre 1 (adjusted significance p=0.843).
Preoperative flare values and PVR redetachment risk
The individual logistic regression showed a significant result only for centre 2. An increase of 1 pc/ms of the preoperative flare value increased the odds of PVR redetachment by 1.014 (see table 3). An increase of 10 pc/ms increased the odds by 1.15. When we combined the data from the two centres and controlled for research centre, we found a smaller OR of 1.008. The correct prediction of PVR cases or the correct classification of patients in general did not improve by including preoperative flare. In addition, we tested whether a higher preoperative flare value was a predictor for any redetachment (with or without signs of PVR), this analysis also showed a significant result only for centre 2 and the combined data (see table 3).
Results from logistic regression analyses for redetachment risk
Sensitivity and specificity
The area under the ROC curve for centre 1 was 0.634 (95% CI 0.440 to 0.829). At a cut-off value of 10 pc/ms, the accompanying sensitivity and specificity were 89% and 22%. A higher cut-off value of 15 pc/ms showed higher specificity (37%) and somewhat lower sensitivity (78%). For centre 2, the area under the ROC curve was higher (0.731; 95% CI 0.598 to 0.865). The cut-off values of 10 and 15 pc/ms showed a sensitivity and specificity of 75% and 50% and 50% and 76%.
The probability that a patient with a preoperative flare value above 15 pc/ms would develop a PVR redetachment (positive predictive value) was 9% and 12% for centre 1 and 2, respectively, based on the observed prevalence in these centres.
Influence of dilating eye drops on the flare value
As flare values were systematically higher in centre 1 compared with centre 2, we performed additional analyses in an attempt to explain these differences.
First, we compared 27 study patients from centre 1 in whom measurements were performed in both eyes during the study in undilated and dilated state 30 min apart. The Wilcoxon signed-rank test for related samples revealed a significantly lower flare value in the dilated state (Oculus dexter (right eye) p=0.002; Oculus sinister (left eye) p<0.0001). The median differences were −2.3 pc/ms (IQR: −4.3 to −0.3) and −2.7 pc/ms (IQR: −4.1 to −0.6).
Second, we compared 147 healthy fellow eyes from study patients in centre 2. Fellow eyes were measured in undilated and dilated state at two different standard visits, 6 weeks apart. Also here we found a significantly lower value in the dilated state (p<0.0001). The median difference was −0.6 pc/ms (IQR: −2.4 to 0.4), less than the values found in centre 1.
Influence of fluorescein
To test the possible influence of fluorescein on the height of the flare value, we measured 10 healthy volunteers with undilated pupils. Next, we used a fluorescein strip and oxybuprocaine 0.4% to instil fluorescein in the eye. After an hour, we measured flare again. The related samples Wilcoxon signed-rank test showed no significant difference (p=0.359).
Discussion
The results of our study suggest that preoperative flare values are a poor predictor of postoperative PVR development. Although the logistic regression analysis showed a significant result for one of the two centres (OR 1.014), this did not improve classification of patients into their respective groups (PVR vs no PVR development). In addition, the sensitivity and specificity of preoperative flare at different cut-off values were too low to adequately filter out the high-risk patients. As a consequence, we were unable to validate the findings of Schroder et al,13 although they used the same flare metre type and calibration protocol.
During the analysis of the data, we discovered discrepancies between the two centres. One such discrepancy was a statistically significant difference in median flare values; the median value in patients with no PVR was higher for centre 1 (17.7 pc/ms) than for centre 2 (10.2 pc/ms). Also median flare values of healthy fellow eyes were significantly higher. A comparison of the values with those of previous studies using flare measurement suggests that centre 1 is the one whose values are higher.13–16 Previously reported mean values range from 3.7 to 6.5 pc/ms in healthy individuals and a median of 10 pc/ms in patients with RRD. We therefore decided to analyse the results separately for each centre.
Although the two centres conducted their study independently from each other, the study protocols differed only slightly. When we compared inclusion and exclusion criteria, measurement method and conditions and primary outcome, we found that the centres had similar levels of background lighting, both used the same Kowa Laser Flare Meter type and calibrated it monthly. There were however two apparent differences.
The first difference was the number of measurements made per eye. Centre 1 used the mean of 10 measurements per eye, excluding any measurements deviating more than two SDs from this mean. Centre 2 made seven measurements and excluded the highest and the lowest value, leaving a mean of five measurements. However, we do not expect this difference to add to the large difference in median flare values that we observed.
The second difference was that while centre 2 used dilating eye drops, centre 1 did not. From the literature, it is known that dilating eye drops reduce flare during the first 1–2 hours after instillation.17–19 The mechanism is not completely understood, but it seems to be a pharmacological effect rather than a reduction of background noise by a larger pupil size.20 Tropicamide was reported to decrease the flare value by approximately 10%–30% in healthy eyes.19 ,20 To determine whether this was likely to have had a major influence on our flare results, we did two additional analyses. Both analyses showed a significant lower flare value in dilated state, but the absolute median difference was less than 3 pc/ms in centre 1 and 0.6 pc/ms in centre 2. Although the use of dilating eye drops does not explain the entire difference found between the two centres, it might have contributed significantly.
What stood out in both centres was the large range of values and a large number of outliers (3.2–312 pc/ms). This large number of outliers in the no PVR group versus the low number of PVR cases makes a distinction between these groups difficult. Possibly the variation in values is more dependent on the time point at which flare is measured, rather than on a difference in PVR status. When patients present at the emergency department, they are subjected to various examinations that require the use of multiple eye drops and undergo various manipulations of the eye. Manipulations such as gonioscopy and scleral indentation might cause an inflammatory reaction leading to a rise in flare. In centre 1, examination with scleral indentation was often performed 1 day before the flare measurements. In contrast, centre 2 did not routinely perform scleral indentation at admission. This might be another reason explaining the higher flare values in centre 1. However, we did not find any literature on this topic and this explanation remains speculative.
Another possibility might be that the presence of fluorescein in the anterior chamber might increase flare. We therefore tested this by measuring flare before and after the administration of fluorescein in 10 volunteers, but we could not detect a significant difference (p=0.359). As the intensity of scattered light is proportional to particle diameter and fluorescein is approximately 200 times smaller in weight than albumin, the influence of the small concentration fluorescein on the flare value is likely to be negligible compared with the influence of proteins.
In conclusion, the wide variation and overlap in flare values between patients with and without PVR implicate that the measurement of aqueous humour flare with a Kowa Laser Flare Meter is inaccurate in discriminating between those patients with RRD at high and low risk of developing PVR. It should be further explored whether the addition of aqueous flare as a parameter to existing risk formulae would increase their predictive value.
Acknowledgments
We thank Ida van Meurs, Annemiek Krijnen and Vera-Christina Wulff for their help with the flare measurements. We also thank Frank Verbraak, MD, for lending us a Kowa Laser Flare Meter and Ellen la Heij, MD, for her input on the manuscript.
References
Footnotes
Contributors The conception or design of the work: VCM, EHCvD, JR, JCvM and FT. Data acquisition: VCM, JT, EHCvD, KP, FT, Ida van Meurs, Annemiek Krijnen and Vera-Christina Wulff. Analysis and interpretation of data: VCM, JT, JR, JCvM and FT. Drafting the work: VCM. Revising the work: JT, EHCvD, KP, JR, JCvM, FT and Ellen la Heij. Final approval of the version published: VCM, JT, EHCvD, KP, JR, JCvM and FT. Agreement to be accountable for all aspects of the work: VCM, JT, EHCvD, KP, JR, JCvM and FT. Support: Frank Verbraak (Lender Flare Meter).
Funding This research was supported by Combined Ophthalmic Research Rotterdam (CORR Project code: 3.1.0).
Competing interests None declared.
Ethics approval Ethics Committee and Institutional Review Board.
Provenance and peer review Not commissioned; externally peer reviewed.
Linked Articles
- At a glance