Article Text

Abstract
Aims To estimate disease progression based on analysis of macular volume measured by spectral-domain optical coherence tomography (SD-OCT) in patients affected by Stargardt macular dystrophy (STGD1) and to evaluate the influence of software errors on these measurements.
Methods 58 eyes of 29 STGD1 patients were included. Numbers and types of algorithm errors were recorded and manually corrected. In a subgroup of 36 eyes of 18 patients with at least two examinations over time, total macular volume (TMV) and volumes of all nine Early Treatment of Diabetic Retinopathy Study (ETDRS) subfields were obtained. Random effects models were used to estimate the rate of change per year for the population, and empirical Bayes slopes were used to estimate yearly decline in TMV for individual eyes.
Results 6958 single B-scans from 190 macular cube scans were analysed. 2360 (33.9%) showed algorithm errors. Mean observation period for follow-up data was 15 months (range 3–40). The median (IQR) change in TMV using the empirical Bayes estimates for the individual eyes was −0.103 (−0.145, −0.059) mm3 per year. The mean (±SD) TMV was 6.321±1.000 mm3 at baseline, and rate of decline was −0.118 mm3 per year (p=0.003). Yearly mean volume change was −0.004 mm3 in the central subfield (mean baseline=0.128 mm3), −0.032 mm3 in the inner (mean baseline=1.484 mm3) and −0.079 mm3 in the outer ETDRS subfields (mean baseline=5.206 mm3).
Conclusions SD-OCT measurements allow monitoring the decline in retinal volume in STGD1; however, they require significant manual correction of software errors.
- Retina
- Dystrophy
- Macula
- Imaging
This is an Open Access article distributed in accordance with the Creative Commons Attribution Non Commercial (CC BY-NC 4.0) license, which permits others to distribute, remix, adapt, build upon this work non-commercially, and license their derivative works on different terms, provided the original work is properly cited and the use is non-commercial. See: http://creativecommons.org/licenses/by-nc/4.0/
Statistics from Altmetric.com
Introduction
Stargardt macular dystrophy (STGD1) is a predominantly autosomal-recessive inherited retinal disorder due to pathogenic mutations in the ABCA4 gene.1 STGD1 is the most common cause of juvenile macular degeneration (estimated prevalence 10–12.5 per 100 000) and typically shows progressive impairment of visual acuity, which begins most frequently within the first or second decades of life.2 The loss of acuity is accompanied by atrophic-appearing lesions within the macula and the presence of yellow-white lesions at the level of the retinal pigment epithelium (RPE), which are referred to as ‘fundus flecks’ caused by excess accumulation of lipofuscin in the RPE.3 It is characterised by a degeneration of photoreceptors that occurs as a result of the formation of toxic bisretinoids in photoreceptor outer segments or secondarily following loss of the RPE due to lipofuscin (bisretinoid) accumulation.3
So far, there is no therapy for this disease. However, different therapeutic approaches are in the early clinical phase including stem cell therapy,4 gene therapy (ClinicalTrials.gov identifier NCT01736592, NCT01367444) and medical therapy that markedly slow the formation of toxic components (ClinicalTrials.gov identifier NCT02402660). Any new therapeutic option must be compared with the natural course of a disease, and for surrogate measures, the US Food and Drug Administration states that “validated surrogate markers are those for which evidence has been established that a drug-induced effect on the surrogate predicts the desired effect on the clinical outcome of interest”.5
Remarkable progress has been made in high-resolution imaging of the retina using new technologies such as spectral-domain optical coherence tomography (SD-OCT).6 Using SD-OCT, visualisation of intraretinal architectural morphology has been achieved that previously had been possible only with histopathology7 and which may serve as possible clinical outcome measures. Furthermore, SD-OCT imaging does not only qualitatively reveal the structural changes that occur in macular diseases, but also provides quantitative measurements of the means of retinal thickness and volume.7 Indeed, inclusion criteria for clinical trials and retreatment protocols in trials of intravitreal agents for macular disease like diabetic macular oedema often incorporate a quantitative OCT parameter based on the nine Early Treatment of Diabetic Retinopathy Study (ETDRS) subfield grid.8 ,9 Furthermore, the concept of measuring SD-OCT-derived retinal measures, such as peripapillary retinal nerve fibre layer thickness and total macular volume (TMV), have been proposed as outcome measures in remyelinating and neuroprotective trials in multiple sclerosis.10
The Spectralis OCT (Heidelberg Engineering, Heidelberg, Germany) offers the opportunity to follow changes longitudinally by using a system that features two different options: an eye tracker that can compensate for eye movements during scanning procedure and can improve reproducibility of the measurements made, and a retest function that ensures that follow-up measurements are performed at the same retinal locus as baseline examination.11 However, image errors still occur in the majority of SD-OCT scans in different macular diseases despite various advances of the SD-OCT technology compared with the former time-domain OCT, such as improved image quality, faster image acquisition and increased sensitivity of SD-OCT.9 We hypothesised that with manual correction of such errors macular volume may be an efficient method to detect retinal atrophy. Therefore, the purpose of this study was to estimate disease progression based on analysis of macular volume measured by Spectralis SD-OCT in patients affected by STGD1 in individual clinics and to evaluate the susceptibility of the Spectralis OCT to errors.
Patients and methods
Diagnosis of STGD1 was based on all of the following criteria:12–14 (1) fundus flecks at the level of the RPE typical for STGD1, (2) RPE changes and/or bull's eye appearance and/or atrophy of the RPE and (3) a familial history compatible with recessive inheritance pattern. In 14 patients, the diagnosis was molecularly confirmed by genetic testing for pathogenic mutations in the ABCA4 gene by CLIA-certified laboratories through the EyeGene project (ClinicalTrials.gov identifier: NCT00378742). Three patients showed one mutation and 11 patients showed two mutations in the ABCA4 gene (further information is provided in the online supplementary material). Fundoscopic appearance was used for classification according to Fishman et al:15 group 1 was characterised by a central, atrophic-appearing macular lesion with or without flecks; patients of group 2 showed numerous flecks, extending nasally to the optic nerve head and temporal to the vascular arcades; and group 3 was defined by extensive atrophic-appearing RPE changes and partially resorbed flecks.
Inclusion criteria for this study were the diagnosis of STGD1 based on the above-mentioned criteria, clear optical media and presence of at least one Spectralis SD-OCT cube scan per eye. Exclusion criteria were (1) presence of macular diseases other than STGD1, (2) presence of macular oedema, (3) absence of any atrophic alterations of the RPE, (4) opacity of optical media, (5) ungradable images of low quality due low signal strength or uncorrectable errors like motion artefacts or severely degraded images and (6) scans of eyes with atrophic lesions that exceed >80% of the ETDRS grid in the output of the software. Eyes also were excluded if after three attempts of acquisition such errors could not be overcome, for example, due to patient's inability to maintain stable fixation. Baseline characteristics of the patients included age at first examination, gender, race and age at onset of disease. All patients underwent a full clinical examination including testing of best-corrected visual acuity (BCVA) and SD-OCT as part of their routine clinical care. BCVA was measured using Snellen visual acuity charts and were converted into logarithm of the minimum angle of resolution for statistical purposes.
Examinations
Pupils were dilated for SD-OCT using one drop 1% tropicamide and 2.5% neosynephrine. All measurements were taken by one experienced OCT technician (DE) certified for obtaining clinical trial images for reading centres using a Spectralis OCT instrument running HRA2/Spectralis Family Acquisition Module (Heidelberg Engineering). Patients were controlled for correct sitting position, position of the head, focus of the video image and centralisation of the scan area before acquisition was started. Scans were obtained in the high-speed mode with the automated real-time mode activated and set to 5 (creating a mean image of five repeated identical B-scans to improve signal-to-noise ratio). Centred on the fovea, one of three different cube scan protocols, containing a different density of B-scan lines (19, 25 or 49, respectively), was chosen by the discretion of the photographer, covering an area of 20°×20° (for 25 or 49 B-scan lines, respectively) or 20°×15° (for 19 B-scan lines). For stabilisation of fixation, an internal or external fixation light (in case the patient was not able to see the internal one) was used. The first examination was marked as the reference, follow-up examinations as the follow-up, and the same setting and position of the scans were applied. During the last visit, one or both of the other two acquisition protocols were performed in a subgroup of patients in addition to the follow-up examination.
Evaluation of segmentation errors
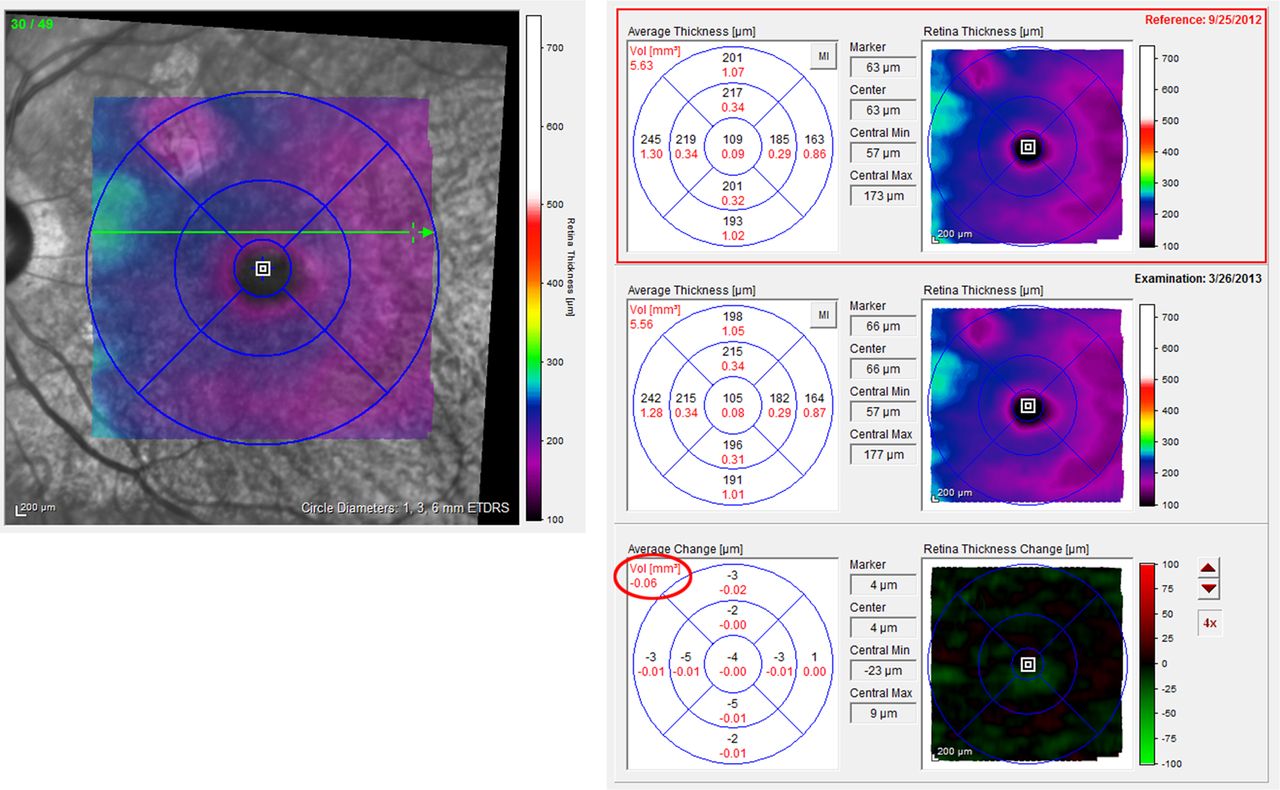
The standard output of the software version (HRA/Spectralis Viewing Module, V.5.3.2.0; Heidelberg Engineering) offers the possibilities to display a false colour topographical as well as a thickness map showing measurements and providing values of retinal thickness and volume calculated for each of the nine macular areas corresponding to the ETDRS subfield grid16: this consists of a central circle (diameter 1 mm) and two surrounding rings: the inner is formed by two circles with diameters of 1 and 3 mm, respectively, and the outer ring of two circles with diameters of 3 and 6 mm, respectively. The inner and outer rings are divided into four equally large areas. The software also allows reviewing each B-scan individually and provides a difference map to compare changes over time (figure 1). The automatically set threshold algorithm sets the anterior line at the inner limiting membrane and the posterior line at the posterior surface of the third hyperreflective line of the retina corresponding to Bruch's membrane according to manufacturer's specifications.17 The total number of B-scans per volume scan was registered and each single B-scan was reviewed by one examiner (RWS) to determine whether the automatically set threshold algorithm lines were set correctly. Errors of the algorithm (figure 2) were recorded, graded and corrected according to previously published criteria.9 ,17 ,18 Details about the frequency of different kind of segmentation errors, the influence of the errors on measurement outcomes and the comparability of different B-scan densities are provided in the online supplementary material. For this purpose, the kind and the horizontal length of each error in each line was registered and an error score was calculated, specifying the accuracy of line segmentation and measurement: sum of error lengths/sum of total lines lengths of each macular cube. The depths of errors affecting the central five subfields were recorded. In a subgroup of 21 patients (42 eyes), the values of retinal volume before and after the correction of segmentation errors were compared. During the last visit, two separate scans were acquired with two different scans densities (25 and 49 B-scans per cube, respectively) in a subgroup of 10 patients (20 eyes). The segmentations errors were corrected and the comparability was assessed in order to determine whether a lower scan density can provide the same information about TMV as this would facilitate the application of using SD-OCT to track retinal atrophy in routine clinical practice.

Example of the standard output of the Spectralis optical coherence tomography (OCT) measurements map using the Early Treatment of Diabetic Retinopathy Study (ETDRS) grid for different follow-up examinations after manual correction of segmentation errors. Left side: confocal scanning laser ophthalmoscope image with scanned area (macular cube in false colour code) is provided. Right side: (from top to bottom) measurements of retinal volume (red numbers) and total macular volume (TMV, red circle) and all nine ETDRS subfields are given for the first examination (reference) and the follow-up examination (middle) including retinal and volume. The differences for these measurements are given in the average change map (bottom). In this example, a decrease in TMV of −0.06 mm3 was observed.

Confocal scanning laser ophthalmoscope image on the left side with the corresponding cross-sectional single B-scan on the right side, as provided by the software. Examples exhibit algorithm errors prior to (A) and after (B) manual correction of these segmentation errors. The example in (A) shows both a misidentification of the inner retina (arrows) and the outer (block arrows) retinal limits, respectively.
Evaluation of progression of retinal atrophy
After correction of all correctible segmentation errors, the values of volume measurements for each of the nine ETDRS subfields as well as TMV of all patients were transferred to a Microsoft Excel (Microsoft, Redmond, Washington, USA) spreadsheet for further analysis (figure 1). Date of examination and image acquisition were noted.
For 36 eyes of 18 patients with images available for at least two separate visits, retinal volumes of all 9 ETDRS subfields as well as TMV were registered for each visit. In case of more than two consecutive visits were available for the patient, each following visit was registered to the former one. Differences between visits were calculated and rate of change per time (loss of retinal volume per year) estimated. These changes were also calculated for the inner circle (mean retinal volume of the inner four subfields) and outer circle (mean retinal volume of the outer four subfields). Furthermore, progression rates of loss of TMV were also estimated for subgroups of patients with confirmed mutations in the ABCA4 gene and for subgroup of patients after classified according to Fishman et al15 (see online supplementary material). To estimate the coefficient of repeatability (CR), the scan procedure and the measurements of macular volume were repeated during the last visit (using the eye-tracker option and ‘follow-up’ mode) in 20 eyes of 10 patients with follow-up data after manual correction of algorithm errors in all B-scans. The CR is the value below which the absolute differences between two measurements would lie with 0.95 probability. It was calculated as 2.77 times the within eyes SD.19
Statistical analysis
Linear mixed models, with time as the independent variable, were used to estimate the yearly change for each outcome. The models include random effects for the intercept, the slope for time and the eye. This modelling approach incorporates not only the statistical dependencies of within-individuals’ repeated assessments over time but also the between eyes expected correlation. Specifically, the outcome at time t on the jth eye of the Ith individual was modelled as Yijt=α+β×t+ai+bi×t+cj+eijt where (ai, bi) followed a bivariate normal with zero means, cj followed a normal distribution with zero mean and variance corresponding to the between eyes variability and the eijt are the within-individuals’ departures of the observed data from the individuals’ lines. For individual eyes, empirical Bayes slopes were calculated to estimate yearly decline in TMV and volumes in each of the ETDRS subfields. The results of the random effects model were used in order to achieve a weighted average of the empirical slope based on individual data and the average of the population as a whole. The Wilcoxon test for related samples was used to analyse differences before and after manual correction and the Spearman's r for independent samples to analyse correlations between TMV and error score. Statistical significance was defined as p<0.05. Statistical analyses were conducted using SPSS software (V.21.0; SPSS, Chicago, Illinois, USA), SAS V.9.3. (Cary, North Carolina, USA) and R project for statistical computing (V.2.15.1, Institute for Statistics and Mathematics, Vienna).
Results
Demographics
Images of 58 eyes of 29 patients affected with STGD1 were included in the analysis. Demographic data of all patients and patients with available follow-up visits are summarised in table 1.
Demographics of all patients included in the study and of the subgroup of patients with at least two visits (follow-up)
Evaluation of algorithm errors
Detailed information about the evaluation of algorithm errors is provided in the online supplementary material. Algorithm errors were detected and corrected in 2360 of 6958 reviewed B-scans (33.9%). There was a negative correlation between TMV and error score for the two scan densities of 19 (n=30 eyes, rs=−0.413, p=0.023) and 49 B-scans per cube (n=44, rs=−0.5.13, p=0.000), respectively, but not for the scan density (25 B-scans per cube scan) with the lowest number of eyes (n=24 eyes, rs=−0.188, p=0.378).
For all three different scan densities, there was a statistically significance difference (p<10−3, respectively) in TMV before and after manual correction of segmentation errors in the investigated subset of 42 eyes (21 patients).
Yearly change of retinal volume
Follow-up data of at least two visits (baseline and follow-up visit) were available for 36 eyes of 18 subjects (range 1–4 follow-up visits). Results for the TMV as indicated by the output number of the software, as well as volumes in all nine single ETDRS-subfields at time of first visit of these 18 patients, are presented in table 2. This table also provides the estimated yearly change of retinal volume based on different follow-up periods (mean 15 months, range 3–40 months). The mean (±SD) TMV was 6.321±1.000 mm3 at baseline and the rate of decline was −0.118 mm3 per year (p=0.003; see figure 3). Mean volume change was −0.004 mm3 per year in the central subfield (mean baseline=0.128 mm3), −0.032 mm3 per year in the inner ETDRS circle (inner four subfields; mean baseline=1.484 mm3) and −0.079 mm3 per year in the outer ETDRS subfields (mean baseline=5.206 mm3). The median (IQR) change in TMV using the empirical Bayes estimates for the individual eyes was −0.103 (−0.145, −0.059) mm3 per year, and in 14% of the eyes the estimated decline was >0.2 mm3 per year. Yearly changes for subgroups of patients with genetically confirmed mutations in the ABCA4 gene and for the subgroup of patients following the clinical phenotype classification according to Fishman are provided in the online supplementary material.
Retinal volume(s) in 36 eyes of 18 patients at baseline

The change of total macular volume (TMV) is shown over time. (A) Examples of the measurements (retinal thickness and volume (red)) in all Early Treatment of Diabetic Retinopathy Study (ETDRS) of the right eye of one patient are given at three different visits in a yearly interval. The decrease (delta) of TMV (red circle) between the visits is illustrated. (B) Pooled data of all patients with follow-up visits are shown. The estimated change in of TMV is graphically shown (blue line). The mean (±SD) TMV was 6.321±1.000 mm3 at baseline and the rate of decline was −0.118 mm3 per year (p=0.003).
Discussion
Neurodegeneration of the retina can be monitored by commercially available retinal imaging devices accessible in clinical setting.20 The Spectralis OCT offers several features to monitor atrophic processes in macular disease such as STGD1: an eye tracker can compensate for eye movements during the scanning procedure, and the retest function places follow-up examinations at the same retinal locus as in the baseline examination. The Spectralis software sets the posterior boundary line not only in the area of the third hyperreflective band of the outer retina like other SD-OCT machines, but even more posteriorly at the level of Bruch's membrane including the RPE and therefore resulting in higher values of retinal thickness and volume even in normal eyes.17 ,21 The inclusion of the RPE in retinal thickness and volume measurements may be of advantage to monitor atrophic processes in STGD1: the loss of tissue beginning at the level of the RPE or photoreceptors should be detectable by SD-OCT measurements using TMV as an outcome measure; on the other hand, however, Sparrow et al22 could show in a recent publication that the bright short-wave length autofluorescence signal of flecks likely originates from augmented lipofuscin formation in degenerating photoreceptor cells impaired by the failure of RPE, and RPE cells associated with flecks in STGD1 are considerably changed or lost. To which extent the increase of volume is due to newly developed lipofuscin or other material, and the decrease is due to cell death or the noise of the software remains to be determined and will require segmentation analysis of retinal layers including the RPE.
In this study, we observed a statistically significant decline in TMV over time and could also compute a yearly decrease in retinal volume for all nine ETDRS subfields. Studies on repeatability of the Spectralis OCT measurements of TMV are scant; to date, there are no reports specific to subjects with STGD1. Using data from 50 eyes and 4 repeated measures in eyes with diabetic macular oedema, Comyn et al8 report a CR of 0.21 mm3 for the total TMV. However, these authors did not correct the errors and only excluded scans with significant boundary detection errors. In our study, using two repeated measures in 20 eyes, after performing manual correction of algorithm errors in all B-scans, the CR estimate was 0.04 mm3, much lower than the previously reported. Based on the empirical Bayes estimate of the slope, 14% of the eyes in this study have a rate of decline of >0.20 mm3 per year; to be conservative, we would label this group as ‘having true progression in a 1-year period’. Analogously, we estimate that 50% of the eyes will show signs of true decline in macular volume in a 2-year period. Using the above parameters, a hypothetical interventional 1-year trial to arrest the decline in TMV will require 328 eyes in each arm to show a 50% reduction in true progression with 80% power a two-sided α=0.05. The corresponding numbers with a similar design for a 2-year trial are 64 eyes in each arm. Based on these calculations, SD-OCT measurement should be considered as a monitoring tool in upcoming clinical trials. However, larger patient numbers would be necessary to estimate definite progression rates.
The use of retinal volume measurements as a follow-up parameter requires some further considerations: our data show that it is important to correct algorithm errors, like segmentation errors, for the use of SD-OCT; such corrections can be impossible in case of registration errors like out-of register artefacts or degraded scan images. We observed these errors also in this study, but in all cases the errors occurred in the outermost B-scans. A careful review was undertaken to assure that these scans did not affect thickness and volume measurements, for example, were not covered by the ETDRS-grid even after replacement in this analysis.
The correction of most of the errors like misidentification of retinal boundaries or incomplete segmentation is possible; however, the procedure can be very time-consuming. The Heidelberg Eye Explorer software provides the possibility of little dots to be used to correct, align or replace a retinal boundary. The number of such dots can vary depending on the curvature and presence of angles in segmentation line, and can count up to ≥35 points in just one line that need to be corrected. Other available automated algorithms may facilitate this procedure.23 Therefore, the intracorrelation coefficient between two algorithms, both covering an area of 20°×20° but with different density of scan lines (25 vs 49) was also calculated (see online supplementary material) and shows a good agreement, indicating that the comparison of TMV in patients imaged with different scan densities may be used for retrospective analyses. Although a higher density of B-scans may enhance the precision of the measurement and the Spectralis OCT even offers higher rates up to 521 scans, a lower scan density can be considered for routine clinical application. The correction of these algorithm errors is crucial to achieve reliable follow-up data as indicated by the significant difference in volume measurements prior to and after the manual correction. We observed that these errors occur more frequently in atrophic regions (figure 2); this observation is reflected by the negative correlation between error score and TMV as an indicator of atrophic processes. Further studies are needed for the correlation between SD-OCT imaging and other imaging modalities like fundus autofluorescence (FAF) to evaluate which imaging modality may provide higher precision and therefore more power to detect atrophy progression.
Our study has several limitations: an observational period with a mean time period of 15 months may be too short to establish a definite progression rate for each individual patient. Second, we computed the yearly change based on pooled data from different patients that may show different progression rates based on their electrophysiological findings or genotype.24 There are also reports about variable rates and speed of atrophy enlargement in patients with STGD1 as determined by the growth rate of atrophic lesions in FAF.12 ,25 ,26 Third, although the concept to measure total retinal thickness and volume should reflect all changes in the retina and the RPE, the (sub)segmentation of the retinal layers and analysis of individual layers such as the outer nuclear layer or the outer segment length may provide a even more accurate progression rate than total retinal volume.23
Further improvement of the software tool is necessary to facilitate the measurements for the individual user. OCT-derived measurements of retinal thickness and volume may serve as outcome measures for clinical trials of clinical intervention that targets the progression of loss of the neuroretina and RPE in STGD1. Larger studies with a higher number of patients and a longer follow-up period are necessary to determine definite progression that may be dependent on genetic mutations or environmental factors like smoking or supplementation of vitamin A. Also, segmentation of individual retinal layers may provide higher precision and more power to detect small changes. Furthermore, the fundamental problem of functional consequences of structural abnormalities, such as loss of volume detected by high-resolution imaging, remain unclear. Therapeutic intervention in order to modify the retinal lesions detected with high-resolution imaging may only be justified if these abnormalities indeed cause visual loss. These questions are currently being addressed in the multicentre studies: “The natural history of the progression of atrophy secondary to Stargardt disease: a prospective and a retrospective longitudinal observational study” (ClinicalTrials.gov identifier NCT01977846).
Acknowledgments
The authors thank David Emmert for expertise in acquisition of SD-OCT images and Kaoru Fujinami for advice in evaluation of genetic results.
References
Supplementary materials
Supplementary Data
This web only file has been produced by the BMJ Publishing Group from an electronic file supplied by the author(s) and has not been edited for content.
- Data supplement 1 - Online supplement
Footnotes
Contributors RWS: design of the work, acquisition, analysis and interpretation of the data; drafting the manuscript. BM: analysis and interpretation of the data and revising the manuscript. YW: acquisition of the data and drafting the manuscript. RS: drafting the manuscript and revising the manuscript. EF: design of work, acquisition and analysis of the data and revising the manuscript. MGB: interpretation of the data and revising the manuscript. HPNS: design of the work, acquisition of the data, analysis and interpretation of the data, revising the manuscript. All authors approved the final version of the manuscript to be published and agreed to be accountable for all aspects of the work in ensuring that questions related to the accuracy or integrity of any part of the work are appropriately investigated and resolved.
Funding Erwin-Schroedinger Stipend by the Austrian Science Fund (Project # J3383-B23); Clinical/Research Fellowship Award in Inherited Orphan Retinal Degenerations of the Foundation Fighting Blindness (FFB); Wynn-Gund Translational Research Acceleration Program Enhanced Research and Clinical Training Award, National Neurovision Research Institute (NNRI)—Foundation Fighting Blindness (FFB; NNCD-CL-0310.0049-JHU-WG); Macular Degeneration Research Award, American Health Assistance Foundation (AHAF; M2010042); Unrestricted grant to the Wilmer Eye Institute from Research to Prevent Blindness; Baylor-Johns Hopkins Center for Mendelian Genetics (National Human Genome Research Institute, NHGRI/NIH; Identification number: 1U54HG006542-01). Supported in part by the Foundation Fighting Blindness Clinical Research Institute (FFB CRI) and a grant to FFB CRI by the U.S. Department of Defense USAMRMC TATRC, Fort Meade, Maryland (grant numbers W81-XWH-07-1-0720 and W81XWH-09-2-0189). H.P.N.S. is the Dr Frieda Derdeyn Bambas Professor of Ophthalmology. Dr Hendrik Scholl is consultant of the following entities (not including the National Institutes of Health): Fovea Pharmaceuticals; Trevena Inc.; Guidepoint Global, LLC; Gerson Lehrman Group. Dr Hendrik Scholl is member of the Data Monitoring Committee of the following entities (not including the National Institutes of Health): StemCells, Inc.; Genzyme Corp. Dr Hendrik Scholl serves as a member of the Ophthalmic Devices Panel of the Medical Devices Advisory Committee, Food and Drug Administration (FDA), Silver Spring, Maryland, USA. Dr Hendrik Scholl is principal investigator of grants at The Johns Hopkins University sponsored by the following entity (not including the National Institutes of Health): QLT, Inc. Grants to investigators at The Johns Hopkins University are negotiated and administered by the institution (such as the School of Medicine) which receives the grants, typically through the Office of Research and Administration. Individual investigators who participate in the sponsored project(s) are not directly compensated by the sponsor but may receive salary or other support from the institution to support their effort on the project(s)
Competing interests None declared.
Patient consent Written consent was obtained from patients affected with STGD1 who were investigated at the retina division of the Wilmer Eye Institute, Johns Hopkins University, between 1 July 2009 and 1 October 2013.
Ethics approval Johns Hopkins School of Medicine Institutional Review Board. The study was conducted adhering to the tenets of the Declaration of Helsinki and in compliance with Health Insurance Portability and Accountability (HIPAA).
Provenance and peer review Not commissioned; externally peer reviewed.
Linked Articles
- At a glance