Article Text

Abstract
Aims To quantify the change in drusen volume over time and identify its prognostic value for individual risk assessment.
Methods A prospective observational study over a minimum of 3 years and maximum of 5 years and follow-up examination every 3 months was conducted at the ophthalmology department of the Medical University of Vienna. 109 patients presenting early and intermediate age-related macular degeneration (AMD) were included, of which 30 patients concluded a regular follow-up for at least 3 years. 50 eyes of 30 patients were imaged every 3 months using spectral-domain and polarisation-sensitive optical coherence tomography (OCT). Drusen volume was measured using an automated algorithm. Data of a 6-month follow-up were segmented manually by expert graders.
Results Gradings from 24 000 individual B-scans showed solid correlation between manual and automated segmentation with an initial mean drusen volume of 0.17 mm3. The increase in drusen volume was shown to be comparable among all eyes, and a model for long-term drusen volume development could be fitted as a cubic polynomial function and an R2=0.955. Spontaneous drusen regression was observed in 22 of 50 eyes. In this group, four eyes developed choroidal neovascularisation and three geographic atrophy.
Conclusions Drusen volume increase over time can be described by a cubic function. Spontaneous regression appears to precede conversion to advanced AMD. OCT might be a promising tool for predicting the individual risk of progression of AMD.
- Imaging
- Retina
- Degeneration
This is an Open Access article distributed in accordance with the Creative Commons Attribution Non Commercial (CC BY-NC 4.0) license, which permits others to distribute, remix, adapt, build upon this work non-commercially, and license their derivative works on different terms, provided the original work is properly cited and the use is non-commercial. See: http://creativecommons.org/licenses/by-nc/4.0/
Statistics from Altmetric.com
Introduction
The appearance of drusen in the macula represents the initiating sign of age-related macular degeneration (AMD).1 Epidemiological studies have identified drusen size and area as risk factors for progression to advanced AMD.2 Nevertheless, the exact mechanisms involved in the development of drusen and their significance for disease are incompletely understood.
Spectral-domain optical coherence tomography (SD-OCT) algorithms that allow quantitative measurements of drusen have been developed.3 SD-OCT thus has allowed to investigate the pathomorphology of drusen progression and to include tracking of associated retinal characteristics such as the proliferation and migration of hyper-reflective foci, loss of the retinal pigment epithelium (RPE) and photoreceptors.4–6 Drusen progression usually proceeds at a slow rate, however, at a time point that is at present unpredictable, acute decompensation may occur, involving a cascade of events resulting in irreversible visual loss.7 The histological features of retinal destruction following drusen decompensation have been described, but with OCT the in vivo visualisation of the processes became accessible.8
Polarisation-sensitive SD-OCT (PS-SD-OCT) is an SD-OCT-based technology that is able to measure the polarisation state of backscattered light.9 Preclinical studies showed that the melanosome content of RPE cells changes the polarisation state of the reflected light and provides an intrinsic RPE-specific signal.10 By quantifying the polarisation state, PS-SD-OCT offers a precise and selective delineation and consecutively a reliable automated segmentation of the RPE.10–13
The aim of this study was to quantitatively evaluate drusen progression in patients with early and intermediate AMD over an extended period using both conventional SD-OCT and PS-SD-OCT in a prospective study design with standardised imaging. Increases and decreases in drusen volume were monitored and correlated with patterns of conversion to advanced stages of AMD in an attempt to allow an objective assessment of the individual risk of progression to advanced AMD.
Methods
In this prospective observational study, patients with early to intermediate AMD were invited to participate between January 2008 and December 2013. Eyes were examined on a regular base at the Medical University of Vienna for a minimum of 3 years. The study protocol was prospectively approved by the local ethics committee and adhered to the Declaration of Helsinki.
Patients diagnosed with AMD were examined by a retinologist and categorised according to the classification introduced by the Age-Related Eye Disease Study (AREDS) group.14 Eyes with drusen of AREDS categories 2 and 3 were included. Category 2 is defined by the presence of extensive small (<63 µm in diameter) or non-extensive intermediate drusen (63–125 µm). Category 3 encompasses extensive intermediate or large drusen (≥125 µm) and/or non-central geographic atrophy (GA) in at least one eye, however, only patients without GA were included. GA was defined as a patch of atrophy of the RPE seen in SD-OCT imaging with a diameter of ≥360 µm.14 Patients with a history of previous surgery other than uncomplicated cataract surgery were excluded, as were patients with additional eye diseases. Patients were informed about the study aims and procedures and gave their informed consent before inclusion.
After inclusion, eyes underwent a standardised examination every 3 months. Best-corrected visual acuity (BCVA) was measured and mydriatic eye drops were administered. At maximum mydriasis, digital photographs of the fovea were taken at 30° (FF 450plus, Carl Zeiss Meditec). Subsequently, eyes were scanned with both SD-OCT and PS-SD-OCT. The SD-OCT device used was the Spectralis instrument (Heidelberg Engineering). Scans were obtained in a 6×6 mm grid using a resolution of 1024×97 (A-scans×B-scans). Using the ‘follow-up mode’, a software tool included in the system, the baseline volume scan was registered and every consecutive scan was placed at the same retinal area.
The PS-SD-OCT prototype used in this study is engineered by the Center for Medical Physics and Biomedical Engineering, Medical University of Vienna, and has been described in detail.15 ,16 In short, the system is able to retrieve the intensity of backscattered light, retardation, fast axis orientation and degree of polarisation uniformity simultaneously.11 Datasets were recorded at an operating speed of 20 000 A-scans per second covering a scan field of 20°×20° (approximately 6×6 mm), using a 512×128 scan pattern.
PS-SD-OCT data were automatically segmented for drusen area and volume using an algorithm that uses the segmentation of the RPE layer. The algorithm delineates the drusen contour by measuring the distance between the RPE and the Bruch's membrane. Subsequently, the dataset is visualised and a circle of 6 mm in diameter is centred on the fovea manually, whereas the drusen area and volume within is calculated automatically. The details of the algorithm as well as the reproducibility of the segmentation results have been published.16 ,17
SD-OCT scans were evaluated manually using custom-made validated reading centre software (OCTAVO, Vienna Reading Center). This software enables manual outlining of structures seen in single B-scans and calculates their volume and area. As well, a circle with 6 mm in diameter was centred at the fovea and each druse within was manually segmented.
Because manual segmentation is an enormous effort, eyes were graded at intervals of 6 months (although follow-up visits and PS-SD-OCT evaluations were done every 3 months). For comparison of measurements between SD-OCT and PS-SD-OCT, Bland–Altman plots were computed and Passing–Bablok regression performed using MedCalc V.12 (MedCalc Software).
Drusen volume development was categorised into three different consecutive phases: growth, regression and postregression. Drusen growth was defined by an increase in volume over time until first regression. With respect of our earlier work in which the reproducibility (average coefficient of variation) of the drusen segmentation algorithm was determined to be 7.5%, every loss of drusen volume larger than 15% (ie, outside the 95% CI) compared with the previous measurement was defined as a regression.16 A postregression phase was defined by the phase that follows after the first regression of drusen volume.
For the drusen growth phase, a hypothetic long-term growth curve was attained by calculating a likely offset by the following procedure. Drusen volume at baseline was expressed as a LOWESS regression (stiffness 0.15) of the rank of the drusen volume. The volumes at which this function changed the slope were used as cut-points. In the next step the time required for the drusen volume of the eyes in each of the first five intervals to accumulate to the mean baseline volume of the succeeding interval was calculated by linear regression. The resulting shift was added to the measurement time points for all eyes within the respective baseline interval. The resulting graph represents an estimate of the time since first appearance of drusen (also see figure 1). These analyses were carried out using IBM SPSS Statistics V.21.0 (IBM).

Calculating the drusen volume growth model. The upper left image shows the extrapolation of drusen progression based on sequential reconstruction over a long-term period. In the upper right image, the extrapolation for the preregression phase is shown, and in the bottom left image for the regression and postregression phase. In the bottom right image, the growth function is displayed.
Results
To date, 109 patients have been included in the study. From this group, 50 eyes of 30 consecutive patients were selected for further analysis, based on continuous follow-up for at least 3 years and/or progression towards advanced AMD during the study period, with a minimum of two measurements (6 months of follow-up) before progression.
The mean age of the patients was 72.3 years (SD 7.8, range 60–90), 25 were women and 27 eyes were pseudophakic. The mean complete follow-up period was 37.7 months (SD 12.6, range 6–60), with a median follow-up interval of 3.7 months between each visit (SD 2.5, range 1–14). Three patients were classified as AREDS 2 and 27 as AREDS 3.
In total, 420 macular volume scans were segmented for drusen area and volume automatically by PS-SD-OCT. The 250 SD-OCT volume scans (ie, 24 000 B-scans) were segmented manually.
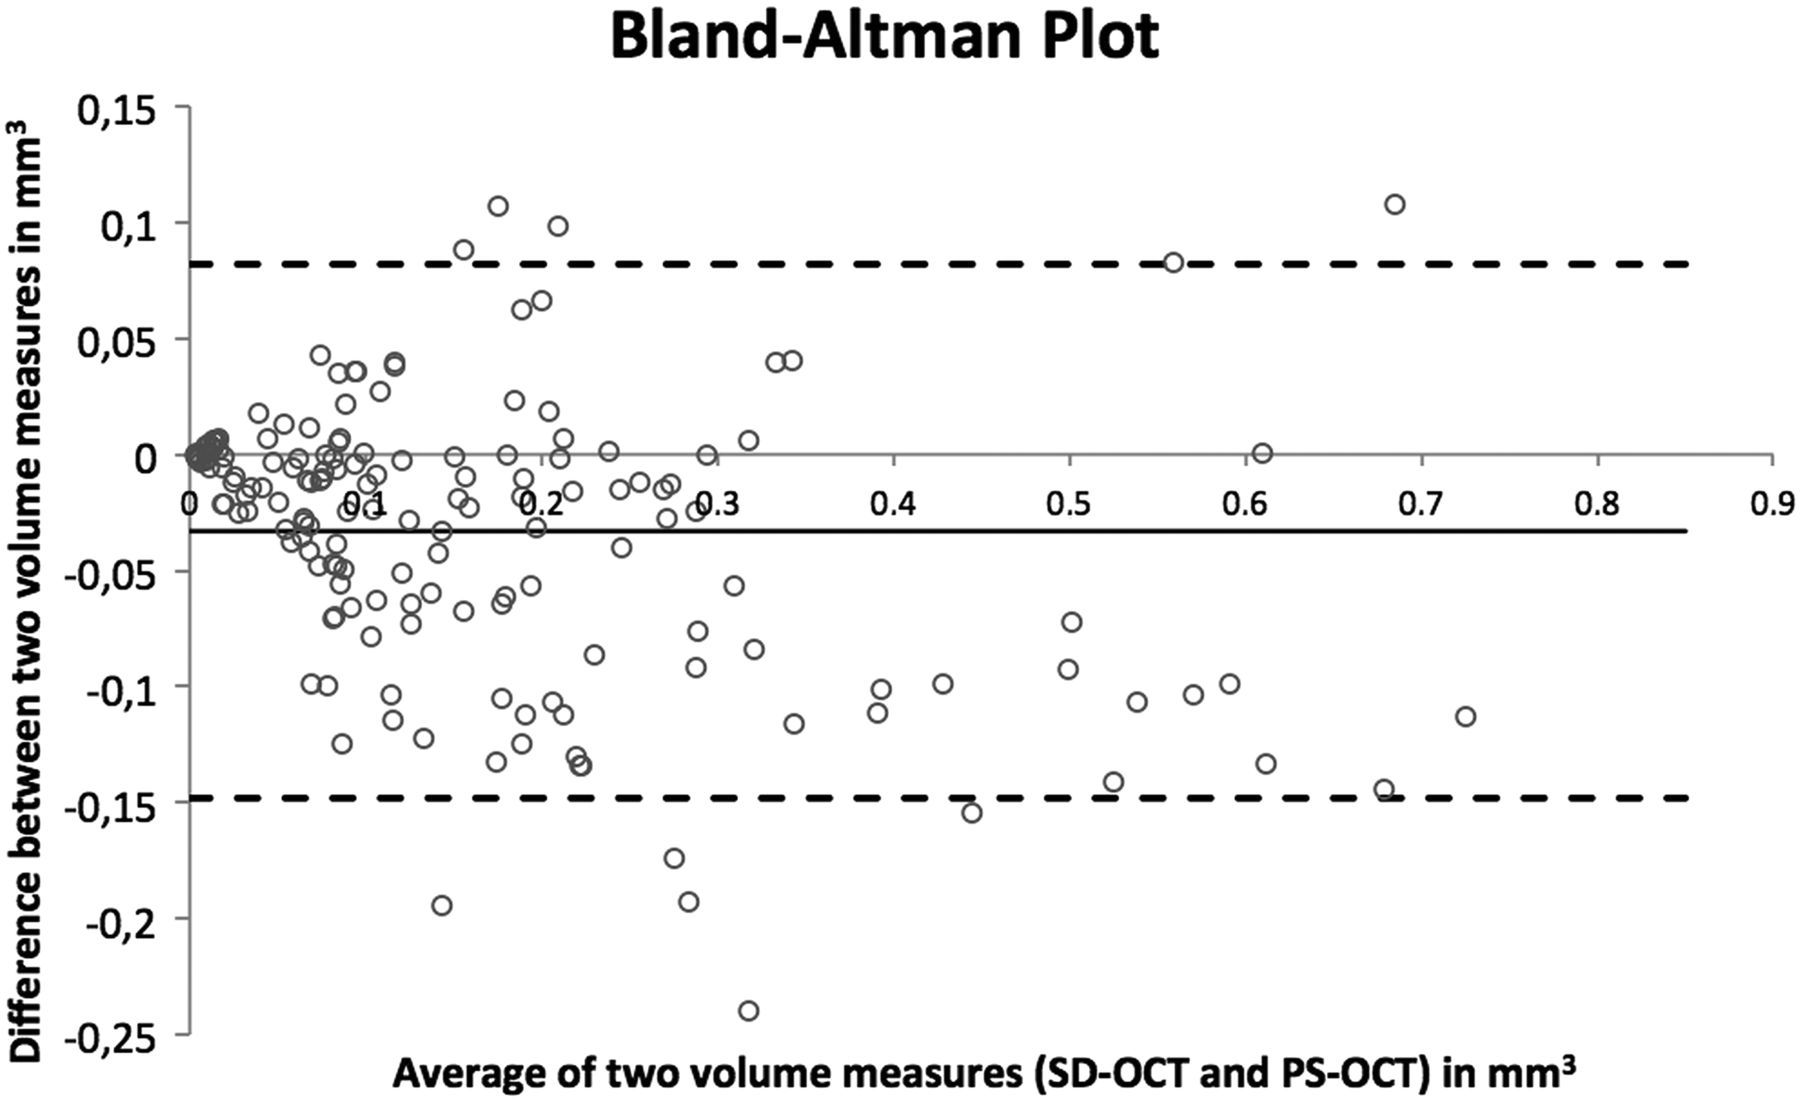
Figure 2 shows a Bland–Altman plot depicting the difference between the automated drusen calculations by PS-SD-OCT-based algorithms and the results of manual grading of the corresponding SD-OCT scans as a function of the average of these two measurements. The mean drusen volume measured at baseline was 0.17 mm3 (SD 0.17, range 0.003–0.7), the mean difference between manual and automated measurements was 0.04 mm3, with the automated algorithm measuring a slightly higher volume, within limits of agreement of 0.08 and −0.15 mm3.

Bland–Altman plot showing the agreement between the drusen volume measurements. The y-axis shows the difference between both measurements (spectral-domain optical coherence tomography (SD-OCT) minus polarisation-sensitive optical coherence tomography (PS-OCT) volume), the x-axis the mean volume of both measurements.
The complete dataset of drusen volume development in all 50 eyes measured by PS-SD-OCT during the study period is displayed in figure 3 (top image). The centre image of figure 3 shows the growth phase, and the bottom image shows regression and postregression phase.
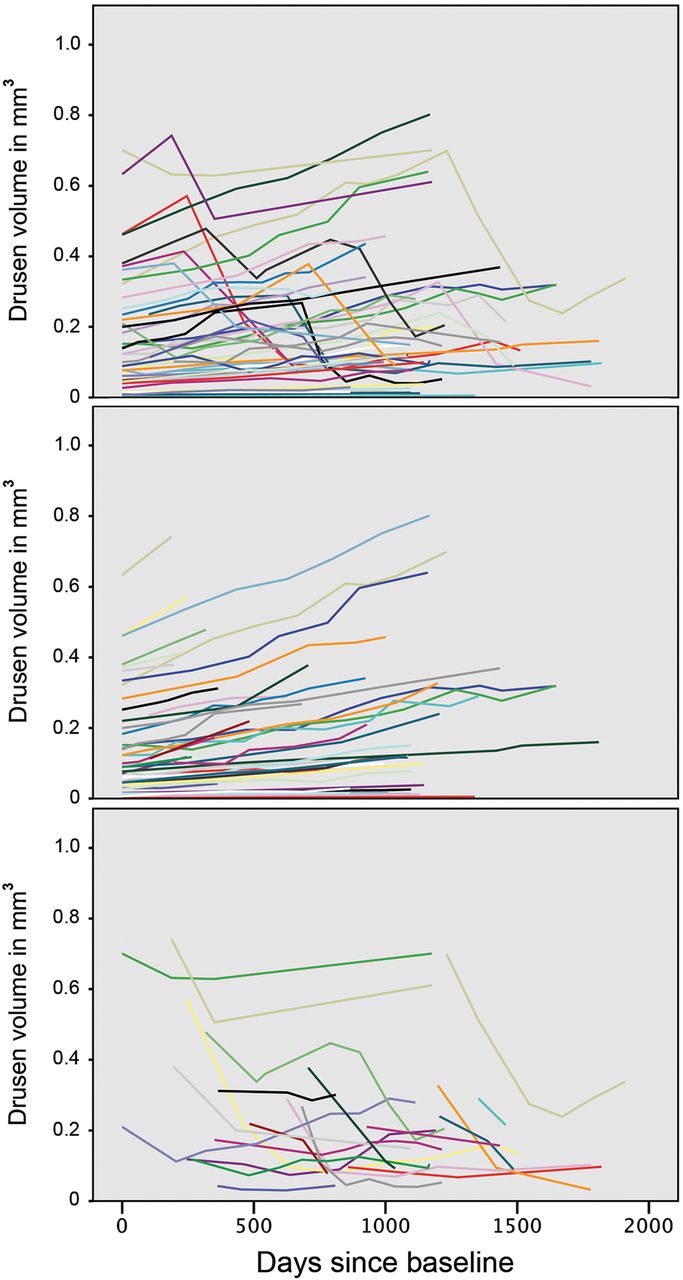
Development of drusen volume of all eyes during study period. Different colours represent the course in individual eyes. The top image shows the complete development, the image in the centre the preregression phase. In the bottom image, the drusen volume regression phase and development in the postregression phase is shown.
Figure 1 displays the hypothetic long-term drusen development model. The cut-points by which the individual eyes were classified into six intervals were 0.02, 0.05, 0.07, 0.18, 0.30 and 0.42 mm3. The observed drusen volumes before regression (figure 1, upper right image) were related to the estimated durations of drusen development and a polynomial of third order was fitted to these data with y(volume) estimates of 0.005+0.007x+0.0002x2+0.00009x3 with (x=years) and R2=0.955 (figure 1, bottom right image). Cross-validation was performed by a 50% splitting into a learning and test set and resulted in a solid predictive validity, with an R2 of 0.9.
The maximum drusen volume observed in this study was 0.8 mm3. However, in the majority of eyes, drusen volume regressed spontaneously before this volume was reached. In 22 eyes, a regression was observed at least once during follow-up. In 15 cases, regression was followed by subsequent regrowth and further less distinct regression of volume. This erratic development seems to be a characteristic of the postregression phase (figure 3, bottom image). A total of seven eyes converted to advanced AMD stages during follow-up, four to choroidal neovascularisation (CNV) and three to GA. The onset of GA/CNV pathology was never observed in eyes without previous regression, and this relationship showed to be significant (p<0.002). Noteworthy, the temporal relationship between the first regression of drusen volume and the onset of advanced AMD showed to be quite inconsistent, with a mean 8.7 months for GA (range 3–12 months) and 16.5 months until the first certain evidence of CNV (ie, leakage in fluorescein angiography, range 3–29 months).
Representative examples are illustrated in figure 4. The blue line 1 shows an eye with drusen increasing over time, followed by a sudden loss of drusen volume at 39 months of follow-up, as observed in the fundus photographs (figure 4, first row), the drusen maps (second row) and PS-SD-OCT B-scans (third row). No conversion towards advanced AMD was observed in this eye, and the BCVA remained at 20/20. Pigment epithelial migration caused an irregular depolarising signal, which appeared as small freckles in the drusen maps of month 43 and 50.

Examples of drusen development. In the top image, the volume development of three individual eyes from three different patients is shown. Fundus images, drusen maps and macular B-scans of representative visits of the blue line 1 are shown in the central three rows. The two rows below show the drusen maps and B-scans of the green line 2, which developed geographic atrophy at month 46, and the bottom two rows show the drusen maps and B-scans of the red line 3, which developed choroidal neovascularisation at month 34.
The green line 2 in figure 4 shows an example of a progression towards GA. The increase in overall drusen volume is discontinued. The increasing density and confluency of soft drusen and their spontaneous regression occurring at month 46 can be monitored in the drusen maps (figure 4, fourth row). OCT allows delineation of the RPE layer overlying soft drusen that expands over time to finally show decomposition (fifth row).
In another case, subretinal fluid indicated conversion to CNV (figure 4, red line 3). Regression in drusen volume was observed in the curve as well as in the drusen maps (bottom two rows). The last drusen map shows an increase of drusen volume, as the algorithm is not able to distinguish between drusen and serous pigment epithelial detachments.
No environmental factors such as smoking or other risk factors such as age, condition of the fellow eye and lens status showed a significant correlation to drusen volume development or the time to regression. The maximum drusen volume in eyes that did not show regression at any study time point (mean 0.33 mm3, SD 0.20, range 0.04–0.74) was significantly larger than in eyes one visit before regression (mean 0.18 mm3, SD 0.18, range 0.01–0.64) (p<0.05).
Discussion
In this study, drusen progression in eyes with early to intermediate AMD was measured prospectively at regular intervals for a minimum of 3 years or until conversion to advanced AMD. Drusen volume within a 6 mm diameter circle centred at the fovea was determined at each follow-up visit using a standardised imaging protocol. The data were evaluated using an automated drusen segmentation algorithm by PS-SD-OCT. The performance of the algorithm was tested by comparing the results with manual grading of SD-OCT scans.
The hypothetic growth function for drusen development extrapolated for a period of more than 19 years (see figure 1) supports the notion that drusen growth follows a similar path in all individual patients. This is remarkable, especially considering the cohort was not preselected for its genetic background, but reflects an average population. The growth function followed a cubic pattern, that is, the amount of drusen accumulation increased during time. No consistent saturation was observed, which could indicate a progressively metabolically stressed RPE. To the contrary, drusen regression occurred at very fast rates. Identification of the progression characteristics allows the individual drusen load to be predicted at any time of presentation, under the assumption that no regression event has taken place or will occur subsequently.
An increase in drusen accumulation has regularly been linked to advancing AMD disease, and has been put forward as a new clinical trial endpoint in therapeutic strategies targeting early AMD.18 A statistically significant correlation between drusen area and volume and the development of RPE atrophy as well as neovascular AMD was found in another study.19 In a more detailed SD-OCT analysis, drusen area, volume, height and reflectivity were described as quantitative indicators of AMD progression in a retrospective study with varying monitoring intervals.3 Large drusen caused atrophy including subsidence of the outer plexiform layer and inner nuclear layer associated with loss in retinal sensitivity, supporting the hypothesis that drusen progression per se leads to advanced AMD.20 ,21
However, spontaneous and rapid regression of drusen volume was observed in 44% of eyes in our study. The phenomenon of drusen development and regression was described in clinical and histopathological studies and was recently linked with dysregulation in the alternative pathway of innate immunity.18 ,22 ,23 The Complications of Age-Related Macular Degeneration Prevention Trial (CAPT) reported a spontaneous regression of drusen area in 31.2% of eyes after 5 years.24 No residual signs were noted after drusen regression in some eyes, but in others an irregular mottling of fundus pigmentation was observed.25
In a substantial number of eyes in our study, the drusen volume one visit before regression had reached elevated levels, probably indicating a volume threshold that increases the likelihood of a regression event. In 7 of 22 eyes where regression occurred, conversion to advanced AMD followed. Eyes that did not show a regression event did not convert.
Concluding, the study indicates that drusen volume increases in individual eyes following a predictable curve, although this model is based on several assumptions and may not be generalised until further studies are able to confirm these findings. However, if the model can be confirmed, two main issues in clinical practice could possibly be elucidated: how long the patient already suffers from early or intermediate AMD, and, more importantly, what the prognosis of drusen development and its significance for AMD progression is. Drusen regression appears to be a necessary initial step before conversion to advanced AMD. However, in this study, the number of patients that converted was too small to draw general conclusions; this was an unforeseen limitation of this study despite its long follow-up period. Future studies should concentrate on the event of drusen regression and additional pathomorphological features such as RPE migration as possible biomarkers for progression of disease. As a long-time goal, automated SD-OCT monitoring may allow to predict progression before vision-threatening events have occurred.
References
Footnotes
Contributors FGS contributed to the conception and design of the study, the analysis and interpretation of data, data collection, literature search and wrote the article. BB, MP and AM contributed to the analysis and interpretation of data, the critical revision of the article, provision of technical resources for data collection as well as technical support; MK contributed his statistical expertise and interpretation of the data; SS, MB, US, AS, TJM and PR contributed to the data collection, analysis and interpretation and US-E contributed to the conception and design of the study, interpretation of the data, provision of resources, the obtaining of funding, administrative support and a critical revision of the article including final approval for submitting.
Funding CKH has received support by an independent scientific grant (FWF grant P19624-B02, Austrian Science Fund, Vienna, Austria), the European Union (FP7 HEALTH programme grant 201880, FUN-OCT, Brussels, Belgium). US-E has received support by an independent scientific grant (Herzfeldersche Familienstiftung, grant AP0044120FF).
Competing interests US-E receives consultancy, lecture fees and travel support from Alcon Laboratories (Fort Worth, Texas), Bayer Healthcare (Vienna, Austria), Novartis (Basel, Switzerland), Allergan (Irvine, California) and Boehringer (Ingelheim, Germany). CKH, MP and BB have received support from Canon (Tokyo, Japan). CKH reports grants from Austrian Science Fund, grants from European Commission, during the conduct of the study; grants, personal fees and non-financial support from Canon, outside the submitted work. In addition, CKH has a patent US020140327917A1 licensed to Canon.
Ethics approval Ethics Committee of the Medical University of Vienna.
Provenance and peer review Not commissioned; externally peer reviewed.
Linked Articles
- At a glance