Article Text

Abstract
AIMS/BACKGROUND Laser scanning tomography provides an assessment of three dimensional optic disc topography. For the clinical purpose of follow up of glaucoma patients, the repeatability of the various measured variables is essential. In the present study, the reproducibility of morphometric variables calculated by the topographic scanning system, TopSS (Laser Diagnostic Technology, San Diego, CA) was investigated.
METHODS Two independent measurements (30 minutes apart) each consisting of three complete images of the optic disc were performed on 16 eyes of 16 glaucoma patients using a TopSS. The instrument calculates 14 morphometric variables for the characterisation of the optic disc.
RESULTS From the two tailed paired tests, all variables were seen to have good reproducibility. However, correlation and regression analyses showed that only the three variables, volume below, half depth area, and average cup depth, are acceptably reproducible.
CONCLUSION The TopSS provides three variables which describe the physiological shape of the optic disc that have high reproducibility. These three variables might be useful for following the progression of optic disc changes in glaucoma patients.
- optic nerve head
- scanning laser
- glaucoma
- tomography
Statistics from Altmetric.com
A change in the appearance of the optic nerve head topography is an important objective sign for diagnosing and managing glaucoma. Automated instruments have been developed to quantitatively assess optic nerve topography using confocal laser scanning tomography. The confocal imaging technique uses the principle of pinhole focusing for both the incoming laser beam and the beam that returns to the imaging detector. Then, only light reflected at or near the adjusted focal plane is detected and contributes to the image. The confocal scanning laser tomographs that are commercially available are the Heidelberg retina tomograph (HRT) (Heidelberg Engineering, GmbH, Heidelberg) and the topographic scanning system, TopSS, (Laser Diagnostic Technologies, Inc, San Diego, CA, USA).
For computer analysis of the optic nerve head topography to be applied clinically for the follow up of glaucoma patients, the generated data need to be reproducible. Previous work has evaluated other technical aspects of the reproducibility of the HRT1-5 and the TopSS6 measurements. The present work takes a clinical view and investigates the reproducibility of morphometric variables calculated by the TopSS on glaucoma patients.
Materials and methods
INSTRUMENTATION
We briefly review some basic concepts since there is no reference we can give for the mode of operation of TopSS other than the operating manual of the instrument. The imaging system of the TopSS laser tomographic scanner uses a gallium-aluminium-arsenide (GaAlAs) diode laser beam at a wavelength of 780 nm that is scanned across the retina in x and y directions. By using confocal detection, only light reflected from the section of the retina lying at the focal plane of the scanning laser beam is detected. By changing the focal plane of the scanning laser beam, different section images can be recorded. A series of 32 equally spaced section images parallel to the retinal plane are obtained within this scan range. Each image in the series has a resolution of 65 536 data points (256 × 256 pixels). From these 32 section images, a software algorithm calculates the height of the eye structure at each of the pixel positions to produce a topographic map of the area under examination. A reference plane is defined by the software to be a plane at a height corresponding to the average of all pixel heights in the field of view. All remaining calculations are made relative to this reference plane. For the work reported here, the TopSS software version 2.1 was used. The TopSS instrument obtains three successive independent topographic images, from which it creates a composite average baseline image, which in this work, we call “the measurement”. The use of three images to form a baseline or reference image is dictated by the TopSS software and is not a user choice or option. A contour area (curve or circle) is drawn by the operator using a computer mouse to best approximate the perimeter of the margin of the optic disc. For a given patient, the instrument automatically uses and aligns the same contour area for analysis of additional images by matching appropriate landmarks.
The TopSS presents 14 variables as the result of its analysis of the optic disc. One of the variables, the average diameter (AD), is arbitrarily set by the operator who draws a contour area about the optic disc. The instrument provides a value for the average diameter corresponding to the area drawn. Therefore, AD represents operator input rather than a measurement made by TopSS. A second one, the total area (TA) of the user drawn contour area, is calculated from the average diameter and is therefore also strictly dependent on operator choice. In addition, AD and, as a consequence, TA are held fixed by the instrument from first to second measurement. Hence, the question of repeatability does not arise for the two variables, AD and TA.
The remaining 12 TopSS variables are defined as follows. Height variation (HV) is the difference between the maximum height and the minimum height values along the perimeter of the user drawn contour area, relative to the reference plane. Mean contour height (MCH) is the average of all the height values within the area of the user drawn contour area, relative to the reference plane. Modulation (M) is the height variation divided by the sum of the maximum height and the minimum height values along the perimeter of the user drawn contour area, relative to the reference plane. Effective area (EA) is the cup area located 100 μm below the total area. Neuroretinal rim area (NRA) is the difference between the total area and the effective area. Volume below (VB) is the volume of the cup below the effective area. Volume above (VA) is the volume of all tissue or structures within the neuroretinal rim area. Half depth area (HDA) is the area at a height located half way between the average height along the perimeter of the user drawn contour area and the deepest points of the cup. Half depth volume (HDV) is the volume of the cup below the half depth area. Maximum cup depth (MCD) is the average depth of the lowest 5% of all height values. Average cup depth (ACD) is the average of all height values within the cup. Cup to disc ratio (CDR) is the ratio between the effective area and the total area. The units of measurement of all 14 variables are mm, mm2, mm3 or unitless for distances, areas, volumes, or ratios, respectively.
PATIENTS
Sixteen eyes of 16 subjects with glaucoma were enrolled in the study. Although there is no need for the eyes to be glaucomatous to assess the reproducibility of the TopSS, the instrument is ultimately aimed at measurements on this group and it is appropriate to use the instrument to address the progression of optic disc properties of these patients. Their mean age was 70.3 (SD 14.9) years. There were six women and 10 men, all of whom had primary open angle glaucoma with characteristic glaucomatous optic disc cupping and corresponding visual field loss. All eyes were close to emmetropia (plus or minus 3 dioptres), had non-astigmatic spherical cornea, had clear media, and had intraocular pressure less than 20 mm Hg on medications. Because the group tested consisted of glaucoma patients who were receiving glaucoma medications that may affect pupil size, all pupils were dilated to have uniformity in the tests (tropicamide 0.5% and phenylephrine hydrochloride 10%). The minimum pupil diameter following pharmacological mydriasis for inclusion in the study was 5 mm. The worse eye (larger cupping and greater visual field defect) from each subject was studied. Informed consent was obtained from all patients.
STUDY DESIGN
The following protocol was followed for each patient in the study. All images were obtained by the same operator. A first measurement, comprising a set of three sequential images, was obtained with the TopSS creating a first baseline image. Intervisit conditions were mimicked by removing the patient from the instrument and resetting the controls. A second measurement, comprising an additional set of three images, was then obtained after an interval of 30 minutes, creating a second baseline image. One contour area was defined by the operator for use in analysing both the first and second baseline images. The two baseline images constitute the first and second measurements, respectively, as described throughout the remainder of this work. Since the TopSS is making a non-invasive optical measurement on the eye, an interval of 30 minutes is sufficient to ensure that the second measurement is a procedure that is independent of the first measurement, and that the eye being measured has not changed in the interval.4 The criteria of this study are aimed at finding variables that have stable and reproducible enough values that they would be useful for following the progression of a disease. All morphometric variables calculated by the TopSS for each of the two measurements on each patient were statistically evaluated for paired differences, percentage absolute change, correlation coefficients, and linear regression analysis. Determining what statistical measures to use to test for reproducibility is an open topic.7 8 None of the statistical tests taken alone is sufficient to use as a criterion for reproducibility; however, each of these tests is a necessary condition. Taking all mentioned tests gives some reasonable semblence of assurance that a variable is reproducible.
Results
Mean values and standard deviations of the 14 variables are presented in Table 1 for the measurements taken on all the patients. All 14 variables have good reproducibility (p>0.05) as derived from Table 1. The inhomogeneity in the patient to patient results for the 14 variables can be seen (95% confidence intervals) in Figure 1. However, MCH and HDV show poor reproducibility (more than 10% change) as derived from the analysis of absolute change (percentage absolute change: 100 times half the absolute change divided by the average of the first and second mean value) as shown in Table 1 and Figure 2. The absolute change, as defined here, is a quantity close in concept to that propounded by Bland and Altman9-11 for assessing agreement between two methods of measurement or for reproducibility between repeated measurements. The average of the percentage average change is used in Table 1 and Figure 2 as a measure of this type of reproducibility.
Comparison of first and second measurement of topographic variables

Comparison of mean values and 95% confidence intervals corresponding to a first and second measurement of 14 topographic variables, some scaled with a factor of 10 as indicated (abbreviations are defined in text, abscissa in mm, mm2, mm3 or unitless as appropriate).

Percentage absolute change between the first and second measurement (abbreviations are defined in text). Open bars correspond to variables exceeding the 10% level, grey bars correspond to variables within the 10% level, and dark bars correspond to variables within the 10% level and which satisfy all five statistical criteria.
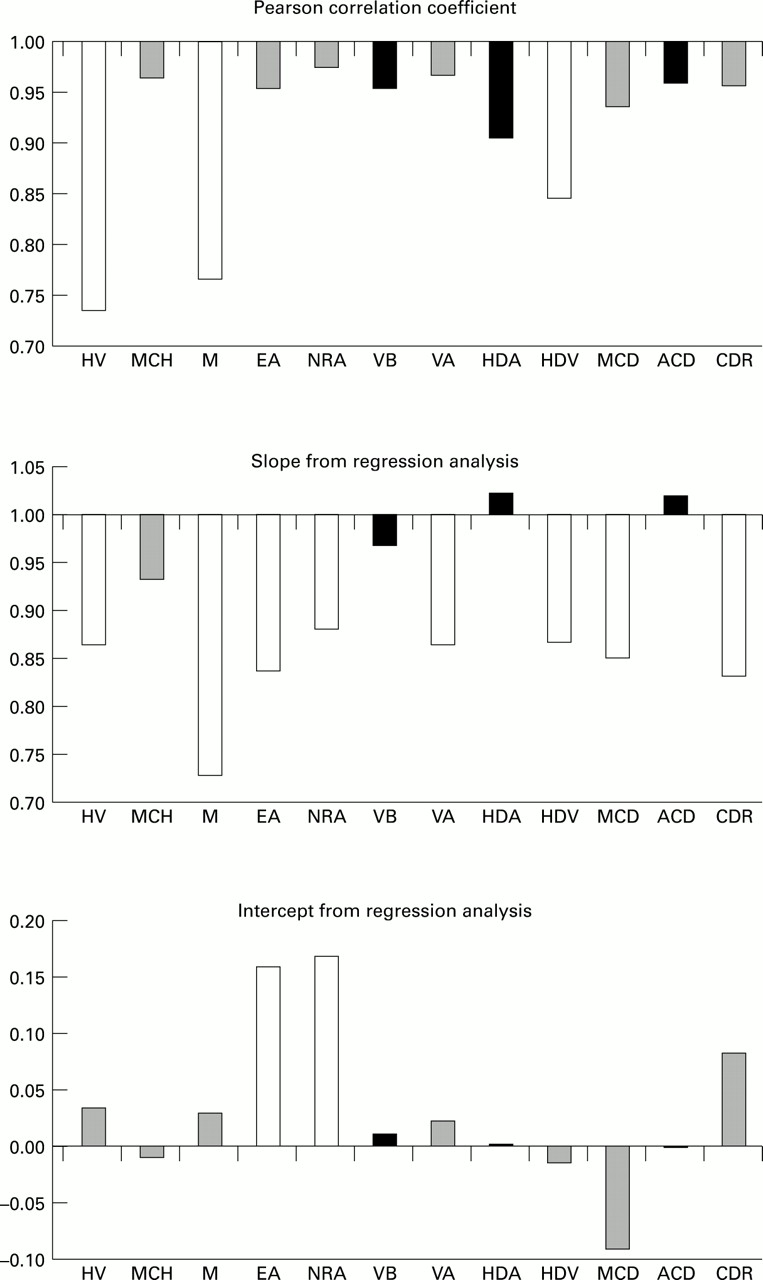
Despite the apparent good repeatability from the paired test, correlation and regression analyses impose additional requirements for repeatability. Nine variables (MCH, EA, NRA, VB, VA, HDA, MCD, ACD, and CDR) appear to have good repeatability from the Pearson correlation coefficient (>0.9). Only four variables (MCH, VB, HDA, and ACD) were reproducible from the linear regression slope (within plus or minus 0.1 of unity). All but two variables (EA and NRA) were reproducible from the linear regression intercept (within plus or minus 0.1 of zero). These results are shown in Figure 3.

Calculated statistical variables from a correlation and linear regression analysis on the first and second measurements (abbreviations are defined in text, abscissa in mm, mm2, mm3 or unitless as appropriate). Open bars correspond to variables exceeding the 10% level, grey bars correspond to variables within the 10% level, and dark bars correspond to variables within the 10% level and which satisfy all five statistical criteria.
The three variables that satisfy all five statistical criteria simultaneously are volume below, half depth area, and average cup depth as displayed in Table 2.
Values of reproducibility criteria for topographic variables
Discussion
There has been considerable previous work1-6 12-23on the subject of the reproducibility of computerised methods of measuring optic nerve head topography. These works focused on the repeatability of signals at the pixel level, and other technical reproducibility issues. A different approach is taken in this work—namely, we evaluated the instrument as it would be used in a clinical setting and examined the output variables that the instrument has intended for clinical assessment of the optic disc.
On the basis of the present results, the TopSS may provide three variables—average cup depth, volume below and half depth area—that might be reproducible enough to be used for following the progression of optic disc changes in a patient.24-26 These three variables are of clinical use for glaucoma since they describe the overall geometry of the cup—namely, its depth (ACD), volume (VB), and cross sectional area (HDA). In an eye with glaucoma, the bundles of axons of the optic nerve are destroyed causing focal or concentric thinning of the neural rim and consequently focal or concentric horizontal enlargement of the cup.27 In other cases, loss of optic nerve axons manifests itself as deepening of the cup.28 Either one of these change the cup volume. These changes are detected with the TopSS by following the variables HDA, which represents the horizontal disc enlargement, the ACD, which represents the cup depth, and VB, which represents the cup volume and is a function of both the above variables. It appears from our study that these three variables are the most reproducible ones and therefore useful to detect changes in optic nerve head topography of glaucoma patients.
Given the criteria chosen here for repeatability of the morphometric variables, a physiological change would need to be larger than the expected “measurement spread” to be noticed as a real change in the morphology of the optic disc. It needs to be determined whether physiological changes in these variables will be great enough during the time interval between patient visits to be detected relative to the inherent uncertainty in the measurement of these variables. Nevertheless, the TopSS provides three variables that are highly reproducible and thus could be clinically useful for following the progression of optic nerve head change in the group of glaucoma patients.
Acknowledgments
The authors thank Laser Diagnostic Technologies Inc for technical interactions. The statistical analyses were undertaken by Yael Villa from the Department of Statistics, Tel-Aviv University, Tel-Aviv, Israel. This work was supported in part by the US Department of the Navy under Contract N00039-95-C-0002.