Article Text

Abstract
BACKGROUND Previous work has highlighted the prognostic importance of patterns of periodic acid Schiff (PAS) staining (the Folberg patterns) in uveal melanoma. These patterns have been ascribed to blood vessels but the patterns are different from those seen with other staining techniques for blood vessels. It has recently been shown that microvessel density is the dominant prognostic factor in uveal melanoma. This study reinvestigates the nature and significance of the PAS patterns.
METHODS The PAS patterns were compared with the patterns seen with conventional connective tissue stains and with the patterns seen in sections stained for the presence of blood vessels (by immunohistochemistry for factor VIII related antigen). The PAS patterns were determined on a panel of 117 cases of uveal melanoma. The prognostic significance of each of these patterns was determined and, as more than one pattern can exist in a tumour, principal components analysis was performed to determine the number of underlying factors.
RESULTS Comparison of the PAS patterns with other stains demonstrates that they are based on connective tissue including fibrovascular tissue. Five of the nine PAS patterns carried prognostic significance on univariate analysis. Principal components analysis suggested that these patterns represented three underlying factors, which were tentatively identified as representing disordered growth (factor 1), emergence of rapidly growing subclones (factor 2), and section orientation (factor 3).
CONCLUSIONS The PAS patterns are based on fibrovascular tissue and can be ascribed to three underlying factors. The first two of these factors carried prognostic significance and the first (disordered growth) retained independent prognostic significance in a multivariate Cox model which included microvessel density and tumour size.
- Periodic acid Schiff
- uveal melanoma.
Statistics from Altmetric.com
Folberg and associates1-3 have described nine patterns in histological sections of primary uveal melanomas prepared using the periodic acid Schiff (PAS) technique. They have claimed that these patterns are solely derived from blood vessels, but these patterns do not resemble the patterns of vascular staining seen in other tumours.4 5 The PAS reaction is a non-specific indicator for polysaccharides. These are present in basement membranes, including those of blood vessels, but polysaccharides have a far wider distribution and the PAS technique is not specific for blood vessels. Of these ‘PAS patterns’, some would appear to be very unlikely to be derived solely from blood vessels. For example, the network pattern would need either for all the vessels to be sectioned along their long axes (which would be a rare event for a randomly oriented section) or the vessels would have to be in the form of sheets, (which would be a most unusual vascular pattern). Although network patterns have been seen in three dimensional images in breast6 and other cancers,7 including uveal melanoma,8 they have not been noted on two dimensional images, including several large studies on breast carcinoma microvasculature.4 5 9Stroma is often present in the form of sheets and proteoglycans will react with PAS. It is likely that such connective tissues form a significant component of the described patterns.
The conclusion that the patterns seen by the PAS reaction were due to vascular tissue was arrived at by comparing the patterns with those obtained by staining with fluorescein conjugated Ulex europaeus agglutinin 1 (UEA-1). UEA-1 is a reliable marker for vascular tissue.10 However, paraffin embedded material, from their pathological archives, was used and so presumably had been routinely fixed with a formaldehyde containing fixative which can enhance natural tissue autofluorescence11 and can additionally induce yellow autofluorescence in melanocytes.12 It is possible that part of the observed patterns with the UEA-1 staining was artefactual as a result of autofluorescence.
A perennial problem in the study of melanomas is the presence of melanin which can mask or mimic positive staining reaction products. The melanin can be removed by bleaching.13 An ideal vascular marker is one that is specific for blood vessels and will resist bleaching. Factor VIII related antigen (F8), or von Willebrand’s factor, meets these criteria,14 15 while UEA-110 and CD31,16 although also being reliable vascular markers, do not resist the effects of prior bleaching.15 We have shown, using bleached sections stained for F8, that the microvessel density in uveal melanoma is a dominant prognostic factor17 and we noted that the patterns described, using the PAS reaction, were not reproduced in the sections stained for F8.
The aim of this study was to compare the patterns observed with the PAS reaction, immunohistochemical staining for F8, and autofluorescence in formalin fixed material with each other and with conventional connective tissue stains. We also assessed these patterns in terms of their prognostic significance, their correlation with microvessel density, to determine what biological properties they are measuring and to attempt to generate a summary score which might increase their utility.
Methods
PATIENTS
This study was restricted to all patients treated by enucleation at Moorfields Eye Hospital from 1979–86 and those for the years 1987–9 who were known to have died from uveal melanoma. A total of 199 cases were eligible for the study. However, 38 of the specimen blocks could not be located and a further 38 were found to be unusable because either there was too little tumour left in the block or tumour necrosis was too extensive. This left 123 cases for this study. They constituted 68 men and 55 women. No follow up information was available for three cases. Of the remaining 120 cases mean length of follow up was 77 months (median 72 months). Of those dying of metastatic melanoma, the mean time to death was 45 months (median 32 months) compared with length of follow up of 110 months (median 117 months) of those surviving or dying of other causes.
Complete clinical, pathological, and follow up data were available for 110 cases, except for intraocular pressure. There were 98 cases with complete data including intraocular pressure. Missing values were handles in a listwise manner (that is, if any data for a case were missing for a particular analysis, the case was excluded from that analysis).
VESSEL STAINING AND COUNTING
Our choice of F8 as a vascular marker was because it is unaffected by prior bleaching.15 Ulex europaeusagglutinin-1 and CD31, although also being reliable vascular markers, do not resist the effects of prior bleaching.15 All specimens used had been fixed in 10% formal saline and processed into paraffin wax. Sections for F8 demonstration were exposed to 1 g/l trypsin (Sigma T 8128) in 1 g/l calcium chloride in 50 mM TRIS buffer (pH 7.8) at 37°C for 15 minutes.18 This was followed by melanin bleaching, performed by placing the sections in 2.5 g/l of potassium permanganate for 45–60 minutes followed by 5 minutes in 10 g/l of oxalic acid.13 The presence of F8 was then demonstrated using a standard biotin–streptavidin–peroxidase technique19 20 using Dako immunochemicals (Dako, Bucks) and the mouse monoclonal antibody F8/86 (Dako AO82). All immunostaining had accompanying sections, to act as negative controls, which were treated in an identical manner except for omission of the primary antibody. The peroxidase label was visualised as the brown final reaction product of diaminobenzidine. A counter stain was not used. By this method, high contrast was achieved between positively staining endothelial cells and background.
Counts were performed using an Axiophot microscope by an observer blinded to the patient outcome. Areas of high density were located under × 100 power and then counts performed under × 200 power. A square graticule of 0.25 mm2 was used. Vessels wholly within the area of the graticule or touching the top or left hand borders were counted, while vessels touching the bottom or right hand border were excluded. Three separated areas were counted for each tumour and the maximum count and the average of the three counts were recorded.
Most count data approximate to a Poisson distribution and a square root transformation of the data is appropriate to stabilise the variance. The maximum vessel count and the average counts were found to deviate significantly from a normal distribution using the Kolmogorov–Smirnov (K-S) statistic, with the Lillefors significance level for testing for normality, which gave values of 0.1137 (p = 0.0005) and 0.1146 (p = 0.0004) respectively. The square root transformations of these variables were normally distribute with the K-S statistics of 0.0718 (p = 0.19) and 0.545 (p >0.2), respectively. There was a strong correlation between the average of the three counts and the maximum recorded count with a correlation coefficient of 0.99 (R 2 = 0.97). The maximum count is thought to be the relevant biological measure and this was used for all subsequent analyses. The transformed count was used for all parametric tests (including the Cox regressions).
TUMOUR CHARACTERISATION
In addition to the bleached F8 slides, each case had a haematoxylin and eosin stained section, for general morphology and for classifying according to the Callender system and a bleached section stained by the PAS method (augmented PAS) for determination of the PAS patterns present. The dichotomous variables for the PAS patterns, presence of extraocular extension and ciliary body involvement were coded as 1 for present and 2 for absent. Degree of pigmentation was coded subjectively from 0–4. Lymphocytic invasion was noted to be extremely heterogeneous. Therefore, it was elected to grade lymphocytic invasion into absent (1), light (2), moderate (3), and heavy (4). Mitotic counts were recorded as number of mitoses per 20 high power fields (× 40 objective).
A sample of 20 tumours, known not to be necrotic, were taken for further investigation by the techniques described below.
AUTOFLUORESCENT PATTERNS
Sections were stained with Harris’s haematoxylin (as per Folberget al 1 ) and then either mounted in an aqueous mountant or dehydrated and mounted in DPX. The slides were viewed with incident light fluorescence with the appropriate filters for fluorescein fluorescence using a Zeiss Axiophot fluorescent microscope.
CONNECTIVE TISSUE STAINS
The histological stains performed to demonstrate connective tissue elements were (1) Gomori’s reticulin fibre reaction21which stains reticulin fibres black, (2) Gomori’s trichrome22 which stains collagen fibres green, and (3) oxidation–aldehyde fuchsin to demonstrate members of the elastin–elaunin–oxytalan family.23 The oxidation used was 10% Caroat (Dequssa Ltd, Wilmslow, Cheshire), which contains potassium peroxymonosulphate, for 60 minutes at room temperature.
STATISTICAL ANALYSIS
All Cox models were constructed using a forward stepwise procedure on the basis of the likelihood ratio statistic with probability for entry into the model of 0.5 or less and probability value for removal of 0.1 or greater. All multivariate models were performed with the inclusion of intraocular pressure (98 cases) and without (110 cases). The results were essentially the same in each case and all the multivariate models presented are for the larger dataset of 110 patients without intraocular pressure. All analyses were performed withspss-win Version 6.0 software.
Results
COMPARISON OF THE PAS PATTERNS WITH OTHER STAINING TECHNIQUES
The nine patterns, as described by Folberg et al, were observed with both the PAS and the augmented PAS reactions. The PAS reaction is based on weak oxidation by 1% periodic acid which cleaves the C–C bonds of 1,2 glycols into dialdehydes without overoxidising them into carboxylic acids and these dialdehydes can then form a cyclic coloured compound with fuchsin–sulphurous acid (Schiff’s reagent). It is estimated that only 1% of potential sites are oxidised by periodate. Potassium permanganate 0.25% for 45 minutes is a much stronger oxidising agent; however, a comparison of the standard and augmented PAS reactions showed very similar results. The only difference was the augmented PAS did look slightly ‘washed out’ compared with the standard PAS reaction, attributable to overoxidation, but this was more than offset by the benefits of bleaching for the melanotic cases. Therefore, in order for all cases to be treated in a like manner, the augmented PAS was adopted as the standard.
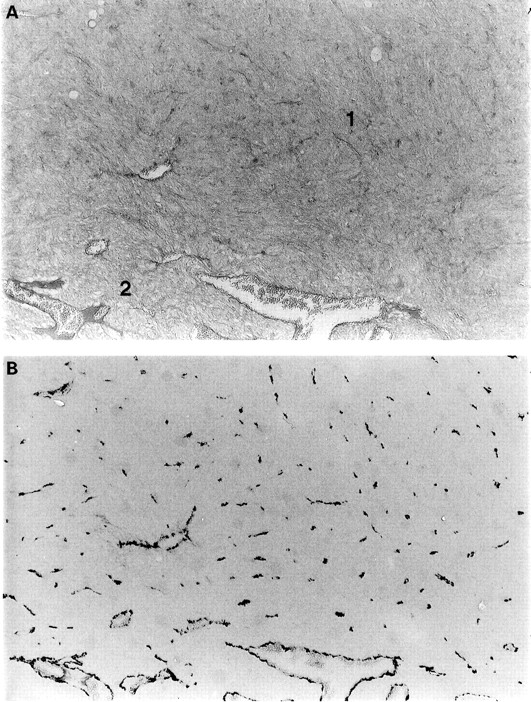
The pattern of staining with the PAS reaction was very different from that seen for the F8. The PAS reaction was not sensitive for the presence of small vessels, and areas of ‘silence’ on the PAS reaction were often found to contain numerous small blood vessels (see Fig 1). Conversely, the PAS reaction was also not specific. Although areas of ‘loops’ and ‘networks’ were frequently seen with the PAS stain, none were seen in any of the 123 cases stained for F8 (see Fig 2). There was no discernible staining on the negative control sections for F8 immunohistochemistry.

(A) A PAS section showing an ‘area of silence’ (area 1) bordering an ‘area of normal vasculature’ (area 2). (B) A corresponding section stained for F8, showing the presence of numerous small blood vessels in the ‘area of silence’. Magnification × 60.

A PAS stained section (A) showing the presence of a ‘vascular loop, with a corresponding section (B) stained with F8 showing no loops. Magnification × 60.
The slides that had been simply stained with Harris’s haematoxylin and viewed on a fluorescent microscope with the appropriate filters for fluorescein showed marked yellow-green autofluorescence. The pattern of autofluorescence was very similar to that observed for the PAS sections (see Figs 2 and 3). It made no difference to the observation of this autofluorescent pattern if the sections were mounted with an aqueous mountant or dehydrated and mounted with DPX. The autofluorescent pattern was unaffected by the effects of prior bleaching.

A section corresponding to those in Figure 2, stained with Harris’s haematoxylin and viewed with a fluorescent microscope with the appropriate filters for fluorescein viewing. It shows an autofluorescent pattern similar to that seen with the PAS reaction. Magnification × 70.
The patterns seen with autofluorescence and with the PAS reaction closely resembled the patterns seen using other connective tissue stains, in particular using the reticulin fibre stain and the green component of the Gomori’s trichrome. A problem with the reticulin fibre stain is that the stain gives a black product which can be hard to distinguish from melanin in heavily pigmented tumours.
Observation of the staining pattern of the optic nerve, present on many of the tumour sections, supports the above conclusions. The optic nerve connective tissue septa show up very clearly with the augmented PAS reaction, with the connective tissue stains and under autofluorescence conditions.
PROGNOSTIC SIGNIFICANCE OF THE PAS PATTERNS
The results of the univariate statistics on Cox modelling are shown in Table 1, and five of the patterns had prognostic significance. A forward selection Cox model, however only incorporated microvessel density and tumour size and excluded all the PAS patterns. These results are presented elsewhere.17
The univariate statistics for the PAS patterns
PRINCIPAL COMPONENTS ANALYSIS ON THE PAS PATTERNS
Most tumours have areas of more than one PAS pattern (as can be deduced from Table 2). It was clear from determining the PAS patterns that certain patterns clustered together. Therefore, a principal components analysis was performed in order to determine how many underlying factors would explain the variation present in the data. The presence of co-correlation was confirmed with the Kaiser–Meyer–Olkin measure of sampling adequacy of 0.78 (values over 0.5 are acceptable for principal components analysis and values of 0.8 and over are meritous24) and the Bartlett test of sphericity was 387 (p < 0.000005) showing that the basic assumptions for principals components analysis were met.
The frequency of the PAS patterns in the 117 tumours
Principal factor analysis was performed on 117 cases and factors with eigenvalues greater than 1 were extracted. The initial solution was rotated by varimax rotation in order to help interpretation. This resulted in the extraction of three factors and the results of the rotated solution are summarised in Table 3.
The results of principal components analysis followed by varimax rotation for the nine PAS patterns. The factor coefficients have been sorted according to size
Cox regression analysis was performed on the extracted factors and the first two had prognostic significance on univariate analysis (Table4).
Univariate statistics on Cox modelling for the three factors
CORRELATION OF PAS PATTERNS WITH MICROVESSEL DENSITY
These are summarised in Table 5. The presence of a normal pattern had a significantly lower vessel count whereas the poor prognostic patterns had a significantly elevated vessel count.
Median and interquartile ranges for the microvessel density for the presence or absence of the different PAS patterns and the mean for the transformed vessel counts. The significance testing is for difference of the means of the transformed counts, as determined by Student’s t test between presence and absence for each PAS pattern
CONSTRUCTING A CLINICAL SCORING SYSTEM FOR THE PAS PATTERNS
Factor analyses suggests that the majority of the underlying variation, scored by the PAS patterns, can be explained by three underlying ‘factors’. Cox regression on these three factors shows that only the first two had prognostic significance. A system must be simple if it is going to be practical. Therefore, two summary scores were generated, based on the first and the second extracted factors. The first factor can be simplified to a three point scoring system where the presence of arcs, the presence of arcs with branches, and the absence of the normal pattern each scores 1. Although the silence pattern appeared in the first factor, univariate testing showed that it carried no prognostic information and it was excluded accordingly. The second summary score is a 2 point system whereby the presence of loops and networks each scored 1 point and, again, the presence of straight vessels was not included as it carried no prognostic information on univariate analysis. Both these summary scores had prognostic significance on univariate analysis. A full forward stepwise regression model showed that the first summary score had independent prognostic significance but not the second (see Table 6). In this model, the presence of pigmentation appeared as a poor prognostic factor but not in models that did not include the first summary score and so its presence in the final model must be interpreted with caution.
Results of the forward stepwise Cox model including the two summary scores as well other prognostic information
It should be noted that although the first summary score did contain prognostic information, independent of tumour size and microvessel count, it did not perform particularly well. The ranking with respect to prognosis, was not linear with the worst group scoring 3 (as expected) but then the next worse group scored 1, and then 2, with those scoring 0 having the best prognosis (see Fig4).

Kaplan–Meier graph for the first summary score.
An attempt to improve on them by adding the two together performed no better. This single summary score effectively incorporates the five variables that were significant on univariate testing. Although it was highly significant on a univariate Cox model (p = <0.0005) this single summary score did not enter into a forward selection Cox regression model.
Discussion
The patterns seen using the PAS reaction were different from the patterns seen following staining for F8. In particular, the ‘vascular loops’ and ‘networks’ patterns were not seen in the F8 stained sections, and it is these two patterns that were demonstrated to be of prognostic importance.1-3 The pattern of autofluorescence closely resembled the pattern seen with the PAS reaction (see Figs2, 3, 4) and it is very likely that the fluorescent patterns observed by Folberg et al,1 in their fluorescein conjugated UEA-1 stained sections, were mainly the result of tissue autofluorescence. This conclusion is further reinforced by their observation that these fluorescent patterns could partially resist bleaching1 whereas we have noted that staining with UEA-1 is abolished by bleaching.15 The autofluorescence resists bleaching.
Autofluorescence can also be seen from the septa of the optic nerve (present in some of the uveal melanoma sections) where there can be little doubt that it is connective tissue, and not vascular tissue, that is giving rise to the autofluorescence. These same septa are also PAS positive.
The PAS pattern resembled that seen following reticulin fibre demonstration. The prognostic importance of reticulin fibres was first suggested by Wilder and Callendar in 1935,25 with pure spindle cell tumours having the greatest fibre content and epithelioid cell tumours having the least. However, there can be great variation in reticulin fibre content between parts of the same tumour, and the stain can be inconsistent. At least three studies have failed to find the reticulin fibre content to be of prognostic significance, especially once allowance for cell type had been made.26-29Accordingly, routine assessment of reticulin fibre content has not gained widespread acceptance. The staining product for reticulin fibres is black and the staining technique is not compatible with bleaching. In this respect, the augmented PAS is a marked improvement. In addition, it is hard to quantitate the amount of staining and a qualitative approach is a further potential improvement.
Comparison of the patterns seen with connective tissue stains and vascular stains does show some similarities. In particular, the loop and network patterns do include blood vessels and thus the connective tissue septa may be more properly termed fibrovascular. However, the greatest contrast between the patterns was seen for ‘areas of silence’ when the F8 staining showed large numbers of small blood vessels (see Fig 1). It is interesting to speculate that the blood vessels may act as a scaffold for the subsequent formation of connective tissue septa. These septa contain collagen and reticulin and fibres of the elastin–elaunin–oxytalan family.
Univariate analysis shows that five patterns carried prognostic significance. A poor prognosis was associated with absence of the normal pattern, and presence of arcs, arcs with branches, loops, and networks. The only difference between this and the previous work by Folberg and colleagues was that they found that parallel with crosslinks carried a poor prognosis2 3 whereas we did not. In this study, there was a trend towards parallel with crosslinks having a poor prognosis but this failed to reach significance. Our study is smaller than theirs (117 versus 234 cases) and this may be a case of a type 2 error (failing to find a difference when a significant difference exists).
Not all the patterns are independent of each other. For example, one cannot have a network pattern without also having loops present. Principal components analysis is a technique whereby one can simplify data and explain the variation present in the data on the basis of a limited number of ‘factors’. In this case, three factors accounted for nearly 70% of the variation in the data; the absence of a normal circulation, and the presence of arcs and arcs with branches loaded onto the first factor. It is interesting to speculate that this may represent loss of ordered growth which is a recognised feature of malignancy while the second factor explained most of the variation in the loops and networks patterns. The appearance of loops and networks is reminiscent of the histological appearance of regenerating liver and these patterns may indicate the emergence of relatively fast growing clones of cells, in which case they too would be expected to be associated with a poor prognosis. The third factor was parallel and parallel with crosslinks and this carried no prognostic importance (in contrast with previous findings, see above). This factor may relate to orientation of the section as there is a tendency for the larger blood vessels and associated connective tissue to enter the tumour from the base. The appearance of parallel vessels will occur if part of a section is oriented perpendicular to the sclera and parallel to the vertical axis of the tumour.
There was an association between the patterns and the microvessel counts in keeping with their prognostic implications. Presence of a normal pattern (which was of good prognosis) had a significantly lower vessel count, while those patterns with a poor prognosis had a significantly higher count. There was no association between vessel count and the presence of silence and, as previously noted, the PAS reaction is insensitive to the presence of small vessels. This helps explain the paradox implicit in the PAS patterns of why one could have relatively large areas of non-perfusion (‘silence’) in the absence of necrosis.
As shown elsewhere,17 in a multivariate model, none of the PAS patterns entered the final model. Therefore, we attempted to generate simple summary scores in an attempt to increase the prognostic power. Only one of these, the first summary score (which was based on the first factor and a tumour scored 1 point for the absence of the normal pattern and 1 each for the presence of arcs and arcs with branches) and this retained independent prognostic significance in a Cox model. However, it did not seem very satisfactory as the prognosis worsened in the order of scores 0–2 to 1–3. None of the other attempts to generate a simple scoring system (detailed in the results section) retained independent significance in a forward selection Cox model. It is possible that a more sophisticated scoring system could be generated but complicated systems are unlikely to find favour in routine practice.
We conclude that the PAS patterns are mostly formed from connective tissue, including perivascular connective tissue. We further suggest that the PAS patterns are based on three underlying factors which we tentatively identify as presence of disordered growth (factor 1), presence of rapidly growing subclones (factor 2), and a third factor representing sectioning orientation. The first two of these factors carried prognostic significance and the first (disordered growth) retained independent prognostic significance in a multivariate Cox model which included tumour size and microvessel density.
Acknowledgments
Alexander Foss was funded by The Guide Dogs for the Blind Association, Grant number CJT/bsb/92–06A.