Article Text

Abstract
AIMS Progressive loss of neuroretinal rim tissue is known to occur early in glaucoma and measurement of the neuroretinal rim area is possible by magnification corrected analysis of optic disc photographs (planimetry). This study was performed to determine whether the facility to distinguish between glaucomatous and normal optic discs could be improved upon by: (a) taking into account the known relation between optic disc size and neuroretinal rim area, and (b) measuring rim area in a number of segments, in order to detect focal changes.
METHODS Planimetric examination of the optic disc photographs of 88 control subjects and 51 patients with early visual field defects was performed. In the control group, multiple linear regression analysis was performed between neuroretinal rim area and optic disc area, age, sex, eye side, refraction, and keratometry. This was repeated for the whole disc and for each of twelve 30 degree segments. Normal ranges were defined by the 98% prediction intervals of the regression analysis and the sensitivity and specificity for correct identification of optic discs in the two groups determined.
RESULTS Multiple linear regression demonstrated significant associations between the neuroretinal rim area and optic disc area and age in normal subjects. Sensitivity and specificity for glaucoma diagnosis, using the cut off derived from the 98% prediction intervals, was 37.7% and 98.9% respectively when total neuroretinal rim area alone was considered, and 88.7% and 94.3% respectively when the 30 degree segments were included. The most frequent pattern of neuroretinal rim loss was diffuse, followed by thinning in more than one sector and then by thinning in the inferotemporal sector alone.
CONCLUSIONS This method of optic disc analysis enables the examiner to identify glaucomatous optic discs at the stage of early perimetric loss with a high degree of precision. Optic disc photography is simple, and fundus cameras are widely available. This method for glaucoma case identification may therefore be suitable for the primary care setting as well as hospital practice.
- optic disc
- glaucoma
- case finding
- imaging
Statistics from Altmetric.com
Primary open angle glaucoma is the term given to a progressive optic neuropathy, occurring in the absence of other discernible ocular or extraocular disease, and for which the major risk factors are raised intraocular pressure and older age. A functional deficit, measurable as visual field loss, is associated with the morphological changes that occur at the optic nerve head and retinal nerve fibre layer. Several clinical studies have demonstrated that these morphological changes are frequently apparent before functional loss can be detected with conventional perimetry.1-7 It is, therefore, desirable to have a set of criteria by which it is possible to distinguish reliably the morphological changes in optic discs of patients with early glaucoma from those of normal subjects. Earlier identification of cases of glaucoma would enable a better assessment of the rate of progression of the disease and allow earlier treatment if indicated. As glaucomatous disc change may precede visual field loss by several years, earlier diagnosis may improve the eventual visual outcome.
Quantitative description of morphological optic disc features, such as the area of the optic disc, optic cup, and neuroretinal rim, is possible by computer assisted measurement of optic disc photographs (planimetry),8-13 corrected for ocular and camera magnification.14-17 The neuroretinal rim area has been shown to be a useful indicator of the presence of glaucoma,9 10 18 19 but the wide variation in normal and glaucomatous populations causes considerable overlap of measurements between the two groups.9 19-21 Much of the variability results from the relation between neuroretinal rim area and optic disc size.
Previous studies have demonstrated a linear increase in neuroretinal rim area with increasing optic disc size,8 12 13 22-25with small discs of about 1.40 mm2 having a rim area of 1.25 mm2, and large discs of 3.00 mm2 having a rim area of 2.00 mm2.8 The normal range in a given population may be defined by the prediction intervals of the regression line describing the relation between neuroretinal rim and optic disc areas.8 24 25
A considerable proportion of referrals to glaucoma clinics is based on disc appearance. These referrals typically include large discs with large cups, which may be normal. Referrals of ocular hypertensive patients frequently include eyes with cupping in small discs, which should not have a cup, and which consequently may be overlooked. Any method that accurately separates normal but large discs and small but glaucomatous discs would improve the accuracy of glaucoma diagnosis.
This study was performed to assess the ability of measurements of neuroretinal rim area to discriminate between optic discs of patients with early visual field defects and those of normal subjects by (a) taking into account the known relation between optic disc size and neuroretinal rim area, and (b) measuring rim area in a number a segments, in order to detect focal/regional changes.
Materials and methods
SUBJECTS
Two groups of subjects, normal controls and patients with early glaucomatous field defects, were recruited prospectively as part of a study on the early detection of glaucoma. All subjects gave informed consent to the investigations performed, and each had the following: medical and ocular history, slit lamp biomicroscopy, tonometry, fundus examination, visual field testing, and optic disc photography.
Normal subjects
Subjects recruited were friends or spouses of patients attending the ocular hypertension clinic at Moorfields Eye Hospital (n = 40), hospital staff (n = 16), or volunteers responding to advertisements on the hospital notice boards and in a pensioners’ magazine (n = 32). Restriction criteria were: white people, ametropia < 6 dioptres, visual acuity of 6/9 (20/30) or better, normal visual fields, intraocular pressure of < 21 mm Hg, no previous ocular history involving the posterior segment, and no family history of glaucoma involving a first degree relative. All subjects performing a normal field test were included irrespective of optic disc appearance. One eye was included in the study, chosen at random if both were eligible.
Glaucoma patients
Subjects were taken from the hospital’s general glaucoma clinic (n = 39) and from the ocular hypertension clinic (n = 14). The former group were referred to the study on the basis of visual field defect and ocular hypertension only and the latter group were patients with ocular hypertension who developed reproducible visual field defects while under review.
Restriction criteria were: white people, ametropia < 6 dioptres, visual acuity of 6/9 (20/30) or better, a visual field defect reproduced on at least three successive occasions, open anterior chamber angle, intraocular pressure > 21 mm Hg at diagnosis, and no other posterior segment eye disease. One eye was included in the study, chosen at random if both were eligible.
VISUAL FIELD TESTING
All visual field testing was performed using the Humphrey field analyser 24-2 program. Reliability criteria applied were: fixation losses < 30%, false positive responses < 15%, and false negative responses < 30%.
A normal visual field was taken to be one in which the retinal sensitivity at all locations was better than the eccentricity related thresholds given in the Advanced Glaucoma Intervention Study (AGIS) protocol.26
A glaucomatous visual field was taken to be one in which a defect26 was reproduced on three successive occasions at the same location. Only patients scoring 1–5 (early glaucoma) were included.
Visual fields were assessed by an independent glaucoma expert without access to clinical information, so that optic disc assessment did not form part of the diagnostic criteria.
OPTIC DISC PHOTOGRAPHY AND PLANIMETRY
Subjects’ pupils were dilated with 1% tropicamide. Keratometry readings, taken with a calibrated Javal Schiotz keratometer, and spectacle refraction were used to correct for ocular magnification using a Littmann algorithm.14 Photographs of the optic disc were taken with the Canon CF60U at the 30 degree setting. Four sequential photographs of each eye were taken, with a lateral shift in camera position after two pictures, to obtain a stereo effect when the images are viewed stereoscopically. The camera is not of a telecentric design, and the camera magnification for differing degrees of ametropia was calculated by photographing a target of known dimensions in a model eye set at varying degrees of ametropia.27
Photographs were analysed by computer assisted planimetry using thedisc-data, Thot Informatique (Pr Bechetoille, Angers, France) program. The technique, and repeatability of measurements in this unit, has been reported previously.28
Optic disc anatomy was defined according to the following conventions3 8 9 12 29: the area of the disc was defined as the area within Elschnig’s ring, the cup was defined on the basis of contour, not pallor, and the neuroretinal rim/optic cup border was taken as the level at which the slope of the rim steepens. Vessels were considered to be part of the cup if there was no underlying rim tissue. Change in direction of vessels in the optic disc was used as a guide to the neuroretinal rim edge in those photographs where the stereo impression was not good.
The optic disc photographs of the control subjects and glaucoma patients were added to those from a group of 76 ocular hypertensive patients and then examined in a masked fashion by one experienced observer (DG-H).
The output of the disc-data program includes optic disc, cup, and neuroretinal rim areas for the whole disc and for individual 30 degree segments (Fig 1).

Optic disc sectors and 30 degree segments.

Segmental neuroretinal rim areas for subjects A to D. Solid line, rim area for subject; broken line, mean area for disc size; dotted line, lower (98%) prediction interval for disc size.
Results of the examination were analysed for the whole optic disc, for disc sectors (superotemporal: segments c, d, e; temporal: segments f, g; inferotemporal: segments h, i, j; nasal: segments k, l, a, b) and each 30 degree segment (a–l).
STATISTICS
Statistical analysis was performed with the aid of the softwarespss for Windows (Version 6.0). Multiple linear regression analysis was performed with neuroretinal rim area as the dependent variable, and optic disc area, age, sex, eye side, refraction, and keratometry as independent variables. Where the variability (spread about the regression line) of the dependent variable is related to the size of that variable, so that spread about the regression line is less when the value is small and greater when the value is large, log transformation of the dependent variable has been performed.30 Regression analysis was repeated for each of the 30 degree optic disc segments. The normal range was defined at two levels—by the 95% and the 98% prediction intervals of the regression analysis. An optic disc was labelled as abnormal if the total rim area (diffuse rim loss), or any one of the disc segments (focal rim loss), lay below the lower prediction interval at each level.
For comparison, a normal range was defined that does not take into account the size of the optic disc. The values for neuroretinal rim area in the control group have a positive skew compared with the normal distribution (Fig 2), so an empirical cut off for the lower limit of normal was taken as the 2.5 percentile.

Frequency distribution of neuroretinal rim area (control subjects).
In the glaucoma group, the comparisons between the neuroretinal rim area in each 30 degree segment and that in the whole optic disc was made using a one way ANOVA, using the Duncan procedure to correct for multiple comparisons.
The neuroretinal rim area of each segment, expressed as a percentage of that expected for disc size, for the two early glaucoma groups (converters from ocular hypertension and referrals from the glaucoma clinic) are compared (see Table 5). Comparisons between the groups were made using independent samples t test (equal variances not assumed). A significant difference was taken as p < 0.005, as multiple comparisons (rim area for the whole disc and each segment) for each disc area were made.
Comparison of the neuroretinal rim area (given as the percentage of the mean, for optic disc size, of the control group) for the two early glaucoma groups: converters from ocular hypertension (n = 14) and referrals from the glaucoma clinic (n = 39)
Results
The study population characteristics are summarised in Table 1 and Figure 3.
Summary of subject characteristics
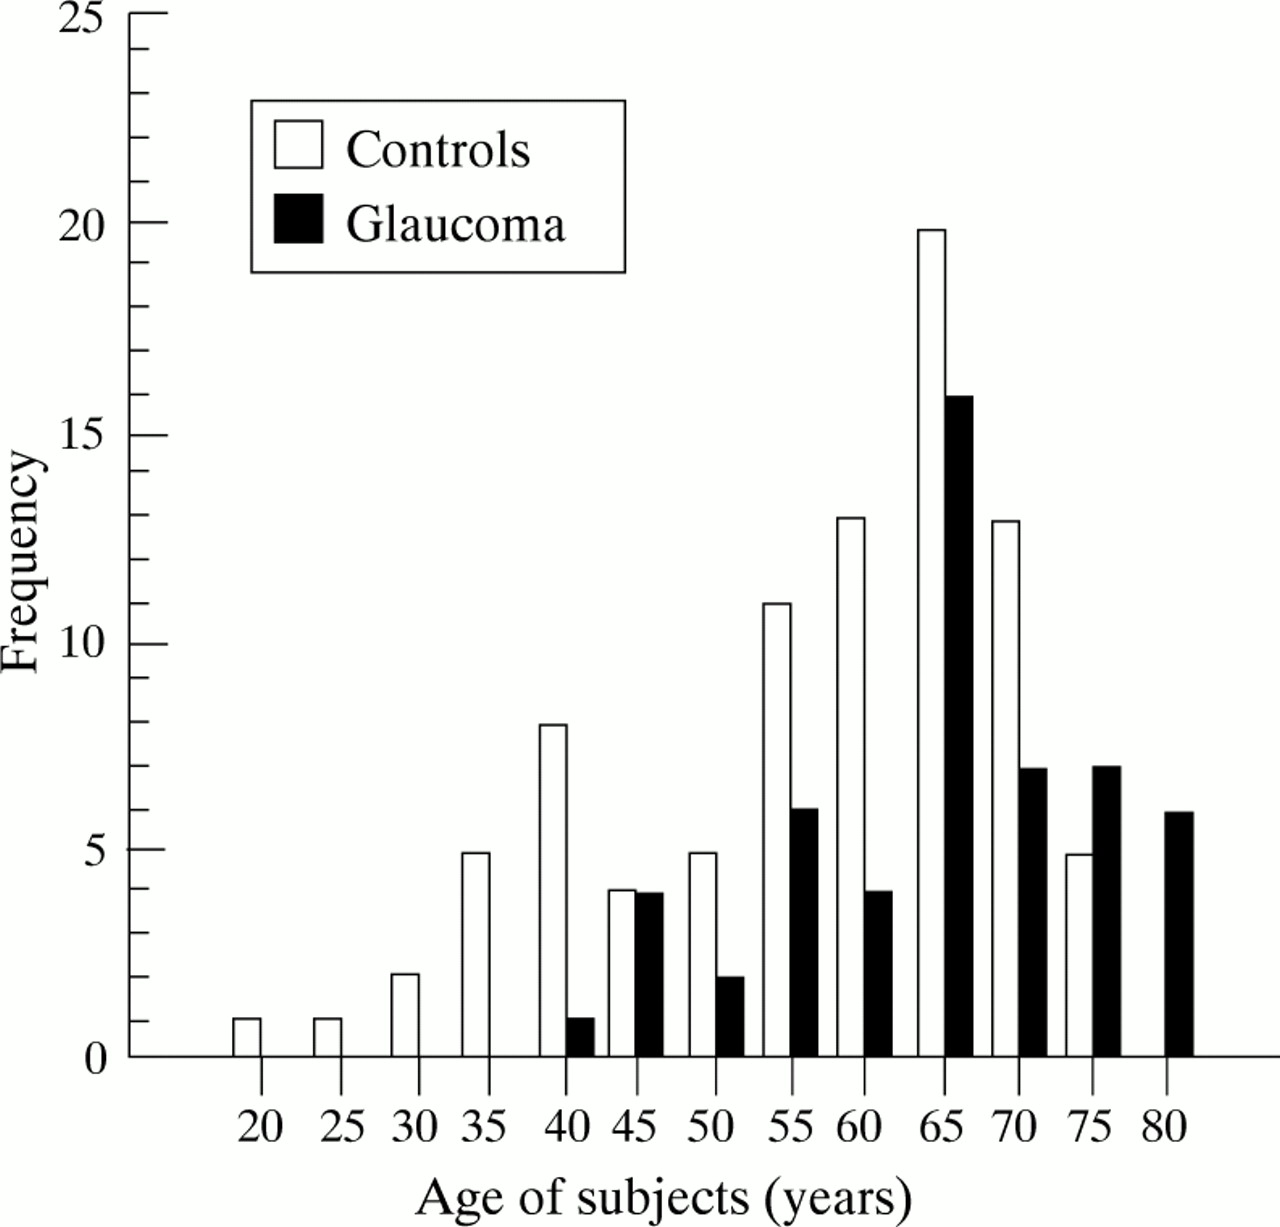
Age distribution of normal and early glaucoma subjects.
RELATION BETWEEN NEURORETINAL RIM AREA AND OTHER VARIABLES
Multiple linear regression analysis demonstrated a strong relation between the total neuroretinal rim area and optic disc area (t = 6.27, p < 0.0000) and a weaker relation with age (t = −2.58, p = 0.01). The relation is shown graphically in Figure 4. The equation for the regression line is neuroretinal rim area = 0.993 + (0.370 × optic disc area) + (−0.004 × age).
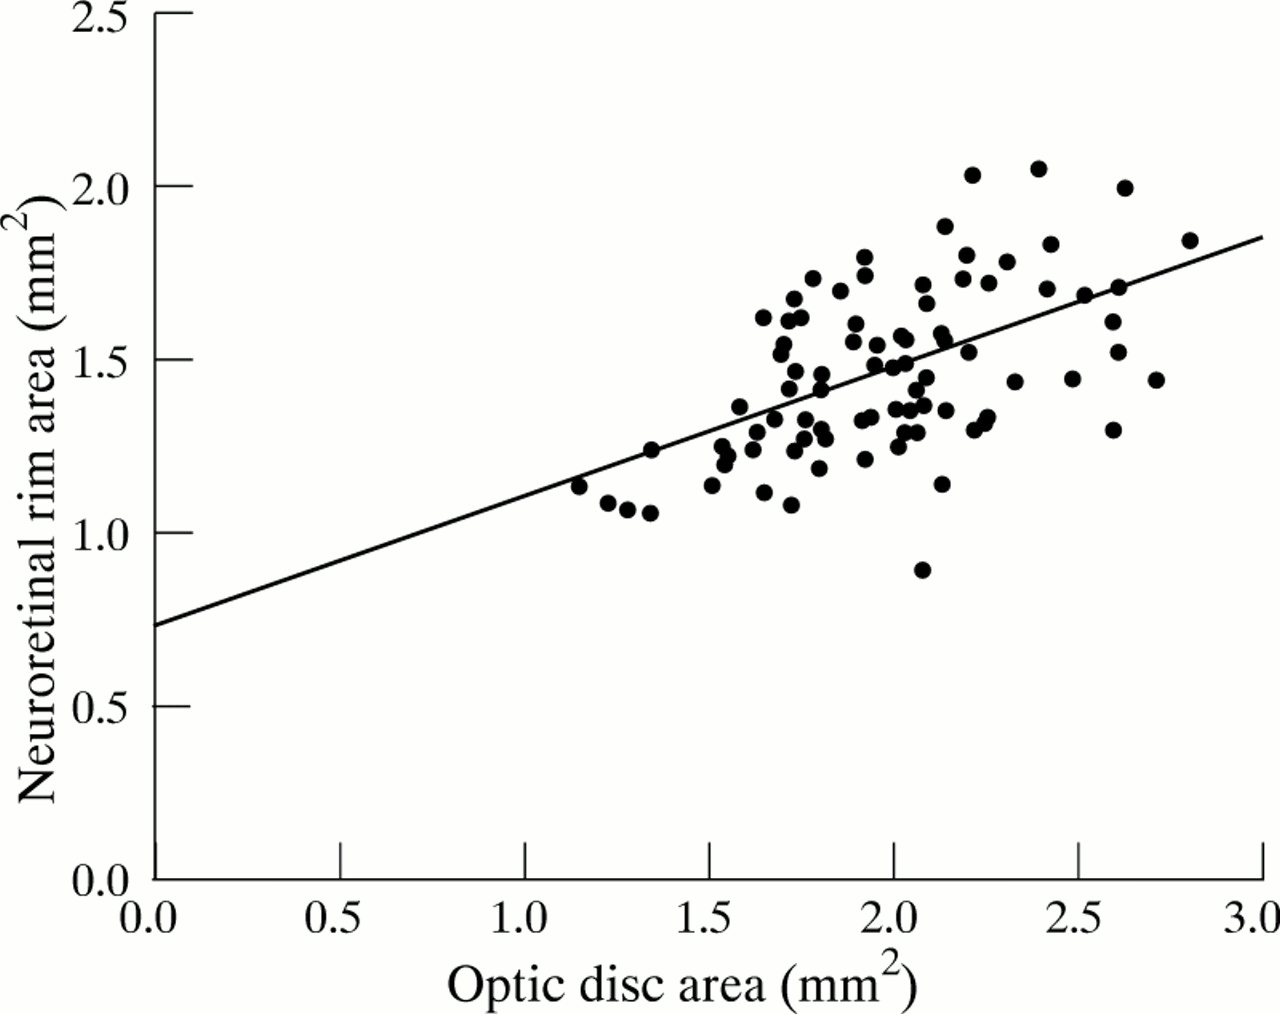
Plot of neuroretinal rim area against optic disc area (control subjects, total disc area). Linear regression line shown (r2 = 0.32, p = 0.0000).
When plotted against optic disc area, the variability (spread) of neuroretinal rim area increases as the value for neuroretinal rim area itself increases, when the whole disc, or individual segments, is considered (Figs 4 and 6). Log transformation of the dependent variable, as described by Bland,30 was performed for further analysis (Figs 5 and 7). Multiple linear regression analysis was performed with log neuroretinal rim area as the dependent variable and optic disc (or disc segment) area, age, sex, eye side, refraction, and keratometry as independent variables.

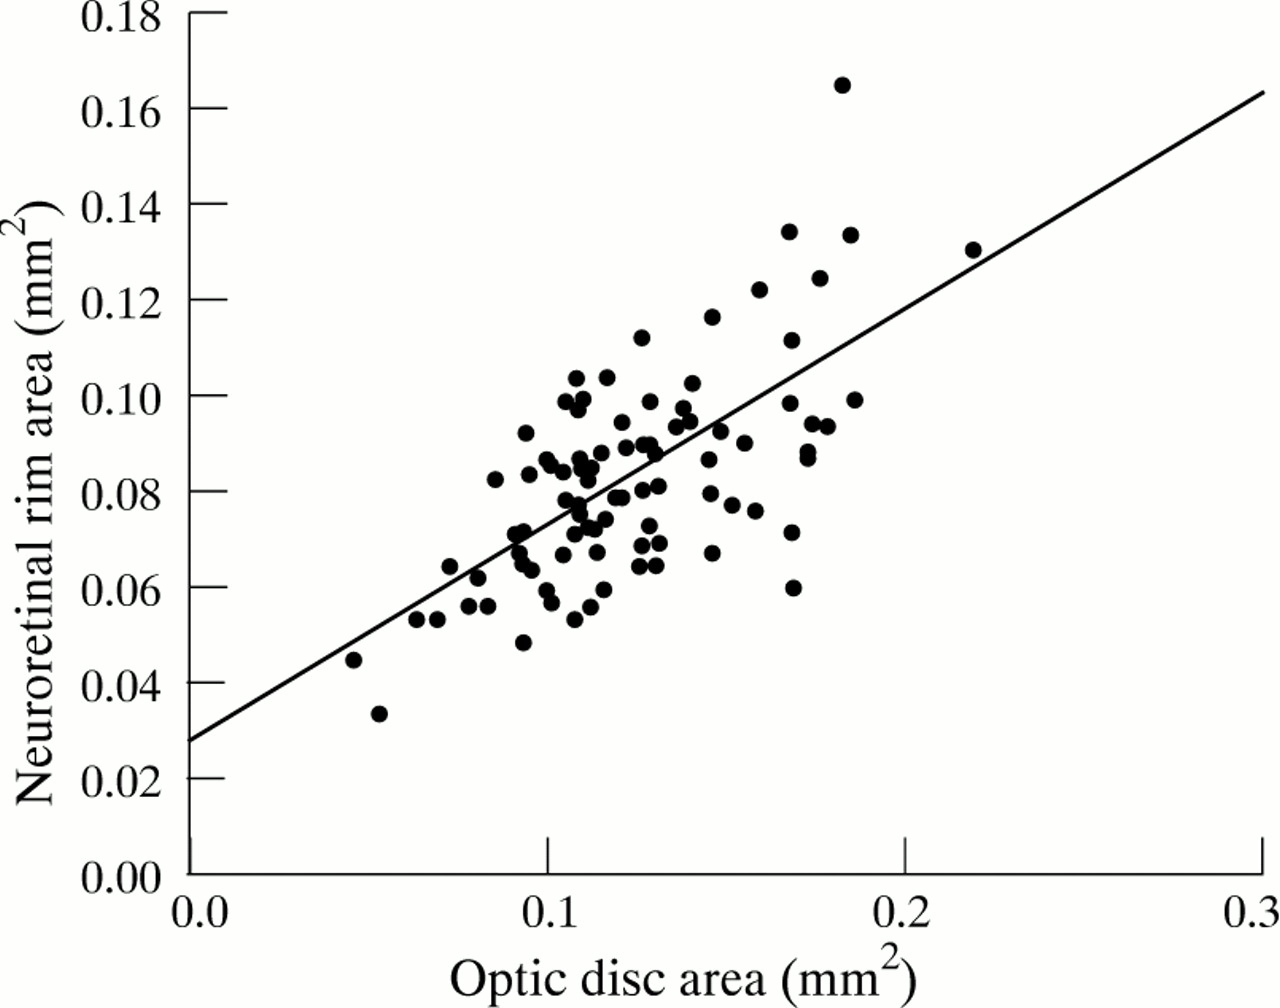
Plot of neuroretinal rim area against optic disc area (control subjects, disc segment “f”, temporal disc sector). Linear regression line shown (r2 = 0.45, p = 0.0000).

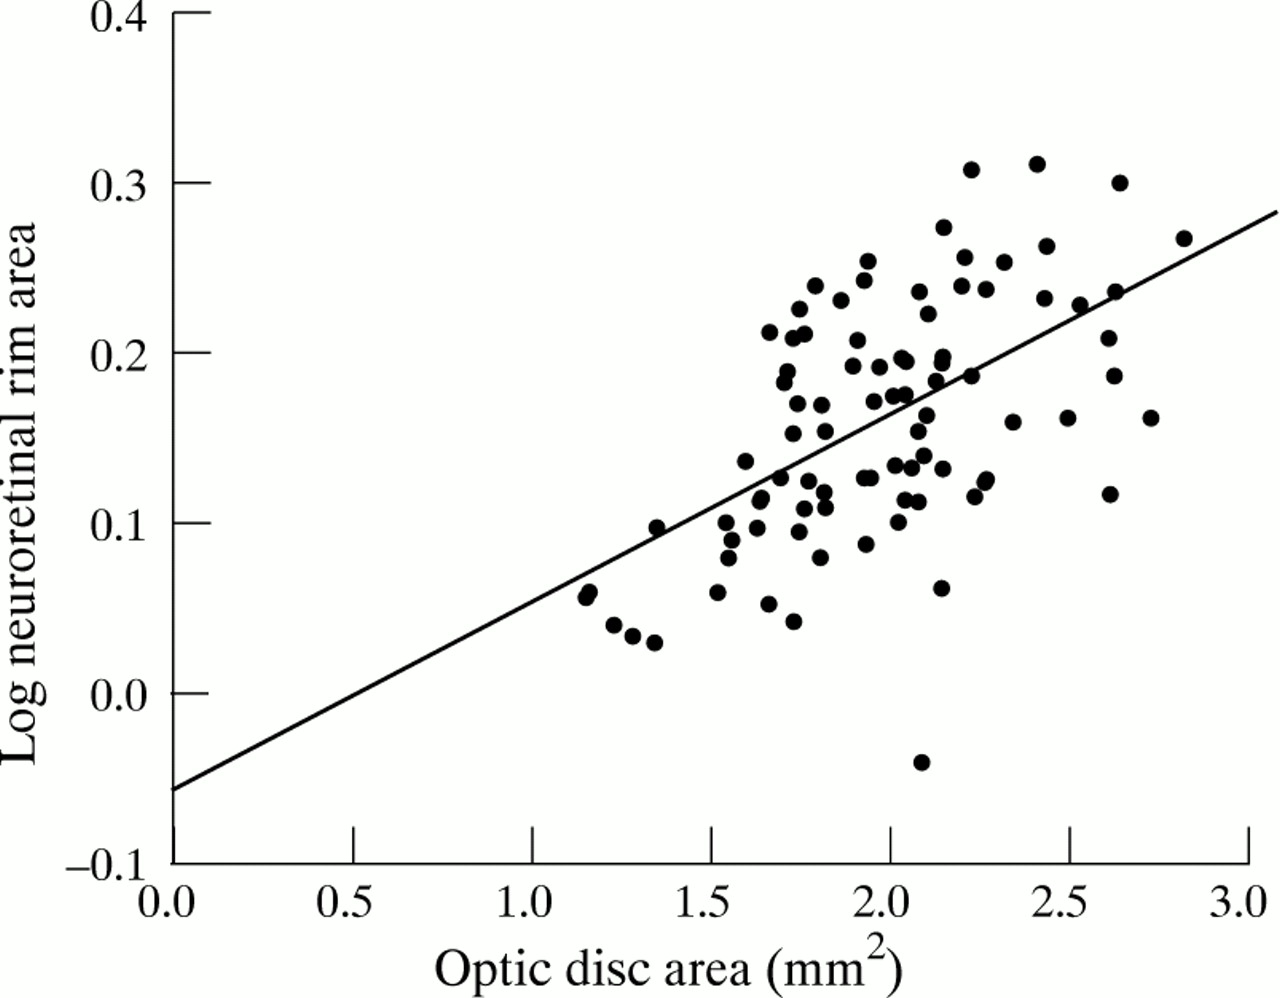
Plot of log neuroretinal rim area against optic disc area (control subjects, total disc area). Linear regression line shown (r2 = 0.32, p = 0.0000).

Plot of log neuroretinal rim area against optic disc area (control subjects, disc segment “f”, temporal disc sector). Linear regression line shown (r2 = 0.46, p = 0.0000).
A significant relation with log neuroretinal rim area was found for optic disc area and age for the whole disc. Similar relations were found for segmental log neuroretinal rim area and segment area and age in segments “j”, “k”, and “l” (inferonasal part of the optic disc). In the remaining disc segments (a–i), log neuroretinal rim area was related to optic disc segment area only.R 2 values for the regression were between 0.41 and 0.67 for all segments, and the coefficients were significant at the p < 0.0000 level for disc area and p < 0.05 for age. Neuroretinal rim area was not found to be related to sex, eye side, refraction, or keratometry.
SENSITIVITY AND SPECIFICITY OF THE METHODS
The sensitivity and specificity, for categorising optic discs as either normal or glaucomatous, was calculated from the 95% and 98% prediction intervals of the linear regression of log neuroretinal rim area against disc area, and age where appropriate. The sensitivity and specificity was also calculated, for comparison, from the 95% prediction intervals of neuroretinal rim area (untransformed) against disc area and age, and from the empirical cut off derived from the lower 2.5 percentile (which does not take disc size into account).
The sensitivity and specificity for each method is summarised in Table2, where only total neuroretinal rim area is used to separate the groups, and in Table 3, where all segments are used.
Sensitivity and specificity for categorising optic discs, as normal or glaucomatous, on the basis of total neuroretinal rim area
Sensitivity and specificity for categorising optic discs, as normal or glaucomatous, on the basis of the neuroretinal rim area in the 12 predefined segments
PATTERN OF NEURORETINAL RIM LOSS
The frequency of rim loss in each optic disc segment in the early glaucoma patients is shown in Table 4. Using the 98% prediction interval as a cut off, it is possible to describe optic discs as having diffuse neuroretinal rim loss (total rim area outside normal limits, with or without segment rim areas outside normal limits) or focal loss (total rim area within normal limits, and one or more segments outside normal limits). Of the glaucoma patients, 38% had diffuse rim loss (all had at least one abnormal segment in addition), 17% had loss in the inferotemporal sector only, 6% in the superotemporal sector only, and 4% in the temporal sector only: 21% had loss in more than one sector, but had a total rim area within the normal range.
Frequency of sectors and segments with a neuroretinal rim outside the normal range in the patients with early glaucoma
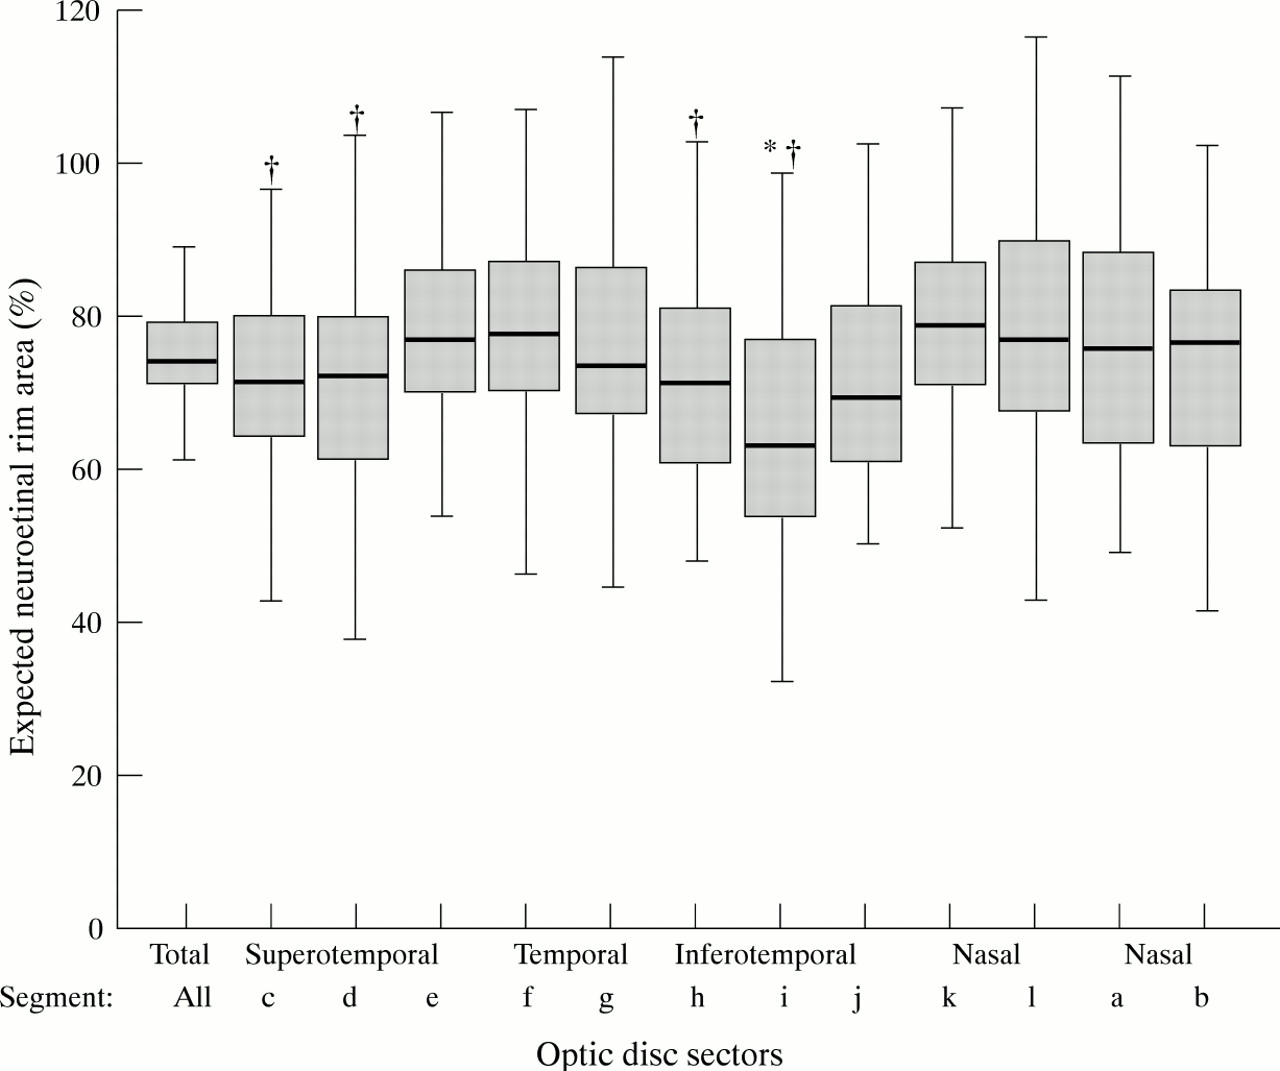
The rim area in an optic disc may be expressed as a percentage of that expected for a disc of its size. In the early glaucoma group, the median percentage expected, and spread of values, for each segment is depicted in Figure 8. Segment “i” (inferotemporal) had a mean rim statistically lower (p < 0.05) than the mean rim for the whole disc. Segments “c” and “d” (superotemporal) and “h” and “i” (inferotemporal) had a mean rim statistically lower (p < 0.05) than the mean rim for the nasal segments “k” and “l” (one way ANOVA, using the Duncan procedure to corrects for multiple comparisons).

Expected neuroretinal rim area in the early glaucoma group (rim area for the whole disc and each segment). The box represents the middle 50% of values and the bar is the median value. The whiskers extend to observations that are less than one interquartile range from the end of the box. *Significantly smaller than mean loss for total neuroretinal rim (p < 0.05); †, significantly smaller than mean loss for nasal segments “k” and “l” (p < 0.05).
Comparing the two early glaucoma groups, the referrals from the glaucoma clinic showed significantly greater rim loss in segment “i” than the converters from ocular hypertension (Table 5).
ILLUSTRATION OF THE METHOD WITH EXAMPLES
Examples are illustrated in Figure 9 (optic discs A–D).

(A) Left optic disc of a 65 year old man from the control group. (B) Left optic disc of a 62 year old man with an early glaucomatous visual field defect. (C) Left optic disc of a 65 year old man from the control group. (D) Right optic disc of a 40 year old woman with an early glaucomatous visual field defect.
Optic disc A is from the control group (optic disc area 1.34 mm2, neuroretinal rim area 1.08 mm2) and B is from the early glaucoma group and has diffuse loss of the neuroretinal rim (optic disc area 2.24 mm2, neuroretinal rim area 1.07 mm2). The total neuroretinal rim area in each is almost identical, but because optic disc A is small the area of its neuroretinal rim is within the normal range, and because optic disc B is of normal size the area of its neuroretinal rim is below the normal range (Fig 10(A) and (B)). Optic disc C is from the control group (optic disc area 2.01 mm2, neuroretinal rim area 1.51 mm2) and D is from the early glaucoma group and has focal loss of the neuroretinal rim, with the total rim area within the normal range (optic disc area 3.13 mm2, neuroretinal rim area 1.51 mm2). The total neuroretinal rim area in each is identical, but analysis by segments, taking overall optic disc size into account, demonstrated focal loss of the neuroretinal rim at the upper and lower poles (Fig 10(C) and (D)).
Discussion
The following discussion points will be covered: comparison of the planimetric findings with previous studies, comparison of the sensitivity and specificity of this method with previous methods, potential sources of bias in the study populations and applicability of the method to glaucoma case finding, analysis of the pattern of neuroretinal rim loss in the glaucoma study population.
COMPARISON OF PLANIMETRIC FINDINGS WITH PREVIOUS STUDIES
This study confirms previous findings that there is a linear increase in neuroretinal rim area with increasing optic disc size.8 12 13 22-25 The slope of the regression line—that is, the rate at which rim area increases with disc area, in this study was 0.37. This compares with planimetric data from Jonaset al who found a slope of 0.3312 and 0.39,13 Britton et al, 0.41 (estimated from graph)8 and Bottoni et al, 0.55 (estimated from graph).22 Montgomery25 had a slope of 0.44 using a clinical method. Caprioli and Miller24 found a rather steeper slope of 0.58 (estimated from graph) using the Rodenstock analyser and Varma et al 23 0.58 for white subjects and 0.44 for black subjects using automated (Topcon Imagenet) analysis of stereo photographs. Jonas et al 31 demonstrated that the slope varied with different morphological disc types, so that discs with a gently inclining temporal rim had a regression slope of 0.62 and those with a “punched out” cup had a slope of 0.30. There are a number of possible explanations for the differences in slope values between series and these include differences in the definition of anatomical features and differences in study populations. The definition of the cup/rim border may vary between clinical centres and between imaging techniques. Manual analysis of photographs requires a subjective assessment and the definition of the cup/rim border varies. Some authors7 32 define the border at the estimated level of the scleral opening, others by contour changes of the neuroretinal rim (slope steepening).3 8 12 22 Methods of automated image analysis define a reference plane with respect to the retinal surface and the cup/rim border is taken from this. Differences in the study populations allow another possible explanation for differences in the slope of the regression line. Jonas et al 12demonstrated a marked effect of disc morphological type on the regression slope and it is well established that disc morphology may vary in different populations.33-36 Varma et al 23 found that black Americans had a flatter regression slope (rim area increases more slowly with disc size) than white Americans, resulting in a smaller rim area for disc size at all disc sizes except the smallest. He interpreted this as indicating that there were fewer retinal nerve fibres at any given disc size. An alternative explanation, based on type of cupping, may be given. In optic discs with a punched out type of cupping the nerve fibres may bend more steeply to exit the eye, and in eyes with a gently sloping cup the nerve fibres generally take a more horizontal course. This results in a greater increase in rim area with increase in disc size for discs with a sloping rim than in discs with punched out cups.12 This could account for the differences Varmaet al observed, if black Americans have a more punched out type of cupping.
COMPARISON OF THE SENSITIVITY AND SPECIFICITY OF THIS METHOD WITH PREVIOUS METHODS
Previous attempts at discriminating between normal and glaucomatous optic discs on the basis of neuroretinal rim area have been disappointing because of the significant overlap of values between the groups.9 19-21 37 In this study, the sensitivity and specificity for classification, based on the 2.5 percentile cut off for total neuroretinal rim area, was 58.5% and 97.7% respectively. This compares with Airaksinen et al,9 using a cut off approximating the 5th percentile, who found a sensitivity of 73% in early glaucoma, and with O’Connor et al 19 who found a sensitivity and specificity of 55% and 63% respectively using the Rodenstock analyser and 62% and 67% using manual planimetry.
This poor discrimination between normal and glaucomatous optic discs results partly from using a “global” variable (total neuroretinal rim area) in a condition in which rim loss may be focal or regional in early disease13 38-42 and partly because neuroretinal rim area varies with optic disc area in normal subjects.8 12 13 22-25 There is a linear increase in rim area with disc area so that a large glaucomatous disc may have a rim area within the normal range if disc size is not taken into account, and a small normal disc may have a rim area outside the normal range.
The concept of defining the normal range of neuroretinal rim area by the prediction intervals of regression analysis of rim area against disc area has been advocated previously,8 24 25 though its application in glaucoma case identification has been limited. Montgomery25 applied this approach using his clinical method (indirect ophthalmoscopy with an optical spacer and measuring callipers) to assess 33 optic discs with varying degrees of glaucomatous damage and obtained a sensitivity for diagnosis of 91%. The inclusion of patients with more advanced glaucoma in Montgomery’s study (two thirds had moderate or severe field loss), in which neuroretinal rim loss may be marked, increases the likelihood of correct identification, but the result nevertheless suggests the usefulness of this approach. By comparison, the glaucoma group in our study had only early visual field loss, so that the sensitivity of the method to identify early cases could be tested.
The finding that the spread of values about the regression line becomes greater as the neuroretinal rim area increases (Figs 4 and 6) is in agreement with previous data.8 12 The range of possible values for rim area is small when the rim area itself is small, and the range is large when the rim area is large. The prediction intervals for the regression analysis, therefore, are relatively too wide for small values of rim area, and too narrow for large values of rim area. Log transformation effectively “stretches” the scale for small values of rim area relative to large values, and makes the prediction intervals more appropriate.
The sensitivity and specificity of this method, for different cut off values, are given in Table 2. Log transformation improved the sensitivity of the method: using the 95% prediction intervals for the total neuroretinal rim area, the sensitivity improved from 41.5% to 60.4% with unchanged specificity (98.9%).
When the total neuroretinal rim area alone is used for categorising discs, the specificity is excellent for all methods at 97.7% to 98.9%. The sensitivity, however, is only moderate, at best 60.4% for the 95% prediction intervals derived from the regression using the log transformed neuroretinal rim area. By measuring the neuroretinal rim area in each of 12 optic disc segments, and defining a normal range in relation to disc size for each, it is possible to pick up those cases with established visual field loss that have only focal or regional neuroretinal rim loss and a total rim area within the normal range. Using the 98% prediction intervals in each segment, the sensitivity for glaucoma case identification improves from 38% (using total rim area alone) to 88.7% (using the 12 disc segments), with a specificity of 94.3% (Table 3).
POTENTIAL SOURCES OF BIAS IN THE STUDY POPULATIONS AND APPLICABILITY OF THE METHOD TO GLAUCOMA CASE FINDING
The sensitivity and specificity reported in this study, for discriminating between normal optic discs and those with early glaucoma, reflect the groups recruited to the study. The generalisability depends on the extent to which these groups mirror the general population. Potential biases arising from subject selection should be considered.
The control group, as volunteers, may represent a healthier section of the population and some individuals with reason to seek an eye examination. As a normal visual field test was required, the normal group will not include optic disc abnormalities that are associated with visual field defects (other than glaucoma), such as tilted discs. High ametropes were also excluded. The number of control subjects older than 70 years in this study was small (Fig 3), and the interpretation of the neuroretinal rim area in the older glaucoma patients required the extrapolation of age related changes outside the range of the control group. The age effect is small, and any resulting error is likely to be limited in this context. However, a larger control group derived from an unselected population, including older subjects, is needed. The interpretation of age related changes found in this study is discussed fully in another publication.43
The subjects included as “early glaucoma” patients were selected on the basis of intraocular pressure level and visual field loss alone, so that the recognition of “glaucomatous” disc changes did not directly bias the results. However, there are a number of reasons why glaucoma patients from the clinic may not be representative of the whole glaucomatous population. Focal neuroretinal rim loss is the most easily recognisable form of rim loss and is therefore more likely to lead to a diagnosis of glaucoma than diffuse loss. With respect to visual field testing, if arcuate field loss is the type of loss most frequently recognised by the clinician as glaucomatous, in preference to other “patterns” of loss, this could introduce a selection bias that would influence the results in the direction of finding preferential neuroretinal rim loss in the inferotemporal and superotemporal parts of the disc. In addition, the visual field test itself is likely to have greater sensitivity for detecting sensory damage in the part of the field that corresponds to the arcuate areas. This is because the majority of the points tested in the Humphrey 24-2 field represent parts of the retina served by axons that leave the eye through the inferotemporal and superotemporal parts of the disc44-46 The variability of light sensitivity thresholds in the visual field increases with eccentricity,47-50making detection of abnormalities more difficult in the peripheral parts of the field. In this study, patients converting from ocular hypertension to glaucoma while under review were included as “early glaucoma” cases if a defect was repeated anywhere in the central 24 degree field irrespective of “pattern”. This avoids some of the bias arising from subjective assessment of the visual field data. Referrals from the clinic, however, reflect the method of diagnosis of glaucoma made in the normal clinical environment. The view that there may be bias in the identification of early glaucoma patients is supported by the study results. When the neuroretinal rim area of each optic disc segment in the two early glaucoma groups is analysed, there is significantly greater rim loss in the inferotemporal part of the disc in the clinic patient group when compared with the group of converters from ocular hypertension (Table 5).
Other considerations affecting the applicability of findings in this study to other centres include the ethnic origin of subjects and potential differences in optic disc imaging technique. Only white subjects were studied, and normal reference ranges for neuroretinal rim area and optic disc size, and the relation between the two, need to be established for different populations. As outlined above, the instruments used for image acquisition and analysis may result in differences between study centres. Differences in image magnification, and/or the corrections made for this, probably account for much of the difference in the reported size of optic discs and neuroretinal rim areas9 12 23-25 and the criteria by which the cup margin is defined may account for the differences in the relation between neuroretinal rim area and optic disc area.
Planimetry is a well tried method and acceptable levels of intraobserver and interobserver variation for manual planimetry have been demonstrated for this28 and other8 9 22 29 centres. However, the technique requires a high degree of subjective judgment and slight differences in conventions used may cause variation between centres. If automated methods of image analysis can be shown to have the same, or better, sensitivity and specificity for diagnosis as manual planimetry, then the improved standardisation that automation brings will allow better comparison of results between centres.
ANALYSIS OF THE PATTERN OF NEURORETINAL RIM LOSS IN THE GLAUCOMA STUDY POPULATION
The sectors of the disc most frequently identified as abnormal in the early glaucoma group in this study (Table 4)—that is, inferotemporal, superotemporal, nasal, then temporal, agree well with previous clinical41 42 51-54 and histological observations.5 However, the identification of segments as abnormal depends on the threshold for diagnosis as well as the amount of rim loss in that segment. Table 6 gives the 98% confidence intervals as a percentage of the mean expected neuroretinal rim area (derived from the control group) for each segment. It can be seen that a segment in the temporal sector will only be identified as abnormal when 60% of the rim remains, whereas a segment in the inferotemporal sector will be identified when 73% remains. Thus, because rim area varies less between individuals in the inferotemporal sector in the control group, it is easier to detect change in the glaucoma patients. The mean neuroretinal rim area in the glaucoma group was 75% of the mean of the control group for the whole disc (Fig 8). The mean for segments in the glaucoma group ranged from 65% for segment “i” in the mid inferotemporal sector to 80% for segment “k” in the nasal sector. The differences between the rim area in segment “i” and that for the disc as a whole were significant, so that it may be concluded that not only was rim loss easier to identify in the inferotemporal sector, but mean loss was also greater. Significant preferential loss with respect to the nasal segments “k” and “l” was also identified in segment “h” in the inferotemporal sector and segments “c” and “d” in the superotemporal sector. The mean amount of tissue loss was less in these segments than in segment “i”, with 72% to 73% remaining. This pattern of diffuse loss with preferential loss toward the poles is similar to that found by Betz et al, 55 who categorised the severity of his glaucoma patients on the basis of field loss. These findings, however, are not directly comparable with those of Jonas and colleagues, who categorised the severity of their glaucoma patients on the basis of the nature of disc cupping13 or on the total neuroretinal rim area.42 His finding that the glaucomatous discs with the greatest rim area have focal loss is what one would expect, though the fact that the greatest reduction in rim width appears to be at the poles is important. It cannot be concluded, however, that this is necessarily the pattern of early disease. Discs with diffuse thinning of the rim early in the disease process may go unrecognised (notching is an easier sign to detect clinically) and the visual field loss that is most easily identified as glaucomatous—that is, the arcuate scotoma, is the type of loss associated with notching of the disc. Both these factors will lead to overrepresentation in the glaucoma clinic of glaucoma patients with focal notching at the poles of the disc.
The lower prediction (98%) interval, expressed as a percentage of the mean rim area in the control population, for each segment
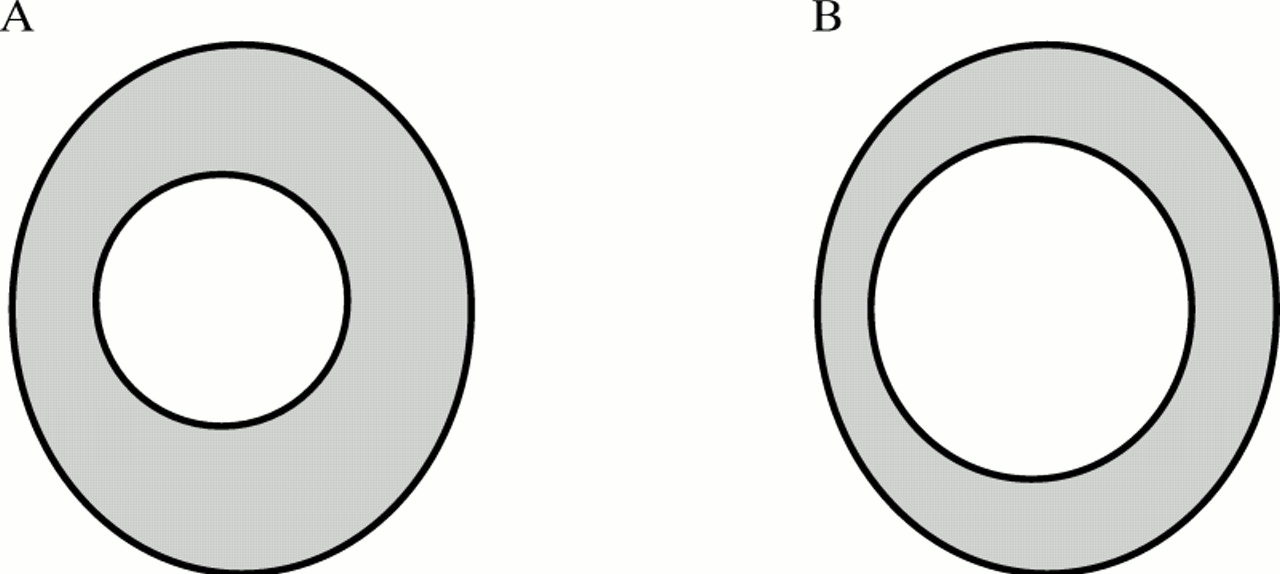
In addition, the linear reduction of the rim width will be greatest where it was initially thickest, even if there is an equal percentage loss of rim area all round the disc (Fig 11). Rim area loss evenly throughout the disc, without preferential thinning, will result in vertical ovalisation of the cup, since most discs are vertically oval,12 34 thus giving the impression of preferential thinning of rim at the poles. However, thinning of the rim at the poles, whether or not it represents preferential tissue loss in that region of the disc, results is the loss of the physiological rim shape.13

(A) Schematic representation of the mean disc size and shape and cup size, shape, and position in the group of 88 control subjects. (B) Schematic representation of the mean disc size and shape and cup size, shape, and position after a hypothetical 25% loss of neuroretinal rim area, evenly in each disc sector. Note that the cup has become more vertically oval, giving the impression of preferential loss at the disc poles.
By the same principle, large discs will have a cup shape that conforms more to the disc shape, and vertical ovalisation of the cup, and even notching will be more difficult to detect clinically without measurement data. Tuulonen et al’s finding41that discs classified clinically as having a notched rim were smaller than those classified as having diffuse rim loss may reflect this difficulty in recognising focal loss in larger discs clinically. This underlines the importance of quantifying rim loss in relation to disc size, in order to classify optic discs correctly into various morphological patterns.
In this study of early glaucoma patients, diffuse rim loss was the single most frequent pattern encountered even though visual field loss was focal. The next most frequent pattern was thinning greatest in more than one sector, and then in the inferotemporal sector alone. Overall, the sector of the disc with greatest rim loss was the inferotemporal, followed by the superotemporal.
This study demonstrates that improved detection of glaucoma cases would result from the application of these data analysis techniques, especially if adopted by primary care clinics and community optician practices. The current limitations of this method, such as the need for experienced observers, the time taken to analyse photographs, and problems associated with storage of camera film, should be overcome by development of improved analysis software and digital image acquisition.
Acknowledgments
The authors would like to thank Miss Wendy Franks (consultant ophthalmologist, Moorfields Eye Hospital) for assessing the visuals fields of subjects taking part in the study, and Dr Alicja Rudnicka (Department of Optometry and Visual Science, City University) for supplying information on the magnification characteristics of the fundus camera. Mr Garway-Heath was supported in this research by a grant from the Guide Dogs for the Blind Association.