Article Text

Abstract
AIMS To evaluate factors affecting Heidelberg retinal flowmeter (HRF) measurements of retinal and optic nerve head blood flow in human subjects.
METHODS The angle of incidence between laser beam and fundus, and camera distance from the eye, were evaluated for their effect upon measures of blood volume, velocity, and flow in a single 100 × 100 × 400 μm volume of temporal peripapillary retinal tissue in normal volunteers. Both intra and intersession reproducibility of these measures were studied. Intersession data were obtained by taking one image per week for 4 weeks. Finally, the intersession haemodynamic data were examined in the entire image (640 × 2560 × 400 μm), using histograms of pixel by pixel blood flow.
RESULTS Measures of blood volume, velocity, and flow from a single anatomical site were unaffected by laser beam to fundus angle of incidence (n = 12). As camera distance from the eye was increased (from 2 to 5 to 7 cm), flow measurements showed increasing individual changes, despite unaltered measured vessel lengths and constant overall mean flow (n = 14). The coefficient of variation for two intrasession images of optic nerve head blood flow averaged 7% (n = 20); in contrast, the 4 week intersession coefficient of variation averaged 30% (n = 15). Intersession reproducibility was increased by using flow histograms from the entire image: the coefficients of variation averaged 16% for total flow and 17% for flow in the pixel of median flow.
CONCLUSION HRF measures of flow are independent of the laser beam to fundus angle of the incidence and dependent upon camera distance from the eye. Intersession reproducibility is best using pixel by pixel analysis of the entire image.
- retina
- optic nerve head
- glaucoma
- diabetic retinopathy
Statistics from Altmetric.com
The ability to determine accurately and precisely perfusion of specific ocular tissues is fundamental to ophthalmology and visual science. Diseases characterised by angiogenesis, such as age related macular degeneration, ocular histoplasmosis, and proliferative diabetic retinopathy, alter blood vessel formation and blood flow.1-5 Diseases characterised by erosion of the optic nerve head, such as the glaucomas, may alter perfusion of the nerve head and peripapillary retina, though this point remains controversial.6-8 Consequently, measurement of blood flow is useful in disease diagnosis, for estimates of disease progression, in evaluation of therapeutic interventions, and in investigations of disease aetiology. Understanding the relation of blood flow to disease or to treatment requires blood flow measurements that are non-invasive, safe, robust, accurate, and reproducible.
Confocal scanning laser Doppler flowmetry (cSLDF, Heidelberg retinal flowmetry (HRF)) is a promising new method for retinal or optic nerve head blood flow measurement. Non-invasive, the technique uses low laser light intensities, and generates results in seconds.9-12However, a number of issues regarding the reproducibility and validity of HRF measurements remain. This article examines: (1) the influence of laser beam to fundus incident angle, (2) the influence of camera distance from the eye, (3) intrasession reproducibility, and (4) intersession reproducibility of the technique in healthy people. These results help define the potential and the limitations of this new technique.
Materials and methods
SUBJECTS
Healthy subjects free from eye disease and with no history of ocular trauma were used in each phase of the experiments. None of the subjects smoked, or were taking any medications which might affect blood flow readings. Experiments were reviewed and approved by an institutional review board, and conformed to the tenets of the Declaration of Helsinki.
EXPERIMENTAL DESIGN
Four experimental series were carried out, each involving differing groups of young, healthy people (five males, seven females; 31 (SD 10) years). They included:
(a) Comparison of blood volume, velocity, and flow measurements from a single temporal peripapillary site (100 × 100 × 400 μm, equivalent to 10 × 10 pixels), from two images—one illuminated with a 90° laser beam to fundus angle of incidence, and one with a 70° laser beam to fundus angle of incidence (n = 12).
(b) Comparison of volume, velocity, and flow at a similar fixed site, using camera distances 2, 5, and 7 cm from the eye (n= 13).
(c) Determination of intrasession reproducibility of volume, velocity, and flow measurements compared at a single 100 × 100 × 400 μm fixed site between two images obtained in a single visit (n = 20).
(d) Determination of intersession reproducibility of volume, velocity, and flow readings using the conventional 10 × 10 pixel size, and a new method which examines qualifying individual pixels from the entire 256 × 64 pixel image (n = 15). A single image was obtained once a week for 4 weeks. The new analysis method generates a flow histogram of qualifying pixels, then analyses the histogram in terms of mean overall flow, avascularity (number of zero flow pixels as a percentage of total pixels), and flow in the 25th, 50th, 75th, 90th, 95th, 99th, and 100th percentile of all qualifying pixels.
PROCEDURES
Examination technique
The table height was adjusted so that the subject’s head and chin were comfortably secured. In each of the studies, a fixation point was provided at a distance of 3 metres, to avoid errors as a result of changes in accommodation between images, and to help subjects ignore the sudden appearance of the scanning beam. When the operator had positioned the camera, the subject fixated on a single portion of a letter (for example, the intersection of two lines) until the measurements were complete (around 2 seconds).
Data acquisition
The HRF, a confocal scanning laser Doppler flowmeter, images a 2560 × 2560 × 400 μm volume of retina or optic nerve head with a scanning 780 nm infrared laser. Two green lines on the operator screen mark the boundaries of the 2560 × 640 × 400 μm volume of tissue from which flow data will be derived. After the laser beam is centred on the area of interest, focus is adjusted to produce maximal brightness within that area. With laser position and focus optimised, sensitivity is set so that the brightest pixels within the area of interest are light yellow in colour. White pixels are avoided. When acceptable alignment, focus, and brightness are achieved, the operator initiates a process that, within 2.048 seconds, scans each of 64 lines 128 times. Lines are scanned many times to yield an acceptable signal to noise ratio. After the scan is completed, the operator initiates a fast Fourier transform to extract the individual frequency components of the reflected light. For each point of the scan (256 columns × 64 rows of pixels), a frequency power spectrum is calculated. On the x axis of the spectrum, each frequency location represents a blood velocity, and the height of the spectrum at that frequency represents the number of blood cells required to produce that intensity. Integrating the spectrum yields total blood flow. For analysis of selected 100 × 100 × 400 μm of tissue, a sample box is placed on an area free from motion artefacts and major vessels are selected. These small boxes are in fact the default sample size used in analyses by the instrument. Printed HRF reports, which show the position of the sample window relative to the microvasculature of the optic nerve head and peripapillary retina, are used to guide subsequent measurements to a site within 10 μm of the baseline measurement relative to the vasculature.
When flow histograms are generated from the entire image velocity, volume, and flow are computed for each 10 × 10 μm pixel within the 2560 × 640 × 400 μm image; after elimination of pixels that contain major vessels, are poorly focused, or are improperly illuminated, the remaining values are computer sorted on the basis of flow. The mean flow for the entire array is computed, the number of zero flow pixels (“avascularity”) is determined as a percentage of total pixels, and the flow in the 25th, 50th, 75th, 90th, 95th, 99th, and 100th flow percentile pixel is determined.
SPECIFIC EXPERIMENTAL PROTOCOLS
90° versus 70° beam to fundus angle
Subject pupils were dilated with tropicamide 1% and phenylephrine 2.5% eyedrops. Before imaging, pupil size was measured. Axial length was determined by ultrasound A-scan. Two HRF images were produced, the first by positioning the HRF camera so that all fundus illumination passed through the dilated pupil near its temporal border with the iris. The second image was obtained with the camera positioned so that all fundus illumination passed through the dilated pupil near its nasal border with the iris. The same temporal region of the peripapillary retina was imaged. This location was chosen because, based on the anatomy, pupil, and A-scan measurements, the beam passing through the temporal edge of the dilated pupil approaches the fundus at approximately 90° and the beam passing through the nasal edge of the dilated pupil approaches the fundus at approximately 70°.
Examination from varying distances
Three consecutive images were obtained from three camera distances (2, 5, and 7 cm) between the corneal surface and the HRF lens. This is possible because light travelling to and from the fundus is collimated (parallel) between the eye and the HRF optics. This phenomenon is familiar to doctors performing fundus examinations using a direct ophthalmoscope. While facial features are blurred, the fundus is in focus at a distance, and remains focused as that distance is reduced. In our experiment, the same focus setting was used for all three images, with anatomical landmarks ensuring exact placement of the 100 × 100 × 400 μm sampling site. The 2 cm image was used as the baseline in each set of three images. To look for magnification distortion, HRF reports were printed and the distances between branch points were measured in millimetres with a ruler.
Intrasession reproducibility
An HRF image of the peripapillary retina was obtained. The camera angle, position, sensitivity, and magnification settings were then altered randomly, before obtaining a second reading from the same site. Images were obtained within 5 minutes of each other. Reproducibility was computed comparing two measurements of the same anatomical location by a single user.
Intersession reproducibility
Subjects were examined by HRF at 1 week intervals for 4 weeks, each measurement taking place at the same time of day. The first reading served as an anatomical baseline, and the 10 × 10 pixel box site used for blood flow measurement was within 10 μm of the baseline relative to the microvasculature, on the peripapillary retina thereafter. During the baseline recording, a sampling site in clear focus, free from major vessels, and providing DC values of 70–150 was chosen for study; identification of specific capillaries within the scan allowed repeated, week by week recordings from this same site. The focus setting from the initial visit was recorded and used for each of the subsequent visits. The week to week reproducibility of the entire image was evaluated from the same examinations; the image was analysed in terms of total flow, avascularity, and the flow histogram.
STATISTICAL ANALYSIS
In the experiment comparing 90° and 70° illumination of the fundus, paired t test and correlation were used to describe the effect of angle of incidence on HRF images. The same tests were used to examine the effect of camera distance on HRF measurements. The coefficient of variation of repeated measures was calculated according to standard methods13 when analysing the intra and intersession reproducibility. Comparisons of measurements taken under different conditions were made using two tailed ttests, with p <0.05 regarded as significant. When a data set was involved in more than one comparison, p was adjusted using Bonferroni’s correction.13
Results
90° VERSUS 70° BEAM TO FUNDUS ANGLE
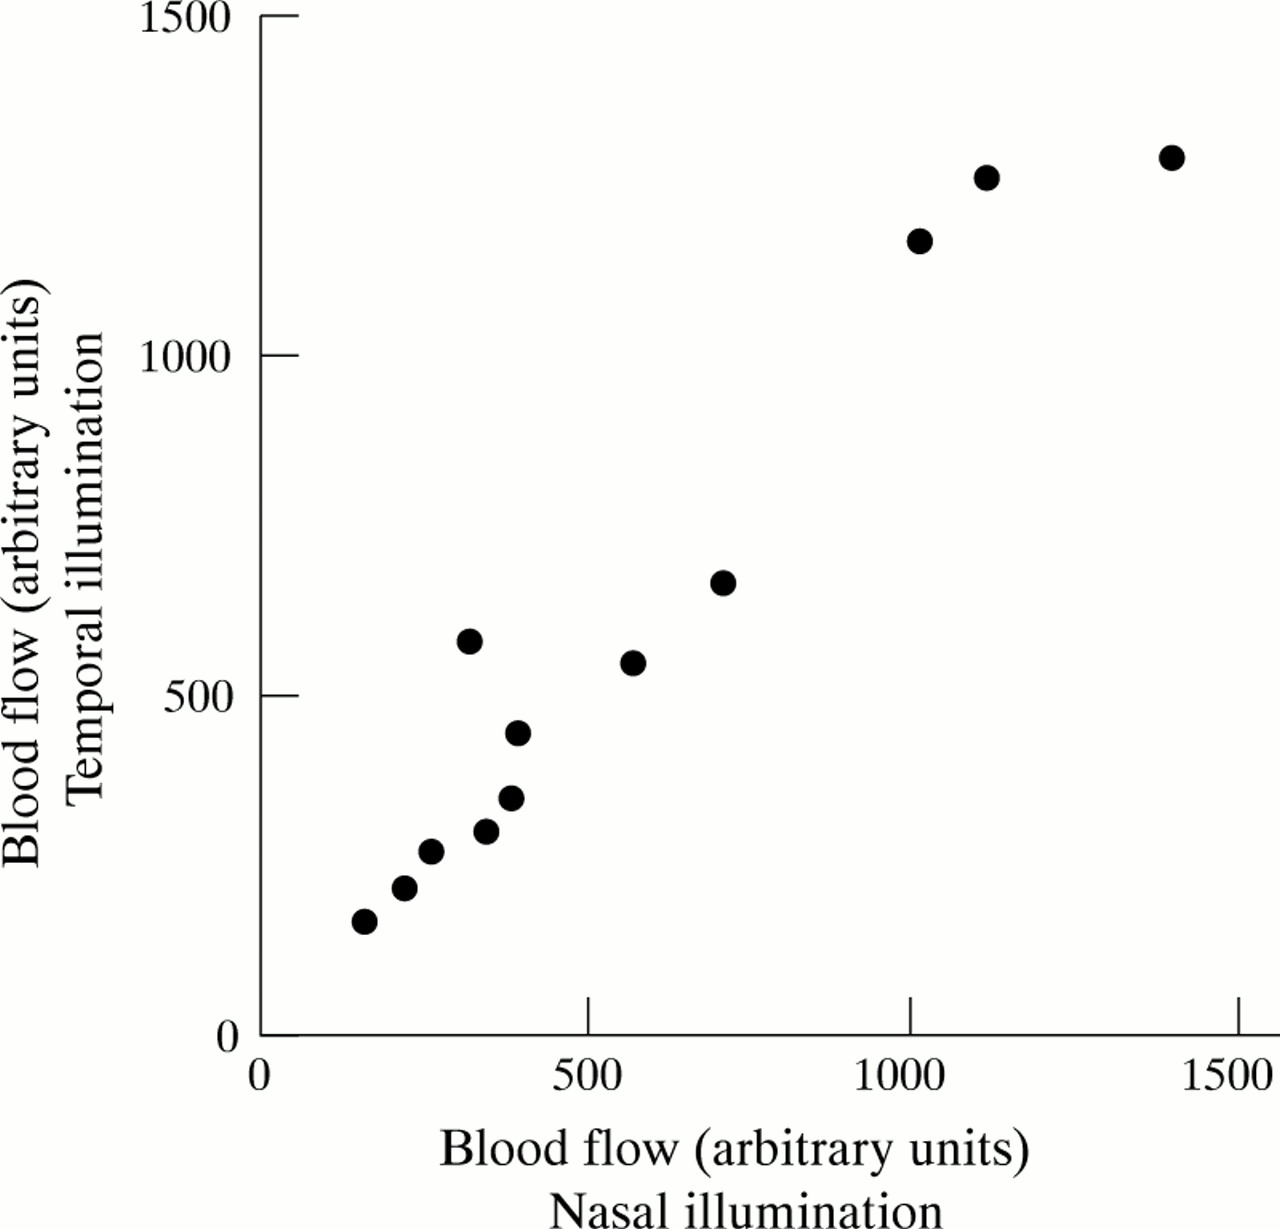
In 12 subjects, axial length from the cornea to the retinal surface averaged 24.0 (SD 1.5) μm, while dilated pupil size at the time of imaging averaged 8.83 (0.83) μm. These dimensions created an angle difference between temporal and nasal illumination that averaged 20.3 (2.2) degrees. Total blood flow at the same peripapillary retinal site (within 10 μm relative to the microvasculature) was independent of angle of incidence, averaging 569 (116) under illumination from the nasal edge of the pupil,v 597 (118) illumination from the temporal edge of the pupil (arbitrary units; mean (SD); p = NS). Individual values for blood flow under the two contrasted conditions are shown in Figure 1; nasal and temporal measurements were highly correlated (r = 0.97; p < 0.0001).

Individual values (n = 12) for total blood flow (in arbitrary units) for two measurements within 10 μm (100 × 100 × 400 μm) under laser beam to fundus angles differing by 20.3 (2.2) degrees (∼90 and 70 degrees). Mean flow was identical under the two conditions of measurement, and the two values were closely correlated (r = 0.97; p < 0.0001).
EFFECT OF CAMERA DISTANCE
In 14 subjects, varying camera distance from 2 to 5 to 7 cm from the eye had no effect upon distances measured between branch points measured from the printed HRF reports: mean distances were identical at the three distances (p = NS), and distance measurements correlated closely between both the 2 and 5 cm measurements, and the 2 and 7 cm measurements (p < 0.0001 for each; correlation of 2 cm with 7 cm readings is shown in Fig 2A). In contrast, although mean total blood flow did not significantly change among the three camera distances, flow recordings showed increased random changes as distance increased. To illustrate, the correlation of individual flow values as measured at 2 and at 5 cm was weak (r = 0.76; p = 0.022); between 2 and 7 cm, the correlation was lost (p = NS: Fig 2B).

(A) Individual values for vessel length (as measured in μm on paper copy printed reports), at the same optic nerve head anatomical site, with the HRF camera placed either 2 cm or 7 cm from the corneal surface. The mean vessel length was identical at the two camera distances, and individual values were also closely correlated (p < 0.0001). (B) Individual values for optic nerve head blood flow, taken from the same matched locus, as determined using camera distances of 2 and 7 cm. Although mean flow in the group of 14 was unchanged, the correlation between values obtained at the two distance was lost (p = NS).
INTRASESSION REPRODUCIBILITY
In 20 subjects, intrasession velocity, volume, and total blood flow within a 100 × 100 × 400 μm sampling box were highly reproducible. Mean values for the two readings were identical; the correlation of the first reading with the second was very high (p < 0.001 for velocity, volume, and flow (Fig 3)); the coefficient of variation of repeated measures averaged 9.6% for volume, 6.5% for velocity, and 6.6% for total blood flow.
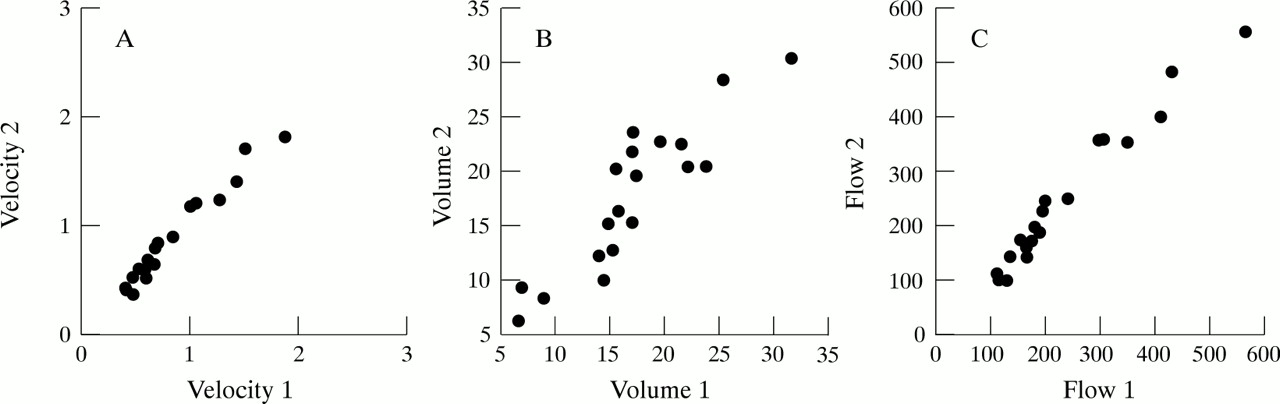
Intrasession reproducibility of peripapillary retinal perfusion variables (in arbitrary units) at a fixed anatomical site (100 × 100 × 400 μm ) in each of 20 individuals. (A) Individual blood velocity values; the coefficient of variation of repeated measures (sD) averaged 6.5% of the mean. (B) Individual blood volume values; sD averaged 9.6% of the mean. (C) Individual total blood flow readings; sD averaged 6.6% of the mean.
INTERSESSION REPRODUCIBILITY
100 × 100 × 400 μm box
Mean blood flow readings in 15 subjects from the same “small box” (10 × 10 pixel) peripapillary retinal site were similar week to week, averaging (in arbitrary units; mean (SD)) 286 (132) at week 1, 311 (151) at week 2, 316 (139) at week 3, and 314 (163) at week 4 (p = NS). However, the coefficient of variation of repeated measures was quite large, averaging 30.1% over the 4 week period; similar coefficients were obtained for volume and velocity. These coefficients were significantly larger than those obtained from intrasession measurements (p < 0.0001). The correlation of flow values week to week was poor; for example, there was a modest correlation of readings from week 1 to week 2 (r = 0.53; p = 0.03), but even this correlation was lost when individual week 1 values were compared with week 3 or week 4 (Fig 4).

Intersession reproducibility of optic nerve head blood flow at a fixed anatomical site (100 × 100 × 400 μm) in each of 15 subjects. Although mean flow was unchanged from weeks 1 to 4, individual measures failed to correlate from weeks 1 to 4 (p = NS), and the coefficient of variation of repeated measures (sD) averaged 30.1% of the mean over the 4 weeks of study.
Entire image
Mean blood flow in the entire image from the same 15 subjects was also unchanged from week to week, averaging 333 (64) (arbitrary units; mean (SD)) in week 1, 386 (90) in week 2, 348 (78) in week 3, and 361 (109) in week 4 (p = NS). These mean blood flow readings displayed a coefficient of variation of repeated measures (16.3%; Table 1) that was significantly smaller than that obtained from the small box (p < 0.001). The avascular fraction of the sample was unchanged week to week, though more variable than whole image mean flow (Table 1). The flow histogram, taken from the 4 week means from the 15 subjects, with pixels sorted using a bin width of 75 arbitrary flow units, is shown in Figure 5; the cumulative distribution of pixels is also shown in Figure5. Mean blood flow and the coefficients of variation of repeated measures of that flow as measured in pixels at various percentiles of the flow distribution (25th, 50th, 75th, 90th, 95th, 99th, 100th) are shown in Table 1; the coefficient of variation of repeated measures of the 25th, 99th, and 100th percentile pixel was greater than that measured at the 75th percentile (Table 1).
Reproducibilty of the flow histogram

Cumulative flow histogram from 15 subjects, with each subject’s data from each of four successive weekly recordings included. Histogram is organised with pixels sorted on the basis of flow; after the bin of zero flow, bin size is 75 arbitrary units of flow; data are plotted at midpoint of each bin (eg, 0–75 flow bin is plotted at 37.5 arbitrary units). The avascular zone (zero flow pixels) represents 15.3% of all pixels on average; the median flow pixel averaged 272 (55) (mean (SD)) arbitrary units of blood flow.
Discussion
The Heidelberg retinal flowmeter, when determining blood flow in a 100 × 100 × 400 μm box of peripapillary retinal tissue, provides results that are independent of the laser beam to fundus. In contrast, while camera distance from the eye does not alter the determination of interbranch point distance measurements, it does influence the measurement of blood flow. HRF recordings from the “small box” are highly reproducible in the short term, but while providing similar group means in long term studies generate highly variable individual results. Analysis of the entire image of tissue increases long term reproducibility, and provides information about avascular areas and the flow distribution of all pixels.
Previous studies confirm that HRF accurately measures a known blood flow in an artificial capillary tube (r = 0.97, p <0.000112), and provides results similar to those generated by commercially available laser Doppler flowmeters.12 These earlier studies also show that the method displays coefficients of reliability near 0.85 for acutely repeated volume, velocity, and flow measurements from default (100 × 100 × 400 μm ) sampling sites.10 Previous studies have not determined the role of laser incidence angle on blood flow measures. Because the HRF beam is focused to a 10 × 10 μm area, it is possible that minimal reflected light, combined with laminar capillary orientation within the retinal plane, could cause the cosine F term in the Doppler shift equation (Shift = 2 × ((velocity of blood)/(wavelength)) × cosine F) to have a specific value, much as it does when colour Doppler ultrasound imaging is applied to flow in an artery or vein. Although the retinal capillaries are arranged as flat networks in laminate fashion,14 and their orientation varies randomly within the retinal plane, light approaching the retinal plane still approaches these capillaries from a 90 degree angle, regardless of their X-Y orientation in the retinal plane. If insufficient scattered light does cause cosine Φ to have a specific value, then the HRF laser angle of incidence would affect the flow velocity, and hence the total blood flow, calculation. However, when the angle of incidence was varied from 90° to 70° within a normal healthy living human eye, velocity and flow results were identical; these different angles of incidence produce approximately a 20-fold difference in calculated velocity and flow if cosine F is presumed to vary with incident angle. This result then suggests that HRF examinations of the peripapillary retina are not confounded by insufficient scattered light. While angle of incidence may be varied without altering HRF recordings, camera distance from the eye, a factor not discussed in earlier descriptions of the device, does influence results. Because interbranch point distance measurements were independent of camera distance, varying distance produced no magnification errors. This result is expected since beams travelling between the HRF lens and cornea are parallel. Consequently, individual blood flow measurement variations were not due to optical distortion. Instead, it is possible that a reduction in signal to noise ratio could produce the observed results, occurring as the defocused iris is progressively more intensely illuminated as the camera moves further from the eye. The iris is perfused and would not systematically reduce or elevate measured volume or velocity; they would merely contribute increasing proportions of the signal as camera distance increases. These results emphasise the importance of passage though the pupil without interference from the iris, and, therefore, a pupil size of at least 3 μm. Reproducibility will also depend on a fixed, optimal camera distance for the HRF examination. Previous studies have also failed to address the question of intersession, as opposed to intrasession, HRF reproducibility.10 12 Our findings show that intersession variability from the default sampling boxes is very large; the coefficient of variation of repeated measures averages just over 30%. Such variability requires enormous sample sizes in long term comparative experiments.13 For example, in a typical paired experiment using two tailed tests at p <0.05 and requiring 80% power, detection of a 15% change in blood flow would require 34 subjects.13 In contrast, mean flow from the entire image is significantly less variable, generating the same power from only 11 people.13 In practice, owing to elimination of areas containing large vessels, and areas poorly focused, about 1200 pixels per examination were analysed. This sample, while representing only about 7% of the image, includes about 12 times as much data as is represented in the default 100 × 100 × 400 μm box. Our results suggest that the default small box is an inadequate representation of the image, at least over anything except the very short term.
The failure of the small default sized box to display similar reproducibility in the short and long term, when anatomically they are placed within 10 μm relative to the microvasculature, suggests that perfusion of such small areas may vary widely over time. In fact, the 100 × 100 × 400 μm volumes appear to contain, on average, perhaps 2–4 capillaries within their visible superficial layer. Variation in individual capillary perfusion, within a larger capillary bed that is receiving constant overall perfusion, is an established phenomenon in a number of tissues.14 Perhaps a third or a quarter of capillaries may be perfused at a particular time, while a shifting pattern of stop and go flow equalises flow over the entire network.15 A similar process ongoing within the normal peripapillary retina would provide the results seen in this study—highly reproducible volume, velocity, and flow over a few minutes, but much greater variability (at, however, constant group mean flow) over the long term.
The flow histogram contains information not available from either the default box or from image mean flow. Flow in pixels from the 50th through the 95th flow percentile was as reproducible as the image mean flow. In contrast, flow in the 25% percentile pixel was extremely variable, a result arising from the occasional inclusion of this pixel in the zero flow component of the histogram. Similarly, flow in pixels of greatest perfusion (99th and 100th percentile) also showed increased variation, the result of a few, or eventually just one, pixel of very high flow. Because the flow histogram contains information about “avascularity” and the distribution of pixel perfusion, in addition to information about mean flow, its clinical and research utility should be increased beyond that obtainable from the analyses that yield mean flow alone. For example, because areas registering flow measurements of zero were located between capillaries in areas of excellent focus, and since these zero flow readings are far below the levels of noise measurements made by the HRF,16 they could represent true zero flow areas devoid of blood vessels. One must remember that the HRF image is a two dimensional projection of a three dimensional vascular system. Currently, the true percentage of avascularity within tissue is only measurable using corrosion casting techniques. The “avascularity” variable available by counting pixels of zero flow is expected to increase as vessel density decreases. In precise terms, the zeros represent the number of 10 × 10 μm areas that pass through a tissue slice without encountering any vessels. As vessel density decreases, the number of clear paths through the tissue slice will increase.
Using the default analysis method, averaging 100 flow pixels, a count of the zero values contained in the area of interest is lost. This potentially useful variable is only available when flow pixel values are considered individually. It may be that certain disease processes, or treatment effects, are characterised by specific changes in avascularity (at, perhaps, constant overall flow), or in the distribution of pixels within ranges of low or high flow. These applications await use of the instrument in specific patient populations.
Acknowledgments
Supported in part by NIH Grant EY 10801 (AH), and by an unrestricted grant from Research to Prevent Blindness. Dr Harris is a recipient of the William and Mary Greve Award from Research to Prevent Blindness.