Article Text

Abstract
AIM To assess clinical variables and vitreous protein as risk factors for the development of postoperative proliferative vitreoretinopathy (PVR).
METHODS A prospective study was conducted on 140 patients with a rhegmatogenous retinal detachment in whom a primary vitrectomy was performed. 12 clinical variables were recorded and vitreous samples obtained for measurement of protein concentration. Univariate and multivariate logistic regression analysis was used to determine the risk factors for PVR.
RESULTS Complete data were available for 136 of 140 patients. 40 of the 136 patients (29.4%) developed postoperative PVR. Univariate regression revealed that significant (p<0.05) risk factors included aphakia, presence of preoperative PVR, size of detachment, the use of silicone oil, and high vitreous protein level. Multivariate regression analysis revealed only aphakia (odds ratio 2.72), the presence of preoperative PVR (odds ratio 3.01), and high vitreous protein concentration (odds ratio 1.11) to be significant (p<0.05) independent, predictive risk factors for the development of PVR.
CONCLUSIONS This study has shown that the significant risk factors for PVR are preoperative PVR, aphakia, and high vitreous protein levels. Two models (clinical factors only and clinical factors and vitreous protein) were constructed to predict the probability of developing postoperative PVR and may be used to identify those at risk for possible intravitreal pharmacological treatment.
- proliferative vitreoretinopathy
- vitrectomy
Statistics from Altmetric.com
The success rate of retinal detachment surgery has now reached over 90%. The major cause of failure is attributable to the development of proliferative vitreoretinopathy (PVR).1 2It is a complex process comprising events that are similar to those of the wound healing response with inflammation, migration and proliferation of a variety of cells.3-5 To improve the prognosis of retinal detachment surgery recent research has focused on the use of intravitreal pharmacological agents to prevent the occurrence of PVR,6-12 although none of these agents is used routinely in clinical practice owing to concerns about retinal toxicity. However, if risk factors for the development of PVR could be identified, these potentially toxic intravitreal treatments could be targeted at those patients at greatest risk. A similar principle is used to maximise efficacy and minimise side effects of antiscarring therapy in glaucoma filtration surgery.13
Many studies have investigated and identified a number of clinical risks factors for PVR. These include preoperative vitreous haemorrhage,14-16 PVR at presentation,15 17 18 aphakia,16 19 large retinal break,16 20 use of cryopexy,18duration of detachment,16 the presence of choroidal detachment preoperatively,17 18 horseshoe tear,16 20 and the use of silicone oil.21 22 However, results from these studies are often contradictory and inconclusive. Girard et al 17 cited that the reason is partly due to “the absence of a clear distinction between preoperative and postoperative PVR and to the use of quantitative methods of statistical analysis”. To this, we believe, may be added the unavoidable bias of retrospective studies.
We have conducted a prospective study to identify the risk factors for the development of PVR in patients undergoing a primary vitrectomy. Primary vitrectomy was defined as the first operation for the retinal detachment in that eye; eyes that had undergone a previous scleral buckling procedure or vitrectomy were excluded. This study population was chosen because intraocular access is part of the operation, and the benefit:risk of instillation of intravitreal treatments is most favourable in these patients. We studied both clinical variables and protein levels in the vitreous. The risk factors were analysed using univariate and multivariate logistic regression.
Materials and methods
A total of 140 consecutive patients with rhegmatogenous retinal detachment in whom primary vitrectomy was considered necessary for a number of reasons including giant retinal tear, posterior retinal break, the presence of preoperative PVR, and media opacities were enrolled into this prospective study between January 1995 and February 1996. Eyes with the following conditions were excluded: previous surgery for the retinal detachment—for example, scleral buckling or vitrectomy; concurrent eye conditions—for example, infection; patients on steroid treatment, topically or systemically; penetrating eye injury, history of blunt trauma to eye, and history of intraocular eye surgery within 6 months before enrolment. The above criteria served to exclude eyes that could introduce confounding factors into the study. Informed consent was obtained from all participating patients.
PREOPERATIVE ASSESSMENT
A medical and ophthalmic history were taken and examination performed on all patients. Specific attention was paid to the risk factors under investigation, which included age, duration of symptoms, degree of myopia, preoperative lens status (“phakia” or “aphakia”: eyes, including pseudophakic eyes, with intact posterior capsules were classified as “phakia”; eyes, including those which were pseudophakic, that did not have intact posterior capsule were classified as “aphakia”), preoperative use of cryotherapy/laser, presence of preoperative PVR, presence of preoperative uveitis, presence of preoperative vitreous haemorrhage, size of detachment and preoperative macula status (detached or not) (Table 1). Preoperative PVR was considered present if there was greater than 1 clock hour, grade C PVR in the updated version of the Retina Society classification.23
Frequency data on clinical risk factors
INTRAOPERATIVE AND FOLLOW UP ASSESSMENTS
Details of the procedures during the operation were recorded for each patient, including the use of cryotherapy and the type of tamponade employed. The patients were followed up for a minimum of 3 months and assessed for:
- (1)
the status of the retina and the development and grade of PVR, if any
- (2)
the development of complications including cataract, glaucoma, iatrogenic breaks, infection, vitreous haemorrhage, and hyphaema
- (3)
details of further operations, if any.
Postoperative PVR was defined as either the presence of new PVR of greater than 1 clock hour of grade C PVR in a detached retina after the vitrectomy or, in a successfully attached retina, new clinically visible periretinal membranes or bands of greater than 1 clock hour. Any new visible macular epiretinal membrane (macular pucker) was also considered to be positive PVR. A successful outcome was defined as a completely attached retina without an internal tamponade at the last follow up.
COLLECTION, STORAGE, AND ASSAY OF VITREOUS PROTEIN
At the beginning of the routine three port pars plana vitrectomy, a vitreous sample was collected using the vitreous cutter without an infusion to prevent dilution of the sample. The samples were placed into siliconised Eppendorfs (Sigma, Poole), immediately frozen and kept at −70oC for protein level analysis.
The total protein concentration of the vitreous samples was measured using the Bio-Rad Protein Microassay (Bio-Rad, Herts). This colorimetric assay utilises a solution of cupric ions which forms a copper/protein complex (coloured compound) with the protein. This method was chosen as it allows the rapid screening of multiple small volume vitreous samples and results are obtained within 45 minutes.
DATA HANDLING AND STATISTICAL METHODS
All statistical analyses were carried out using the computer software program spss for Windows Release 6.0 (SPSS Inc, Chicago, USA). The two tailed independent samplet test was used to analyse the results of protein level in the vitreous. The forward stepwise logistic multiple regression analysis was used to analyse the protein and clinical risk factors together to predict the risk of developing of postoperative PVR. This method of analysis involves developing a mathematical model that uses a combination of the values of a group of explanatory variables (protein levels and clinical risk factors) to predict the value of a dependent variable (postoperative PVR). Initially, the risk factors were analysed in a univariate analysis then the multivariate logistic regression analysis was used to reveal independent risk factors. Multivariate analysis was first applied to the clinical data alone and then to clinical data and protein level combined.
Results
PATIENT PROFILE
Complete data were available for 136 out of 140 patients. Four patients were lost to follow up because of transfer of care to other hospitals or non-attendance at follow up clinics. Of the 136 patients, 94 were male and 42 were female. The mean age was 59 years (range 16–86 years). The patients were followed up for at least 3 months with a mean follow up time of 8.3 months. Table 1 shows the clinical risk factors and the frequency of occurrence. Eyes with previous cryotherapy or laser were subdivided into two groups, treatment within or longer than 3 months previously. A 3 month cut off point was chosen because it was felt that the effect of cryotherapy or laser treatment would have settled after 3 months.
CLINICAL RESULTS
In all, 40 of the 136 patients (29.4%) developed postoperative PVR. Table 2 shows the association between the presence of preoperative PVR and the development of postoperative PVR. A significantly higher (p<0.05) proportion of patients with preoperative PVR developed postoperative PVR.
Relation between preoperative and postoperative PVR
The rate of successful outcome (complete anatomical retinal reattachment) was 78.7%. Silicone oil was used in 40 of 136 eyes and was subsequently removed from 24 eyes. Silicone oil was left in the remaining 16 eyes where it was felt that removal may have resulted in a redetachment. These cases were categorised as failure. Table 3 shows the outcome in relation to the presence of preoperative PVR. The rate of successful outcome was significantly higher (p<0.05) in patients with no preoperative PVR compared with those with preoperative PVR. The relation between postoperative PVR and outcome is shown in Table 4. A successful outcome was achieved in a significantly higher proportion (p<0.05) of eyes that did not develop postoperative PVR compared with those that did.
Relation between preoperative PVR and surgical outcome
Relation between postoperative PVR and surgical outcome
Presenting visual acuity and visual acuity at last follow up are shown in Figure 1. At the last follow up, 83 patients (61.0%) had improved visual acuity; 24 patients (17.7%) had worse visual acuity than preoperatively; while 29 (21.3%) had no change in visual acuity. Table5 shows the final visual acuity of the successful cases (n=107) classified into those who had preoperative PVR and those who did not. A significantly higher proportion (p<0.05) of patients achieved a visual acuity of 6/60 or better in the non-preoperative PVR group. The final visual acuity of successful cases (n=107), classified into those who developed postoperative PVR and those who did not is shown in Table 6. A significantly higher proportion (p<0.05) of patients achieved a visual acuity of 6/60 or better in the non-postoperative PVR group.

Scatter plot (sunflower) of visual acuity. CF = counting fingers, HM = hand movements, Pl = perception of light, NPL = no perception of light. Each sunflower petal represents one case.
Preoperative PVR and final visual acuity in successful cases (n=107)
Postoperative PVR and final visual acuity in successful cases (n=107)
VITREOUS PROTEIN
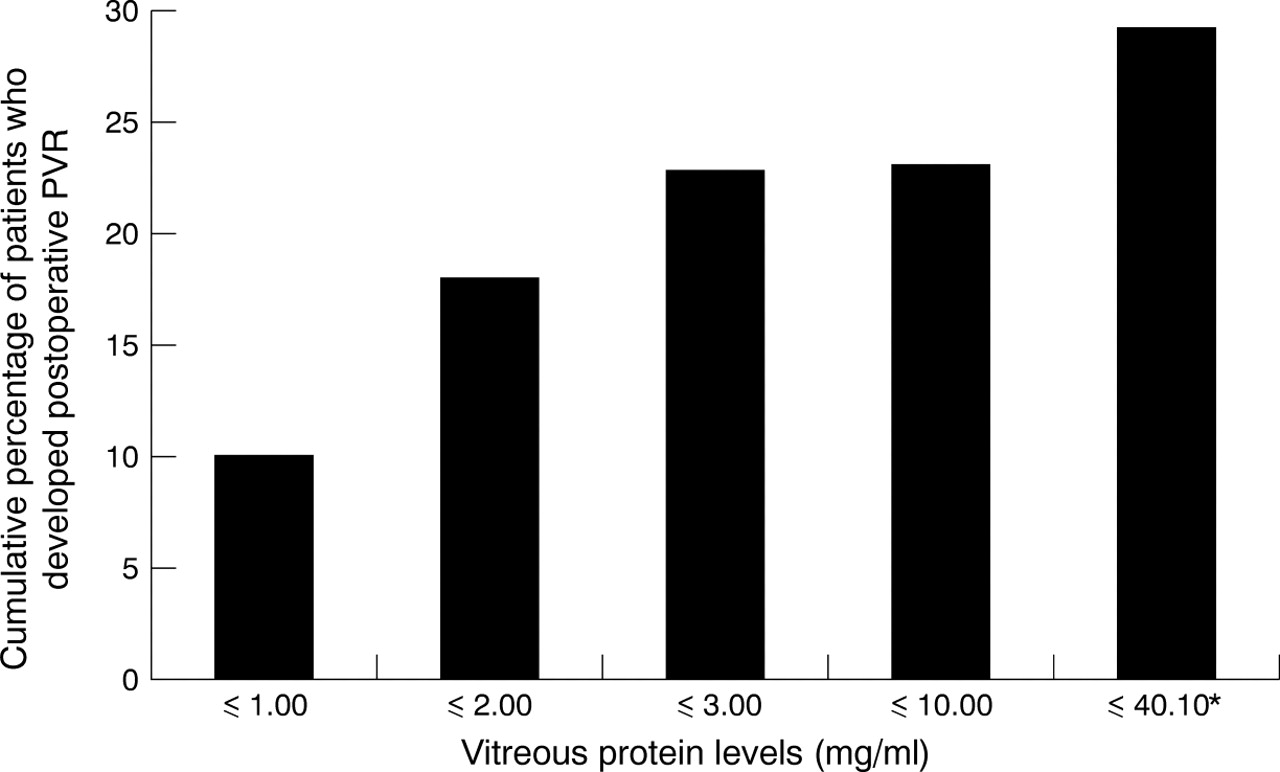
The mean protein concentration (with 95% confidence interval) was significantly higher (p<0.05) in patients who had preoperative PVR (5.72 mg/ml (3.68–7.76)) compared with those who did not (2.89 mg/ml (1.96–3.82)). The mean protein concentration was also significantly higher (p<0.05) in patients who developed postoperative PVR (6.83 mg/ml (4.57–9.16)) compared with those who did not (2.81 mg/ml (1.87–3.75)). The cumulative percentage of patients developing PVR and its relation to vitreous protein is shown in Figure2.
Cumulative percentage of patients who developed postoperative PVR and the relation to vitreous protein. *Highest level of vitreous protein detected.
RISK FACTOR ANALYSIS
Univariate analysis
Analysis of individual factors in a univariate regression revealed that significant (p<0.05) risk factors included “aphakia” (all eyes in this group did not have an intact posterior lens capsule including pseudophakic eyes), presence of preoperative PVR (>1 clock hour, grade C PVR), size of detachment, the use of silicone oil, and high vitreous protein level.
Multivariate analysis of clinical risk factors
Multivariate logistic regression analysis on the clinical data revealed only “aphakia” and the presence of preoperative PVR to be significant (p<0.05) independent, predictive risk factors for the development of PVR. Table 7 shows the estimated coefficients and the odds ratios for the significant clinical risk factors. Based on the above estimated coefficients, the logistic regression equation of the probability of developing PVR was worked out which would allow quantification of changes in risk in relation to clinical status.
Estimated coefficients and odds ratios for the significant clinical risk factors
Estimated probability of developing PVR =
1/(1+e1.7802–1.1408(aphakia) − 1.2302(preop PVR))
In the equation, a value of 1 is entered for aphakia and 0 is entered for phakia. If preoperative PVR is present, a value of 1 is entered with 0 entered for no preoperative PVR. It is estimated that when the lens status (preoperatively) changes from phakia to aphakia, the odds of developing PVR are increased by 3.13 times. The presence of preoperative PVR increased the odds by 3.42 times.
Multivariate analysis of clinical risk factors and vitreous protein
Multivariate logistic regression analysis of the clinical data and protein level revealed that “aphakia”, the presence preoperative PVR, and high vitreous protein level were significant (p<0.05) independent, predictive risk factors for the development of PVR. Table8 shows the estimated coefficients and the odds ratios for the significant risk factors. Table 9 shows the statistical values for non-significant factors.
Estimated coefficients and odds ratios for the significant clinical risk factors and vitreous protein
Statistical values for non-significant factors
Estimated probability of developing PVR =
1/(1+e2.0918–0.9993(preop PVR) − 1.1029(aphakia) - 0.1029(protein))
In the equation, if preoperative PVR is present, a value of 1 is entered with 0 entered for no preoperative PVR. A value of 1 is entered for aphakia and 0 is entered for phakia. Protein is entered in mg/ml. It is estimated that in the presence of preoperative PVR, the odds of developing postoperative PVR are increased by 2.72 times. When the lens status (preoperatively) changes from phakia to aphakia, the odds of developing PVR are increased by 3.01 times. For each mg increase in the protein level the odds are increased by 1.10 times.
Discussion
This prospective study has shown that PVR (presence preoperatively and development postoperatively) has an adverse effect not only on the surgical outcome but also on the final visual acuity achieved in successful cases. Using multifactorial analysis, the study has also shown that significant risk factors for the development of postoperative PVR are preoperative PVR, aphakia, and high vitreous protein levels.
The existence of preoperative PVR suggests that the cellular, extracellular, and chemical elements required for wound healing are present. It is therefore not unreasonable to expect preoperative PVR to be a risk factor for the development of postoperative PVR. Girardet al's retrospective study of preoperative PVR grades B and C1 found only grade B but not grade C1 preoperative PVR to be a significant risk factor.17 They hypothesised that grade B PVR may represent an immature form of PVR with a definite potential for progression, whereas grade C1 PVR may represent a spontaneously arrested, non-evolutive form of the disease. Our study did not evaluate grade B PVR as a risk factor as most patients with grade B PVR did not require vitrectomy and therefore the number of patients enrolled was small (n=9). However, we found grade C PVR involving more than 1 clock hour to be a significant risk factor. Although this contrasts with Girard et al's findings, the two studies are not directly comparable as our study was prospective, used different PVR gradings, and included only patients undergoing vitrectomy.
Chignell et al 19described aphakia as one of the significant preoperative factors contributing to failure of retinal detachment surgery. They cited that the majority of failures were due to inaccurate preoperative assessment (for example, failure to observe holes) and that this was particularly true for aphakic eyes where small holes in the periphery were difficult to identify and thus remained untreated. They revealed that reattachment surgery failed in 53 (11.7%) eyes despite repeated operations; 37 (69.8%) of these failures had developed postoperative PVR and in this group, 12 (32.4%) eyes were found to be aphakic. Yoshino et al 16 also found that among others, aphakia was a risk factor for the development of postoperative PVR. Other studies,17 24 however, did not find aphakia to be a risk factor. The pathological mechanism by which aphakia could be related to the development of PVR is unclear. However, the breakdown of blood-ocular barrier may be significant.16 Miyake25 26 found that there was more disruption to the blood-retinal barrier after intracapsular compared with extracapsular cataract extraction. Miyakeet al also found that the outward active transport of fluorescein from the vitreous was reduced in aphakic compared with phakic eyes.27 They suggested that the posterior lens capsule may protect the anterior uvea (site of active transport) from mechanical and physical irritation by the vitreous gel. It is also possible that the intact lens provides a physical barrier for transmission of inflammatory cytokines from the anterior chamber to the vitreous cavity.
The disruption of blood-retinal barrier would, in theory, allow serum factors—for example, fibronectin, to enter and remain in the vitreous and may enhance the development of PVR. We have classified pseudophakia without an intact posterior capsule (for example, capsular dehiscence during cataract surgery) as “aphakia” because we believe that the posterior capsule has an important role in the blood-retina barrier irrespective of the presence of an intraocular lens.
The total protein level represents the sum of all the detectable proteinaceous components in the vitreous and therefore does not provide specific information regarding individual enzymatic or cytokine activity. Nevertheless, the total protein level can provide information on the state of inflammation, breakdown of blood-retinal barrier and the severity of wound healing. In our study, significantly higher (p<0.05) protein levels were found in the vitreous of eyes with preoperative PVR compared with those without (mean of 5.72 mg/mlv 2.89 mg/ml). This finding is in agreement with previous studies3 28 although the difference in protein level between the PVR and non-PVR groups in our study is smaller. Connor et al 28 found a fivefold increase, Kauffmann et al 3 found a threefold increase, while our study only found a twofold increase. As far as we are aware, there is no report in the literature relating vitreous protein concentration to the development of postoperative PVR. In our series the mean concentration of vitreous protein was significantly higher in those patients who developed postoperative PVR compared with those who did not (mean of 6.83 mg/ml v 2.81 mg/ml) and for each mg increase in the protein level the odds of developing PVR is increased by 1.10 times.
Two statistical models were constructed to predict the probability of an individual patient developing PVR. The first model used the clinical risk factors alone while the second included both the clinical risk factors and the vitreous protein level. As with any statistical model, it is often difficult to determine the efficiency of the model in predicting the risk. Ideally, a further prospective study applying the findings discussed above would be required to test the efficiency of the model. However, a less ideal method of assessing the “goodness of fit” of the model was used in this study. This method compared our predictions with the observed outcome from the original data. A probability cut off value of 0.5 was chosen for the development of PVR. A patient is predicted to develop postoperative PVR if the calculated probability is above 0.5 and predicted not to develop PVR if it is lower than 0.5. Using this method, our first model (clinical risk factors alone) correctly predicted the outcome in 72.8% of patients. The second model (combined clinical risk factors and protein level) correctly predicted the outcome in 76.5% of the patients. Therefore, although the clinical risk factor model can be helpful in identifying those at risk, the combined model has a greater predictive value.
The identification of these risk factors in our group of patients (primary vitrectomy for retinal detachment) is of particular practical importance. As intraocular access forms part of the operation, those at risk can receive intravitreal instillation of pharmacological treatment without the need for further procedures.
At present, the measurement of protein concentration in the vitreous in our laboratory can be achieved within 45 minutes. If this duration could be shortened, this would allow measurement of vitreous protein concentration during the operation. The result, together with clinical information, may be used in our combined postoperative PVR model to identify patients at risk of developing PVR. The identification of these high risk patients is of vital importance if they are to be targeted for aggressive treatment and if improvements in success rate of retinal detachment surgery are to be achieved.
Acknowledgments
Research funded in part by the June Sutor research fellowship, Vitreoretinal Unit, Moorfields Eye Hospital, London, Moorfields Trustees, Moorfields Eye Hospital, London, and International Glaucoma Association, London.