Article Text

Abstract
AIM To examine the relation between three measures of visual function (distance acuity, near acuity, and contrast sensitivity) and specific fluorescein angiographic characteristics of the macular lesion in patients with subfoveal choroidal neovascularisation (CNV) due to age related macular degeneration (AMD).
METHODS Visual evaluation and digital fundus fluorescein angiography were performed in 93 patients with subfoveal CNV. Standard morphometric techniques were used on two frames from the angiographic series closest to 30 seconds and 60 seconds respectively, to ascertain total lesion size (defined as the entire area of abnormal fluorescence), the size of the classic component, and the distance from the fovea to the closest point of healthy retina. Correlations were sought using Pearson's correlation coefficients. Stepwise regression was used to minimise multiple colinearity.
RESULTS When the study eye was the better eye of a patient's pair of eyes, the strongest correlation was between the size of the classic component and contrast sensitivity (r= 0.48, p <0.001) and was highly significant. When the study eye was the worse eye, significant correlations were observed between total lesion size and all three measures of visual function. The strongest correlation was observed between overall lesion size and contrast sensitivity (r = 0.52, p <0.001).
CONCLUSIONS This study has shown that the status of the study eye (that is, better or worse eye of a pair of eyes) influences the impact of macular pathology in AMD on visual function. The distance of the fovea from healthy retina was found to be an important factor in predicting visual function.
- fluorescein angiography
- visual function
- age related macular degeneration
Statistics from Altmetric.com
Age related macular degeneration (AMD) accounts for the majority of individuals with severe visual disability in Western societies. The exudative form, the hallmark of which is neovascularisation from the choroid into the subpigment epithelial and subretinal spaces, is associated with severe visual loss. The accumulation of serous fluid, exudate, and/or blood at the level of the outer retina, loss of photoreceptors and retinal pigment epithelium (RPE), fibrosis, and disruption of the anatomical relation between photoreceptors, RPE, Bruch's membrane, and choroid are factors which are not compatible with optimal central vision.
In clinical practice, visual acuity is seen to vary markedly in eyes with wet macular degeneration. Lesions located completely outside the foveal avascular zone (FAZ) are usually associated with good visual acuity. When the lesion involves the FAZ, vision is often worse, yet a wide range of acuity may be observed.1 Some studies have noted that other factors adversely affect vision and these include the presence of blood and/or fibrosis, and the nature of the neovascular complex whether classic or occult.2-4 However, the relation between visual function and factors such as total lesion size, extent of classic or occult neovascularisation, and the distance from the fovea to the nearest point of healthy retina have never been formally evaluated. The present study examined the relation between measures of visual function (distance acuity, near acuity, and contrast sensitivity) and specific morphological characteristics of the macular lesion in patients with subfoveal choroidal neovascularisation (CNV) due to AMD.
Subjects and methods
Institutional review board approval was granted for a major study of patients with AMD. The patients recruited into the study were those attending ophthalmology clinics at the Royal Group of Hospitals, Belfast, for assessment between 1996 and 1998. Criteria for inclusion into the present substudy were (a) the presence of subfoveal CNV confirmed by angiography, (b) the absence of significant lens opacification as assessed by biomicroscopy, (c) angiography within 14 days of visual function assessment, and (d) informed consent had been given.
All patients underwent refraction with measurement of central visual function in each eye using a standardised protocol.5 This included distance visual acuity (ETDRS), near visual acuity (Bailey-Lovie near reading types), and contrast sensitivity (Pelli-Robson). Patients were examined by slit lamp biomicroscopy and any individual with clinical evidence of exudative AMD in the presenting eye (study eye) was selected for colour fundus photography and fluorescein angiography. These were performed using an OIS digital angiography system (Sacramento, CA, USA). Angiograms were printed to a standard magnification on glossy photographic quality paper using a Kodak XLS 7700 digital printer.
MEASUREMENTS OF LESION SIZE
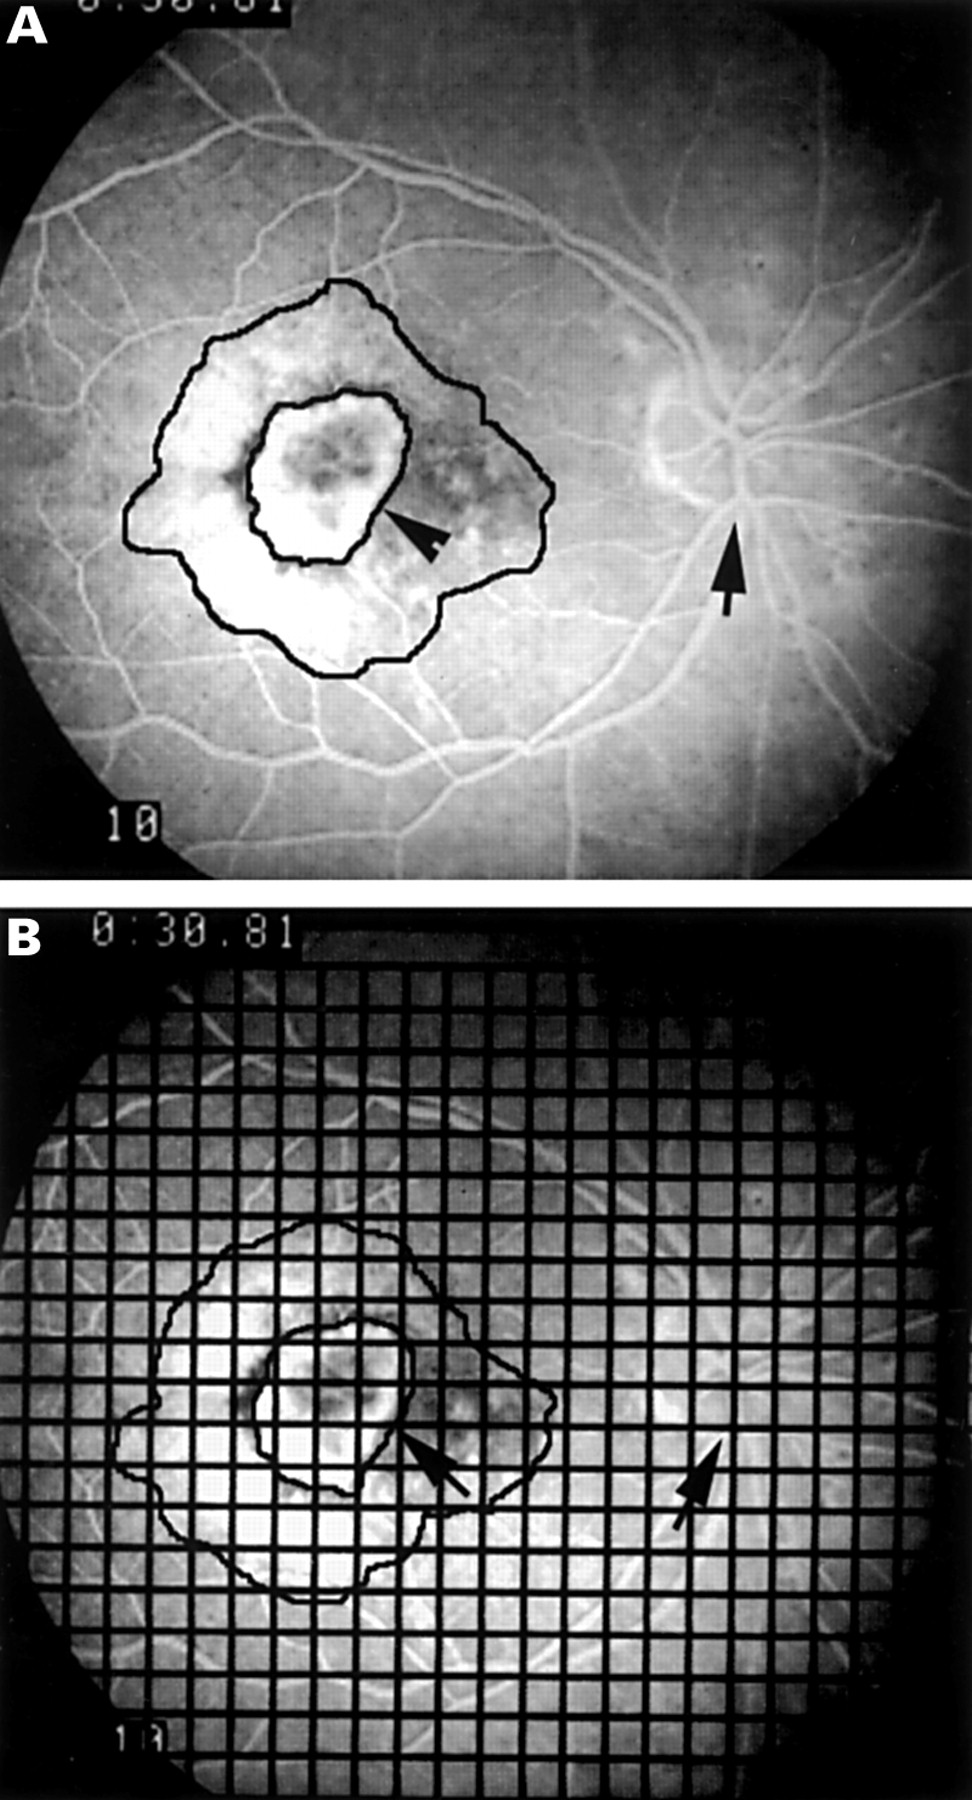
Measurements were made on two frames, those closest to 30 seconds and 60 seconds into the angiographic sequence. The diagnosis of a classic CNV depends on the demonstration of a change in the area of leakage over time. While in younger individuals this change would be detectable before 30 seconds, in older individuals with slower circulatory times, it was felt prudent to choose frames closest to 30 seconds and 60 seconds after injection for the purposes of making measurements. The angiographic protocol specified the capture of sets of stereo pairs at 30 seconds and 60 seconds, and thus image capture at these two time points was consistent. A number of angiographic parameters were recorded at each of the two time points. These included the total extent of lesion (which was defined as the total area of abnormal fluorescence), the area of the classic component, the position of the fovea, and the distance from the fovea to the closest point of healthy retina. To measure these parameters, a sheet of acetate was placed over the chosen angiographic frame and the outline of the lesion traced (Fig 1A). Stereoscopic magnifiers were used to assist in the recognition of the outline. The area of increasing leakage, which was well defined in the early frames, was traced separately at both time points, and by definition was called the classic component. Other studies have localised the fovea in angiograms by the use of vascular landmarks and defined it as the centre of the avascular zone and this was the method used in our analysis. We outlined the FAZ from a relevant frame of the angiogram using a light box and stereoscopic magnifiers to identify the tips of the vessels forming the foveal arcade which were then marked on an acetate sheet which contained the tracing of the lesion. These marks tended to form an oval-shaped outline which was the boundary of the FAZ and the fovea was taken as the centre of this region. In three of our patients the macular landmarks were fully obscured and thus it was not always possible to obtain the foveal location using this method. Therefore we used a method in which we arbitrarily defined the fovea relative to the optic disc. The diameter of the optic disc (OD) was measured on 40 angiograms printed to a standard magnification and the mean found to be 7.97 (SD 0.46) mm. A point two disc diameters (16 mm) temporal from the 6 o'clock position on the superior rim of the inferior margin of the OD was chosen to represent the geometric centre of the fovea. For the purposes of this study the presence of blood and fibrous tissue were noted but not quantified.

(A) Fluorescein angiographic image showing a mixed choroidal neovascular membrane with classic and occult components. The components are outlined and the arrows indicate 6 o'clock position on optic disc and margin of the outlined classic component. (B) As in (A) with 2 mm grid superimposed to facilitate counting of intersections overlying the areas of interest.
The areas of interest (Fig 1B) were measured using standard morphometric techniques.6 The traced outline of the lesion overlaid by the 2 mm2 grid was placed on an illuminated light box. The number of intersections overlying the area of the entire lesion were counted. Next the number of intersections within the area outlining classic CNV were counted. The distance from “fovea” to healthy retina was measured in mm using calipers along a straight line drawn to the closest point of apparently uninvolved retina. Two measurements were obtained, one at each time point. Although the measurements made on the angiograms represented markedly magnified structures, no attempt was made to convert data into exact measurements.
It was possible that the size of the printed image could vary because of the refractive error of the patient. The spherical equivalent was therefore calculated from the refraction for the 93 study eyes. Of the eyes included in the study, 4% had a myopic error (range −0.5 to −2.0 D), 16% were emmetropic (−0.49 to +0.49 D), and 80% were hypermetropic (range +0.5 to +9.0 D). The mean of the refractive error for the entire group was +1.92 D. Only 5% of eyes had a hypermetropic error of more than +5.00 D. To assess the impact of refractive error on the final magnification of the photographic image of the fundus, emmetropic volunteers were fitted with contact lenses (power ranging from −9.00 to +8.00) and their optic discs photographed. Analysis using identical morphometric methodology to that used to measure CNV area confirmed that there was no detectable change in the area of the printed image of the optic disc with a change of 5.0 D in either direction. A change in the refraction by 8.0 D resulted in minimal change in image size (plus or minus 7.5%).
STATISTICAL METHODS
All data were entered into a database and analysed using a standard statistical software package (spss). A one way analysis of variance was used to examine reproducibility of measurements between the two investigators who analysed the angiograms.
The t test for paired samples was used to test for significance in differences between the measurements made on the 30 second and 60 second angiographic frames.
The degree of association between the three measures of vision (distance acuity, near acuity, and contrast sensitivity) in the study eye and each of the angiographic parameters (total lesion size, size of classic component, and distance to healthy retina all measured at 30 and 60 seconds into the angiographic sequence) were sought using Pearson's correlation coefficient. As multiple comparisons were involved, coefficients were only considered significant at the 1% level or lower (p <0.01).
To investigate the possibility that the three measures of visual function might be related to a combination of angiographic parameters and to limit colinearity, stepwise regression was used to examine the association between measures of acuity (dependent variables) and angiographic measurements (explanatory variables).
In order to ascertain whether the associations were modified by the status of the study eye, in terms of whether it was the patient's better or worse eye, the analyses were also performed with the data subdivided into two groups—namely, data from better eyes and data from worse eyes. In one subject the two eyes showed identical function with respect to all three measures of vision and was thus excluded from this part of the analysis. The t test for independent means was used to examine for differences when the data (measures of visual function and angiographic measurements) were subdivided according to whether the study eye was the better or the worse of the pair of eyes.
Results
Ninety three of the 96 patients evaluated were found to fit all the criteria for inclusion (in two patients the time from visual measurement to angiography was in excess of 14 days and one patient did not in fact have a choroidal neovascular membrane). Thus, 93 study eyes constitute the study population.
In the 93 study eyes visual evaluation and angiographic recording were carried out on the same day in 90% and within 14 days of each other in the remainder. The results of visual function testing for study eyes is summarised in Table 1. The t test for independent means showed that there were no significant differences in visual acuity measures when subjects were grouped by the status of the study eye—that is, better or worse eye (p >0.05). Thus, better eyes had no better vision than worse eyes as a group. In the case of near visual acuity the test was performed after log transformation of the variable.
Vision in better and worse eyes
The interquartile range of the measurements made at 30 and 60 seconds into the angiographic sequence (that is, total lesion size, the size of classic and the distance from the fovea to healthy retina) are shown in Table 2 for better and worse eyes. These measurements were not significantly different when subdivided according to whether the study eye was the better eye or worse eye.
Morphometric analysis
ALL EYES
When data from all eyes were analysed, only the size of the classic component differed significantly between the 30 second and 60 second frames (t = 4.06, p <0.001). Total lesion size and distance of fovea to healthy retina did not change significantly between the 30 second and 60 second frames. Therefore, measurements entered into the subsequent analysis were total lesion size at 30 seconds, distance to healthy retina at 30 seconds, and area of classic component at 30 and 60 seconds.
Significant associations were found between each of the angiographic parameters of total lesion size, size of classic component at 30 seconds and 60 seconds, distance to healthy retina, and each of the visual function measures (Table 3). Stronger associations were found with the angiographic parameters of lesion size (total and classic) and contrast sensitivity than with distance or near acuity. Overall, the coefficients were low and the best coefficient of 0.37 was seen between total lesion size and contrast sensitivity in the study eye.
Correlation coefficients between measures of visual acuity and angiographic parameters
The logMAR scale on which distance and near visual acuity are measured results in a higher value with worsening vision. Correlations observed between acuity and angiographic parameters were positive showing that worse acuity is associated with larger lesion sizes. Contrast sensitivity is measured on a scale where the higher the contrast the better the visual function. The correlations observed between contrast sensitivity and angiographic parameters were negative showing that smaller lesion sizes were associated with better contrast sensitivity. In summary, larger lesion size, greater area of classic, and a greater distance to healthy retina were associated with poorer distance and near acuity and worse contrast sensitivity.
BETTER EYES
Examination of correlation coefficients showed that in the better eye group, the size of the classic component at both 30 seconds and 60 seconds was found to be significantly associated with all three measures of visual function (Table 3). Stepwise regression which minimises multicollinearity showed that in this group, only the association between the size of the classic component at 30 seconds and measures of visual function reached significance.
WORSE EYES
Examination of correlation coefficients in the worse eye group, showed that both total lesion size and distance to healthy retina were significantly associated with all three measures of visual function (Table 3). Stepwise regression revealed that in the worse eye group, only the association between the distance from fovea to healthy retina and measures of visual function reached significance.
There was no correlation between the size of the classic component and the distance from the fovea to healthy retina in either better or worse eyes.
Discussion
The present study has investigated the relation between measures of visual function and certain features of the macular lesion measured on angiographic frames taken at 30 seconds and 60 seconds in subfoveal choroidal neovascularisation. While no study has sought to examine such a relation in detail in patients with AMD, the incidental findings of some previous studies have suggested that macular lesion size does influence functions such as vernier acuity and reading in affected individuals.78 Veitzman et al8 have assessed the correlation between the diameter of the macular lesion and distance visual acuity and demonstrated that there was a linear relation with larger lesions associated with worse acuity. However, the study was carried out in young patients with toxoplasma chorioretinitis and the sole parameter measured was the linear diameter of the lesion as obtained from fundus photographs.
Weiter et al recognised the clinical importance of the location of a macular lesion.9 They examined the relation between best corrected distance visual acuity and a measure of the retinal distance from the fovea in 55 eyes of 45 patients with macular scars due to a variety of causes. The measurements were made relative to the patient's own optic disc measured in disc diameters and they excluded any eyes in which the FAZ could not be accurately located using recent or earlier photography. Their study showed that increasing distance from the FAZ to the apparently healthy retina correlated with decreasing visual acuity. The present study, while similarly identifying the distance from the fovea to the nearest point of healthy retina as an important factor, also found several others which influenced visual acuity and function.
Over the past few years we have been struck by the apparent disparity between macular lesion appearance and visual function in elderly patients with AMD. Scrutiny of the baseline characteristics detailing lesion size and acuity in the Macular Photocoagulation Study (MPS) of subfoveal CNV, also appear to support the lack of a consistent relation between visual function and the appearance of the macular lesion.7 The MPS study categorised patients into groups based on the size of the macular lesion (small lesions ⩽1 disc area), medium lesions (>1 to ⩽ 2 disc areas), and large lesions (>2 disc areas). For each category of lesion size a wide range of distance visual acuities was reported. Although this aspect was not commented upon in that publication, in fact 20% of patients with small lesions had acuities of less than 20/200 and conversely 23% of patients with large lesions had acuities better than 20/100. These findings imply that the size of the lesion alone is not the only predictor of acuity.
The present study has demonstrated that when all eyes were included in the analysis, the measures of visual function (distance acuity, near acuity, and contrast sensitivity) showed some correlation with those angiographic parameters describing the total size of the lesion, area of classic leakage, and the location of leakage with respect to the fovea. However, when eyes were subdivided into two groups depending on whether the study eye was the better or worse eye, significant differences were found in terms of the correlations observed. When the study eye was the better eye, only the size of the classic component was significantly correlated with measures of vision. When the study eye was the worse eye different associations were noted, with overall lesion size, closely followed by the distance to healthy retina, showing the strongest correlation with measures of visual function.
It is important to emphasise that better eyes and worse eyes were not significantly different in terms of measures of visual function. In each case the designation of better eye or worse eye was made relative to the patient's fellow eye. All study eyes showed active disciform disease and the mean visual acuity was 0.68 (20/100). The finding of strongest correlations when the study eye was the worse eye suggests that, when not completely depended upon, visual function in that eye is more closely correlated with the pathology observed in the macula. Whereas when the study eye was the better eye, the relation was less clear possibly owing to an interplay of psychophysical factors. One possible explanation may lie in the concept of retinal reserve. An eye may never reach its full potential unless forced to by loss of the fellow eye. This may have resulted in better than expected visual function for a given level of macular disease in the better eye group. In other words AMD lesions of similar morphology may have a different impact on visual function depending on whether the eye is the better or the worse of a pair of eyes. These findings have enormous implications for future studies of AMD particularly when considering patient selection for inclusion in clinical trials.
The methods employed for angiographic analysis in this study were limited in that only two frames from each angiogram were used for the acquisition of morphological data, measurements were performed manually, and involved labour intensive methodology. Also frames later than 60 seconds were not analysed as capture of angiographic information at 5 and 10 minutes were generally not carried out in all patients. We made no attempt to distinguish differences between abnormal fluorescence due to occult neovascularisation, retinal pigment epithelial hypopigmentation, or accumulation of fluorescein in the subretinal space. Nevertheless, we have been able to extract meaningful information from the angiograms over and above the qualitative descriptions normally used in clinical practice. It is possible that the advent of direct digital acquisition of angiograms will allow a more comprehensive quantitative assessment of CNV morphology and dynamics to be made. Further studies of the relations between these parameters and visual function may help us understand more fully the underlying pathological mechanisms.
Acknowledgments
The authors wish to thank Miss Moyra McClure (Senior Optometrist, Royal Hospitals, Belfast) for her assistance in performing the optometric evaluations. The financial support of the Medical Research Council, UK, is gratefully acknowledged.