Article Text

Abstract
AIM Accurate Heidelberg retina flowmeter (HRF) measurements require correct manual setting of the HRF photodetector sensitivity. The neuroretinal rim produces a weak signal relative to the peripapillary retina. A newly developed HRF alignment and sensitivity protocol, capable of accurate rim measurement, was investigated.
METHODS 18 eyes of nine healthy volunteers were examined by HRF. Three images of each eye were taken using three different imaging methods. Method 1: a conventional image (optic nerve head centred image with photodetector sensitivity optimised for the strong signal from the peripapillary retina); method 2: the setting of method 1 with photodetector sensitivity optimised for the weak signal from the rim; and method 3: the setting of method 2 with the temporal rim margin tangent to the lateral image border to remove the overpowering signal from the temporal peripapillary retina. The neuroretinal rim was defined by the Heidelberg retina tomograph (HRT). Blood flow and reflectivity values (DC component) in the rim area were compared for the three methods using pointwise analysis. Coefficients of variation of repeated measurements in 12 subjects have been calculated for method 3.
RESULTS The neuroretinal rim area measured by method 1 had a significantly lower brightness compared with method 2 and 3 (p=0.0002 and p=0.0002, respectively). Method 2 provided proper sensitivity for the weak signals of the rim area based on rim tissue DC values; however, this sensitivity setting was too high for the strong signal from the peripapillary retina. Method 3 avoided the strong peripapillary signal with the proper signal from the rim and provided significantly higher flow values of the rim area at 75 and 90 percentile pixels (p=0.0065 and p=0.0038 respectively) compared with method 2. Interobserver repeatability ranged from 16.85% to 21.96% for the different parameters.
CONCLUSIONS Method 3 provides an accurate and reproducible flow measurement of the neuroretinal rim area through proper sensitivity for the weak rim signal, alignment, and removal of the strong temporal signal from the image. This new method is recommended to improve accuracy of blood flow measurement in the neuroretinal rim.
- blood flow
- Heidelberg retina tomograph/flowmeter
- glaucoma
- laser Doppler
- neuroretinal rim
Statistics from Altmetric.com
The study of haemodynamics in ocular tissue has been of increasing interest in recent years. Accurate quantification of ocular blood flow is of major concern especially in chronic eye diseases such as diabetic retinopathy, age related macular degeneration, and possibly glaucoma, in which disturbances of the blood supply to the tissue are believed to be linked to disease progression. In glaucomatous eyes, perfusion status in the optic nerve head (ONH) and retinal nerve fibre layer is of high interest. Confocal scanning laser Doppler flowmetry with the Heidelberg retina flowmeter (HRF, Heidelberg Engineering, Heidelberg, Germany) is a non-invasive technique, which allows blood flow measurement in these specific areas. Several studies have demonstrated the reliability of the HRF in vitro and in vivo.1-5 Recently, several studies using HRF reported that blood flow in the peripapillary retina and neuroretinal rim area in patients with POAG or NTG is significantly decreased compared with age matching normal subjects.67 In most published papers, a single HRF often images both peripapillary retina and neuroretinal rim tissue. Compared with the Doppler signal produced by the temporal peripapillary retina, the rim produces a small signal as measured by DC values within the HRF image. Previous studies showed that HRF measurements are affected by different DC levels.1 Therefore, measurements in the neuroretinal rim area may provide inaccurate data because of improper sensitivity settings for the weaker rim signal. In order to accurately assess flow in the neuroretinal rim, the neuroretinal rim area image should be taken separately from the peripapillary retinal area with an appropriately higher sensitivity setting. This must be accomplished, however, without producing pixels with excessively high DC values in other areas of the image. Therefore, we performed a study to test a new alignment and sensitivity protocol for improvement of measurement results in the rim area.
Methods
Eighteen eyes of nine healthy volunteers (four male, five female; mean age 27 (SD 6) years; age range 18–30 years) were included in the study. Inclusion criteria consisted of normal eye examinations with corrected visual acuity 20/30 or better, intraocular pressure (IOP) below 22 mm Hg, refractive error between –2.00 and +2.00 dioptres, and astigmatism less than 1.50 dioptres cylinder. To quantify the repeatability of method 3, a second experiment was performed. Twelve subjects were recruited for the second experiment, conforming to the same inclusion criteria. Subjects were free from heart or lung disease and had no family history of ocular diseases. No intake of drugs influencing haemorheology was allowed in the 10 days preceding the examination. All procedures conformed to the tenets of the Declaration of Helsinki, and were reviewed and approved by institutional review board, with subjects giving informed consent.
Confocal scanning laser Doppler flowmetry with the HRF was performed on both eyes in each subject to measure blood flow in the neuroretinal rim of the optic nerve head. The HRF is a non-invasive technique and has been previously described in detail.8-10
The HRF creates a high resolution perfusion map of the retina and the optic nerve head by using confocal scanning laser technique. The light source of the HRF is a 780 nm diode laser. The parameters flow, volume, and velocity are measured in arbitrary units. All three parameters are calculated from the same basis using different formulas.
HRF images were acquired using the standard 10 degrees × 2.5 degrees measurement field, each two dimensional image consisting of 256 pixels × 64 lines. Every line was scanned 128 times at a sampling rate of 4000 Hz, with a total acquisition time of 2.5 seconds.
Three images of each examined eye were obtained using three different imaging methods.
METHOD 1
A conventional setting which has the optic nerve head in the centre of image with photodetector sensitivity optimised for the strong signal from the temporal peripapillary retina. Because of its weak signal this method produces a dark rim area image (Fig 1E).
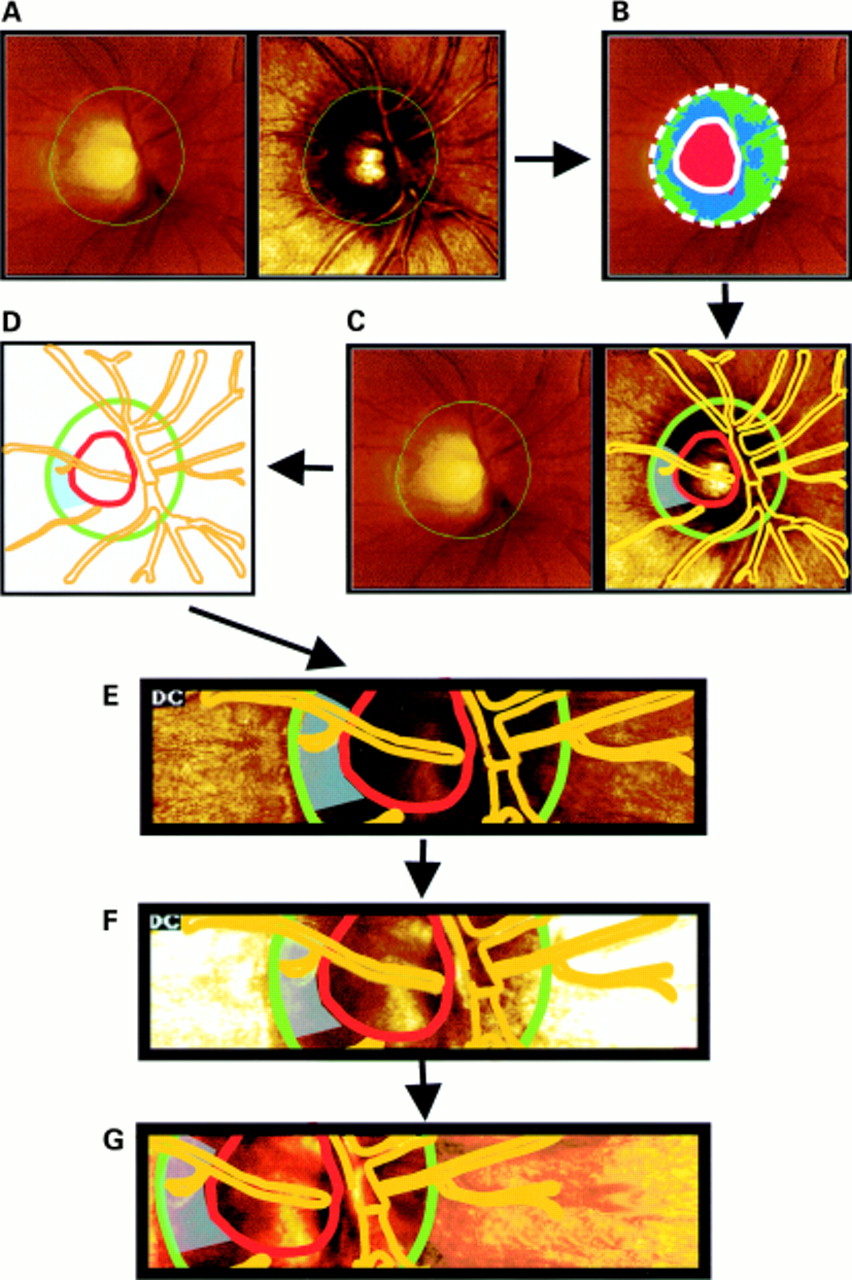
Definition of the optic disc margins using HRT images (A). Description of disc and cup area by means of the HRT software, after contour line drawing of the disc margin by an experienced examiner (B). Using a transparency overlay, the optic disc and cup margins, the major vessels as well as a blue shaded rim measurement area are drawn (C) resulting in a optic disc map ready for transposition to the HRF images (D). The HRT transparency overlay is adjusted exactly over the corresponding optic disc and retinal structures and HRF measurements are performed according to method 1 (E). The same design is used for method 2 (F) and method 3 (G).
METHOD 2
The setting of method 1 with signal capturing optimised on the rim by increasing sensitivity: Increasing sensitivity is a procedure to provide proper signals from the dark rim area (Fig 1F).
METHOD 3
The setting of method 2 with the temporal rim margin tangent to the lateral image border (Fig 1G).
To collect HRF data only from neuroretinal rim area, we needed to define the border between cup and rim as well as the disc margin. It is difficult for examiners to define these borders in the HRF reflectivity image or perfusion map. Using the standard software in HRF images (HRF, Software version 1.02), there is no integrated utility for defining these borders. For this purpose, we used a confocal scanning laser retina tomograph. The Heidelberg retina tomograph (HRT, Heidelberg Engineering, Heidelberg, Germany) has been previously described in detail.11-18 The HRT is designed for quantitative descriptions of fundus topography with main application in analysis of the morphology of the optic nerve head and follow up measurements in glaucoma (software version 2.01). Using a laser beam of a 670 nm diode laser, HRT scans 32 sequential 256 × 256 pixels slices. Three dimensional images can be obtained by combining data from the 32 different focal planes. The measurement field can vary between 10 × 10 degrees, 15 × 15 degrees, and 20 × 20 degrees. Utilising a 10 degree field of view for both HRF and HRT, the techniques were combined in this study for the first time, in order to enable precise definitions of the neuroretinal rim boundary.19 The images have been taken under the same experimental conditions for both measurement techniques.
The border of the optic disc was defined at the inner edge of the scleral ring of Elschnig by drawing a contour line, using the circle by circle technique for higher accuracy.20 One experienced examiner (CPJC) performed all contour line drawings. The optic disc border describes the outer edge of the neuroretinal rim (Fig 1A). For our experimental design we also needed a limit defining the inner edge of the neuroretinal rim. This can be achieved by using the ability of the HRT software to calculate stereometric parameters depending on the definition of the standard reference plane. Using the standard reference plane and depending on the drawn contour line, the optic disc can be represented as a coloured image describing the optic disc topography as following: red colour, cup area; blue plus green, the neuroretinal rim (Fig 1B). In this way, the inner edge of the rim can be defined as the transition between the blue/green and the red surface. Because there is no digital technique that can transpose HRT topography data to HRF flow maps, a method has been created to transfer the borders of the defined areas. Using a transparent overlay, the HRT defined inner and outer edges of the rim, as well as the vessel contours have been drawn manually (Fig 1C, D). This template was then overlaid on the equivalent HRF images of the same subjects, adjusting the areas of interest. Images of identical tissue locations (shaded area in Fig 1C–G) of the neuroretinal rim, identified by vascular landmarks and the contour line (transferred from HRT images) were selected to quantify the microcirculation of the neuroretinal rim for each volunteer (Fig 1E–G). We chose the temporal neuroretinal rim for analysis. Blood flow and reflectivity values (DC component) in the rim area (shaded area in Fig 1E–G) were evaluated using pointwise analysis for each of the three methods.1721
The brightness of pixels in HRF images is indicated by the DC value. Previous studies have found that low brightness areas have higher flow values. Acceptable brightness of the examined area was considered when DC values were between 70 and 200.2223
For the pointwise analysis, a sample box size was changed from default 10 ×10 pixels size to a single pixel. Using arrow keys of the computer keyboard, a single pixel sampling window scanned every area within the rim except large vessels and motion artefact lines. Mean DC value and the percentage of unacceptably illuminated pixels (DC value <70 or >200) were calculated from total pixels. After elimination of unacceptably illuminated pixels, the remaining pixel flow values were sorted into blood flow histograms. Pixels with less than one arbitrary unit of flow were counted as minimal flow pixels. The numbers of minimal flow pixels was determined as a percentage of total pixels, and the flow in the pixels at the 25th, 50th, 75th, and 90th percentile of flow were determined.21 Since the flow values are not normally distributed, the Glaucoma Research and Diagnostic Center, therefore, uses a rank order approach to HRF data. The pixels are sorted in order of flow, and the quartile values, as well as the 90th percentile and percentage of zeros, are used as flow parameters.
In experiment two, flow in the neuroretinal rim was measured twice using the alignment protocol of method 3. Observer A obtained the first measurement, the second measurement was performed by observer B in order to calculate interobserver repeatability.
STATISTICAL ANALYSIS
The Friedman test (two way non-parametric analysis of variance (ANOVA)) was used to compare flow and DC values among three groups. Between two groups, the Wilcoxon signed rank test with multiple comparison procedure was applied. p Values less than 0.05 and 0.016 for Friedman and Wilcoxon signed rank test, respectively, were regarded as significant. Coefficient of variation of repeated measurements was used as an indicator for the reproducibility of method 3.2425
Results
Mean DC value of method 1 was significantly lower than those of methods 2 and 3 (Friedman test: p<0.0001, Wilcoxon rank signed test: p=0.0002 and 0.0002, respectively). The percentage of unacceptably illuminated rim area (DC component <70 or >200) was significantly higher in method 1 than in methods 2 and 3 (73.5%, 37.5%, and 24.8% for methods 1, 2, and 3; Friedman test: p=0.0004; Wilcoxon rank signed test: p=0.0074 and p=0.0003, respectively) (Fig 2). Increasing sensitivity in method 2 provided proper signal detection on the neuroretinal rim area, which had previously dark illumination in method 1. However, it made the temporal peripapillary retina too bright with saturated DC values. Shifting camera angle in method 3 removed the overilluminated temporal peripapillary retina from the image.

The percentage of unacceptably illuminated pixels in the HRF neuroretinal rim measurements (mean (SE)). % bad DC = the percentage of unacceptably illuminated pixels (DC: value <70 or >200) of total pixels. Method 1: a conventional setting which has the optic nerve head in the centre of the image with photodetector sensitivity optimised for the strong signal from the temporal peripapillary retina. Method 2: the setting of method 1 with signal capturing optimised on the rim by increasing sensitivity. Method 3: the setting of method 2 with the temporal rim margin tangent to the lateral image border. *Significant difference between methods 1 and 2 (p=0.0074, Wilcoxon signed rank test). †Significant difference between methods 1 and 3 (p=0.0003, Wilcoxon signed rank test).
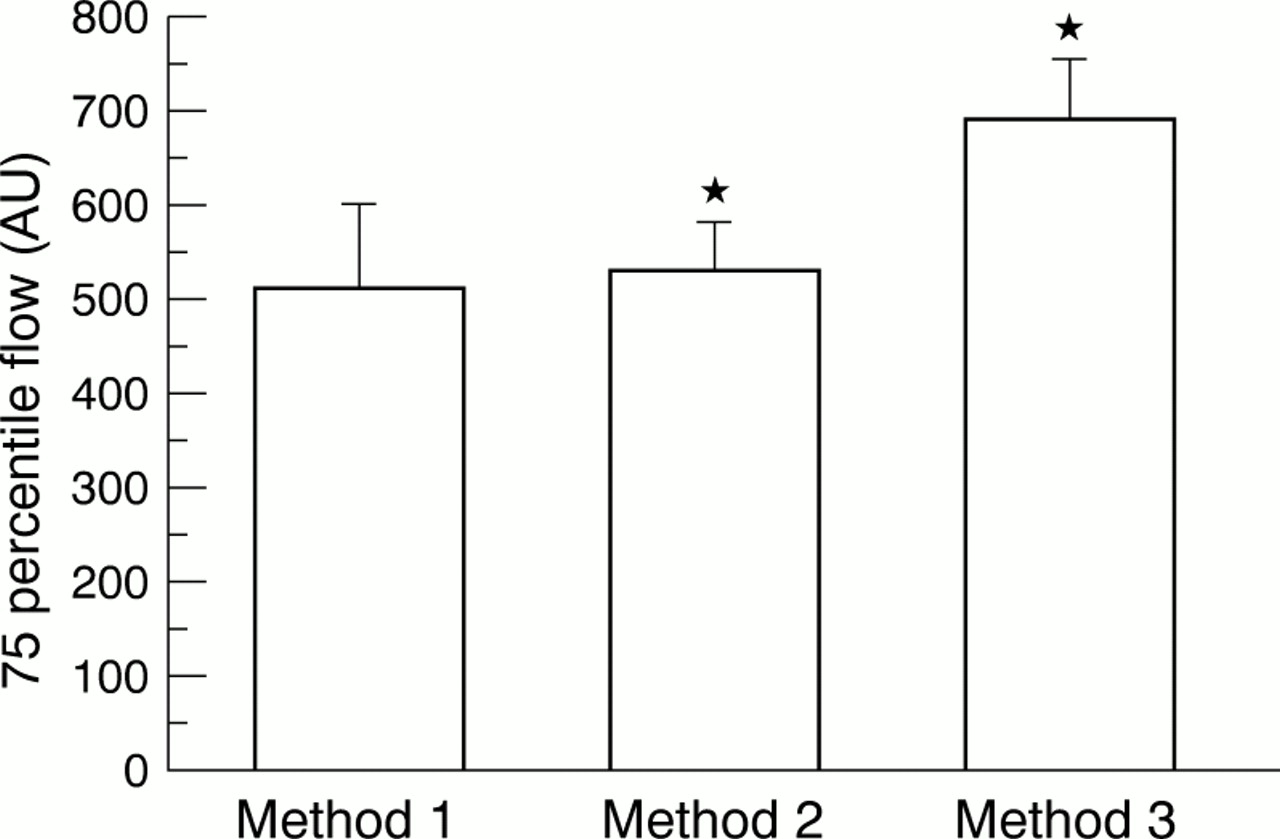
Comparing the three methods concerning percentile flow values from histogram, method 3 showed significantly higher flow values at 75 and 90 percentile pixels compared with method 2 (Friedman test: p=0.0337 and p=0.0302 respectively, Wilcoxon rank signed test: p=0.0065 and p=0.0038 respectively) (Fig 3). There was no significant difference between the methods at the 25th and 50th percentile flow values (Friedman test: p=0.1329 and p=0.1280, respectively).

75 Percentile flow in HRF neuroretinal rim measurements (mean (SE)). 75 percentile flow = blood flow values at 75 percentile pixels of blood flow histogram, which is generated from acceptable DC pixels (DC: from 70 to 200). Method 1: a conventional setting which has the optic nerve head in the centre of the image with photodetector sensitivity optimised for the strong signal from the temporal peripapillary retina. Method 2: the setting of method 1 with signal capturing optimised on the rim by increasing sensitivity. Method 3: the setting of method 2 with the temporal rim margin tangent to the lateral image border. *Significant difference between methods 2 and 3 (p=0.0065, Wilcoxon signed rank test).
The coefficient of variation of repeated measurements of method 3 was 19.15% for the 75th percentile and 16.85% for the 90th percentile of flow values. The coefficient of variation of repeated measurements was 20.59% for the mean flow value.
Discussion
In this study we address the problems associated with accurate measurement of a weak and strong signal from the same area of tissue. This is analogous to setting a microphone sensitivity to accurately record two voices, one whispering and one shouting. There are two approaches that may be used: one is to alter the signals with the goal of making them equivalent (placing a rag in the mouth of the shouting person), or using two different levels of sensitivity; an insensitive instrument for the strong signal, and a hypersensitive instrument for the weak signal. In method 3 of this study the two sensitivity level approach was used. By positioning the optic disc in such a way as to remove the temporal peripapillary retina from the image, we were able to use a high sensitivity level on the weak whispering signal without recording the shouting signal from the peripapillary retina. In the peripapillary retina image, a low sensitivity setting was used to record the shouting signal without distortion, while the whispering signal from the neuroretinal rim was essentially drowned out.
The performance of the HRF image requires optimised technical settings. The laser beam has to be focused on the superficial layer and the image quality is checked by observation of the real time reflectivity image. Depending on the sharpness of detail structures, specifically peripapillary retina, the measurement is executed. One group analyses HRF measurements only from peripapillary retina, excluding rim and cup because when the retinal plane is in focus, the rim and cup area, being localised posterior to the focal plane, remain very dark.726 Most HRF users, however, take a single HRF image for both peripapillary retina and neuroretinal rim analysis. It is impossible to adjust the sensitivity of the HRF photodetector for both the weak rim and strong peripapillary retinal signals within a single image. Because of the importance of the neuroretinal rim in glaucomatous changes regarding blood flow, factors influencing the measurements of an HRF image have to be evaluated.
To achieve a valid HRF measurement from the neuroretinal rim, two major factors should be discussed. Proper photodetector sensitivity for the low signal from the rim and measurement of every pixel in the neuroretinal rim.
The HRF uses a noise correction algorithm based on image brightness.1 Raw HRF measurements of Doppler shift are altered based on the assumed level of noise within the measurement pixel. Pixels with a high DC value are thought to contain a high level of noise and pixels with a low DC less noise. Flow measurements in high DC pixels are therefore reduced by a large correction factor while low DC pixels are corrected by only a small amount. This DC linked error in HRF measurements has been observed previously in in vitro models but has not previously been demonstrated in the human fundus. This noise correction routine is probably the source of the different flow measurements observed in this study.
Method 1 is the conventional method applied by most HRF users, which takes a single image for both peripapillary retina and rim. Therefore, the purpose of method 1 was the validation of current HRF measurements for the neuroretinal rim. Photodetector sensitivity in method 1 was too low for the low signal level produced by the neuroretinal rim tissue. The mean DC value in method 1 was significantly lower than in methods 2 and 3. This sensitivity problem in method 1 was confirmed with the finding that the percentage of unacceptably illuminated rim area (DC component <70 or >200) was significantly higher in method 1 (73.5%) than in methods 2 and 3. Based on the noise correction algorithm, blood flow values of method 1 are expected to have high values. However, method 1 had lower flow values than methods 2 and 3, although this was not significant. In fact, the comparison is impossible since over three quarters of the rim data (570 pixels out of 744 pixels) in method 1 were excluded as a result of our DC inclusion criteria.
Increasing the brightness to achieve proper rim illumination in method 2 consequently caused a sensitivity setting too high for the adjacent peripapillary retinal areas, especially on the temporal side. These excessively high DC values induce large noise correction and reduce the values not only of peripapillary retina but also of every pixel in the entire image, including the properly illuminated rim area. Therefore, in order to accurately measure neuroretinal rim blood flow, the photodetector sensitivity must be appropriate for the weak rim signal without producing peripapillary retina pixels with excessively high DC values. For most subjects, this was achieved by aligning the optic disc in the image so that no temporal peripapillary tissue remained in the image, as in method 3. Locating temporal rim margin to the lateral border of the HRF image removed the high signal peripapillary retinal areas of method 2. Removing the high signal peripapillary retinal areas in method 3 provided significantly higher flow values at 50, 75, and 90 percentile pixels, compared with method 2. Repositioning of the optic disc in the method 3 image was achieved by shifting the camera angle, ranging from 2 to 6 degrees and is not considered to have an effect on HRF measurements because HRF measurements are independent of the laser beam to the fundus angle of incidence.22 At this point, measurements focused on the neuroretinal rim deliver values with appropriate photodetector sensitivity, without being influenced by the high DC level surroundings. In this way, measurements become more accurate.
The second major factor, to achieve a valid HRF measurement from neuroretinal rim, is collecting every pixel from the entire rim area. The neuroretinal rim, especially a thinned or notched glaucomatous rim, has very small areas with major retinal blood vessels. These vessels should be avoided in analysis because HRF cannot accurately measure flow in large vessels. Locating a default sample box (10 × 10 pixels) in the rim is not possible in some glaucoma patients because of thinned rim and vessels. In most cases, examiners may be able to locate only one sample box within the rim, which provides only a 100 pixels measurement. Since a single pixel sized sample window is used in pointwise analysis, examiners can scan every single pixel in the rim, even very small areas like nearby notching or space between blood vessels. Because of this advantage, the average of pixel count in our study is approximately seven times more than the conventional method with default 10 × 10 pixel box. Increasing pixel count has been proved to improve reproducibility of HRF flow measurements.22 In addition, the pointwise method excludes any unacceptable DC value pixels. However, this is impossible using the conventional method or the new HRF software for automatic full field analysis27 because it provides mean DC values of 10 × 10 (100 pixels) or smoothes the image data to include the surrounding 5 × 5 pixels at each point, respectively.
Defining disc and cup margins of the optic nerve head, corresponding to the outer and inner edge of the neuroretinal rim, is another impediment for the HRF rim measurement. These two boundaries are not distinct in both the reflectivity and perfusion map of HRF. For an accurate and objective method to define these boundaries for the rim measurement, we performed for the first time a combination of topographic measurements with HRF blood flow measurements, using the HRT definitions of optic disc and cup margins.19 Besides the improvement of neuroretinal rim analysis, this combination of the two devices leads to a more accurate localisation of the examined area of intraindividual follow up images in longitudinal studies, as clinically needed in follow up of glaucomatous optic disc changes. Certainly, future software related combinations should allow even more precise measurements, meaning that the measurement window of the HRF software could be placed on the neuroretinal rim area defined by the HRT topography of the same eye.
In order to evaluate interobserver reproducibility of method 3, an additional experiment was performed. The coefficients of variation of repeated measurements for the 50th and 75th percentile flow values were calculated as 19.15% and 16.85%, respectively, as variability of repeated readings on the same subject, indicating an acceptable repeatability.
In conclusion, the conventional HRF image acquisition technique cannot be used to measure flow within the rim of the optic nerve head. The HRF images for peripapillary retina and neuroretinal rim should be taken separately using different imaging settings. There should be one image for the neuroretinal rim area and one image for the peripapillary tissue. This new protocol (method 3) is recommended in order to improve accuracy of blood flow measurements in studies of the neuroretinal rim area. Further study of reproducibility (interobserver or intraobserver) and comparison between glaucoma patients and normal subjects using this new method is required.
Acknowledgments
Proprietary interest: nil.
Supported in part by grant EY10801 (AH) from the National Institutes of Health, Bethesda, Maryland and by an unrestricted grant from Research to Prevent Blindness, New York. AH is a recipient of the William and Mary Greve Award from Research to Prevent Blindness.