Article Text

Abstract
Background: Endothelial examination of organ culture stored corneas is usually done manually and on several mosaic zones. Some banks use an image analyser that takes account of only one zone. This method is restricted by image quality, and may be inaccurate if endothelial cell density (ECD) within the mosaic is not homogeneous. The authors have developed an analyser that has tools for automatic error detection and correction, and can measure ECD and perform morphometry on multiple zones of three images of the endothelial mosaic.
Methods: 60 human corneas were divided into two equal groups: group 1 with homogeneous mosaics, group 2 with heterogeneous ones. Three standard microscopy video images of the endothelium, graded by quality, were analysed either in isolation (so called mono-image analysis) or simultaneously (so called tri-image analysis), with 50 or 300 endothelial cells (ECs) counted. The automated analysis was compared with the manual analysis, which concerned 10 non-adjacent zones and about 300 cells. For each analysis method, failures and durations were studied according to image quality.
Results: All corneas were able to undergo analysis, in about 2 or 7.5 minutes for 50 and 300 ECs respectively. The tri-image analysis did not increase analysis time and never failed, even with mediocre images. The tri-image analysis of 300 ECs was always most highly correlated with the manual count, particularly in the heterogeneous cornea group (r=0.94, p<0.001) and prevented serious count errors.
Conclusions: This analyser allows reliable and rapid analysis of ECD, even for heterogeneous endothelia mosaics and mediocre images.
- endothelium
- cornea
- organ culture
- automatic analysis
- multi-image analysis
Statistics from Altmetric.com
Cornea storage techniques, whether short or long term, require analysis of endothelial cell density (ECD). In most eye banks, cornea delivery for grafting is authorised only if ECD is greater than 2000 cells/mm2 after storage. This cell count is done either by specular microscopy during short term storage at +4°C or by standard microscopy during organ culture,1 the most common technique in Europe.2 In Europe, counting is most often done manually. Study of the 1999 register3 of French cornea banks (Table 1) which lists the data of 2425 corneas stored in organ culture at +31°C, showed a substantial difference in ECDs between banks. This was 32.6% (mean 2634 (SD 231), median 2675, range 2140–3030) at the start of storage and 30.3% (mean 2430, SD 219, median 2360, range 1986–2848) at delivery. It is important to note that all ECDs had been evaluated manually, except in bank 4, which had a semiautomated analysis system that required a technician to digitise the cell contours visible on the screen. Such differences in ECDs were not justified by differences in mean donor age (64.0 years, SD 6.2, range 49–71.5), mean death procurement time (13.7 hours, SD 7.2, range 8–29.4), or mean storage time (17.6 days, SD 2.2, range 14–21). It was legitimate to think that these large ECD differences between banks were due to manual count errors and/or errors in calibration, as may occur in any measuring system.4,5
Mean endothelial cell densities (ECD) at the start and end of storage, from 17 French cornea banks using organ culture storage (for 1999, source: French storage centre register3)
We believe the use of an effective, automated cell counting system is indispensable. Existing systems are of only limited use, especially because of difficulties when the image of the endothelial mosaic under analysis is mediocre. This is often the case with standard microscopy, and requires either numerous contour touch ups or a simple marking of the presumed cell centres. Moreover, whereas the technician manually observes and analyses several non-adjacent zones of the mosaic (generally 5–10 zones, depending on the bank), and a large number of cells, current analysers only take account of one endothelial zone with a limited number of cells, approximately 50 to 100. The operator's choice of a single zone of analysis may thus be responsible for a selection bias, especially if ECD within the cornea is not uniform. We present a prototype analyser with automatic error detection and correction tools, which is able to measure ECD simultaneously on several endothelial images. Its purpose is to be effective even when images are medium or only adequate, and to limit measurement error when mosaics are heterogeneous.
MATERIAL AND METHODS
Manual counts
These were done after making visible the intercellular spaces by incubation for 4 minutes with 0.9% sodium chloride, through a graduated reticle (reference 519966, Leica, Wetzlar, Germany) placed in the ocular of a Leica Laborlux S standard direct optical microscope (Leica). At the moment when the cell contours were most visible, the technician counted the ECs, contained in one microsquare of the reticle, excluding those touching two adjacent borders. He conducted an overall screening of the mosaic of the central 8 mm. This consisted of 10 counts on 10 non-adjacent zones of each cornea, avoiding the folds, which cause overcounting because of parallax error. He then multiplied the mean of his 10 measurements by a corrective factor derived from calibrating the microscope with a micrometric slide (Merkeurolab, Strasbourg, France) in order to obtain the ECD in cells/mm2. All counts were done by the same experienced technician (over 3000 counts).
Image quality and mosaic homogeneity
At the same time, when the intercellular spaces seemed well dilated (neither too much nor too little), he took three video images (Sony SC 75 CE mono CCD) of wide field (width 1000 μm, height 750 μm) of three zones, chosen at random but non-adjacent, of the paracentral endothelium. These images were saved in a tagged image format file (TIFF). Each image was examined blind and quality graded (Table 2) “adequate,” “medium,” or “good” (Figs 1A, B, C). In addition, each cornea was graded “homogeneous” if the ECDs between the three images and within each image appeared similar, or “heterogeneous” otherwise. We analysed 60 corneas, divided into two equal groups: group 1 of homogeneous corneas (30 corneas, 3 × 30 images) and group 2 of heterogeneous corneas (30 corneas, 3 × 30 images). The corneas all came from phakic eyes, and had undergone mean storage of 14 days (SD 4, range 7–31) at +31°C in Inosol (Opsia, Toulouse, France). They were first counted manually, then with our analyser.
Image quality.
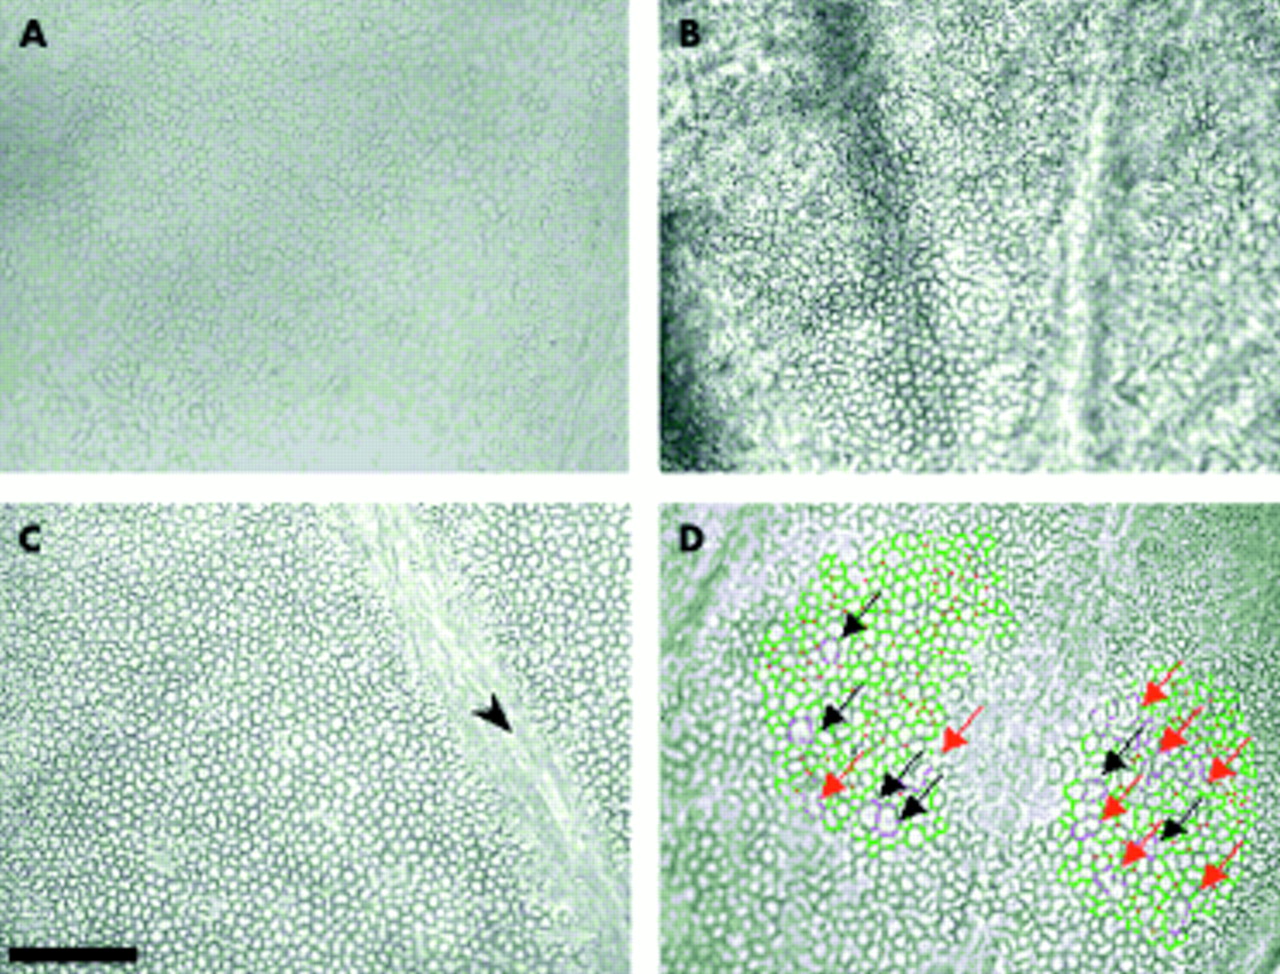
Different grades of standard microscopy video image of the endothelium. These very wide field images (750 000 μm2) were archived in TIFF format. (A) Adequate quality image with poorly delineated cell contours, mediocre contrast, large blocks of invisible cells. (B) Medium quality image with fairly well delineated cell contours but high background noise and large blocks of invisible cells. (C) Good quality image with well delineated cell contours, no background noise, cells visible on practically all the image except one fold zone (arrow). (D) Automated error detection tool. The contours of cells exceeding 1500 μm2 or the form of which is unrealistic (longest length greater than double the shortest width) appear violet to alert the technician. He could then either validate the cells if he deemed them acceptable, or touch them up by adding or erasing certain segments. In this example, six cells were genuinely large in area (black arrows), the others needed touching up (red arrows). Scale bar 200 μm
Analyser and automatic analysis procedures
Our prototype analyser comprised an IBM compatible PC, 800 MHZ Pentium, 256 Mb RAM, equipped with a video frame grabber (Data translation DT 3155, Malboro, MA, USA) installed on the same microscope as used for the manual counts. Calibration was done with the same micrometric slide. The three mosaic images were viewed side by side on a 22 inch monitor. The analysis program, written in C++, was based on a generalist image analysis software, ImageTool (University of Texas Health Science Center, San Antonio, TX, USA, available at ftp://maxrad6.uthscsa) and specifically adapted to human corneal endothelium. In particular, it took account of the frequently poor quality of images, with the following functions: selection on one image of several zones of interest according to free forms; automatic elimination of surface artefacts smaller than 50 μm2; automatic detection of probable errors in contour recognition (EC of area greater than 1500 μm2 or whose longest length was more than twice the shortest width that could correspond to poorly separated ECs). The automated analysis went as follows. Each selected zone on each image was successively subject to thresholding, which transformed the starting image, formed of 256 grey levels, into a binary image. The analyser then automatically eliminated the artefacts, and with another colour underlined EC contours that were too wide or too long (Fig 1D). If necessary, the technician then did touch ups by tracing and/or erasing contour segments. These touch ups were made easier by a zoom lens, by the possibility to return to the original image, and by the real time display of the number of ECs taken into account. The final analysis report was then printed and archived in hypertext markup language (HTML) for remote transmission to the surgeon. The report included all parameters of counting (ECD, number of ECs counted) and of morphometry (Fig 2).

Final result of analyses in mono-image (A) and tri-image (B) modes, sent by the cornea bank to the surgeon. This document, saved in HTML format, can be remotely transmitted. It contained all quantitative data (ECD, cell count) and morphometric data (area variation coefficient, min/max/mean/standard deviation of cell area, histogram of relative frequency distribution of cell areas, percentage of hexagonality). The one or three non-analysed and analysed video images of the endothelium are also printed, as is a non-specified image (in our case, an example of a graft). The technician also had a text box to note any comments.
For each cornea two analyses methods were compared, with precisely 50 or 300 ECs being taken into account in each method: the “mono-image” method, which analysed one or more zones of a single image (Fig 2A), and the “tri-image” method, which simultaneously analysed one or more zones of three images of the mosaic (Fig 2B). In total, eight automatic analyses (three mono-image 50, three mono-image 300, one tri-image 50, one tri-image 300) were done for each cornea and compared with the manual count. The percentage of severe discrepancy in ECD, as defined by a deviation of plus or minus 20% between the manual and automated counts ((manual ECD − automated ECD)/manual ECD) was compared in each group according to the count method. The tri-image 300 method reproduced most faithfully the strategy of global screening of the mosaic done by the technician during the manual count. The technician timed each analysis (from opening the image files to final printout of the report). The duration and percentage failure of the analysis methods were compared according to the quality of 180 images. The morphometric data, though supplied by the analyser, were not considered for this study and will be the subject of a subsequent study.
Statistics
Comparison of the ECDs and durations of each method was done with Student's t test for paired samples. The correlations between the different methods of automated and manual analysis were studied (Pearson's r coefficient) and tested against the null hypothesis of no correlation (r=0). In all the statistical tests, p<0.05 was deemed significant.
RESULTS
Image appearance, analysis failure, and duration (Table 3)
Durations and failure percentages of the different analysis methods according to image quality (excluding image capture, which lasted about 1 minute)
The 60 corneas could be analysed by at least one of the eight automated methods. Of a total of 480 theoretical analyses, 464 (97%) could be done. Analysis failures were encountered only in mono-image 300 mode. Images were judged “adequate,” “medium,” or “good” in respectively 10% (n=17), 44% (n=79), and 46% (n=84) of cases. When images were of good quality, especially when 50 cells were counted, touch ups were not necessary. Analysis of the “adequate” images required more touch ups and lasted longer. The mean duration, (not including the time to capture the three images, which took about 1 minute), was less than 2 minutes for 50 cells and 7.5 minutes for 300 cells. The tri-image method was no slower than the mono-image method. On the contrary, it tended to be faster in the case of only adequate images (difference not significant). Manual analyses lasted about 10–15 minutes, comprising 5–7 minutes to count and a similar time to write the report.
Comparison of analysis methods and manual count
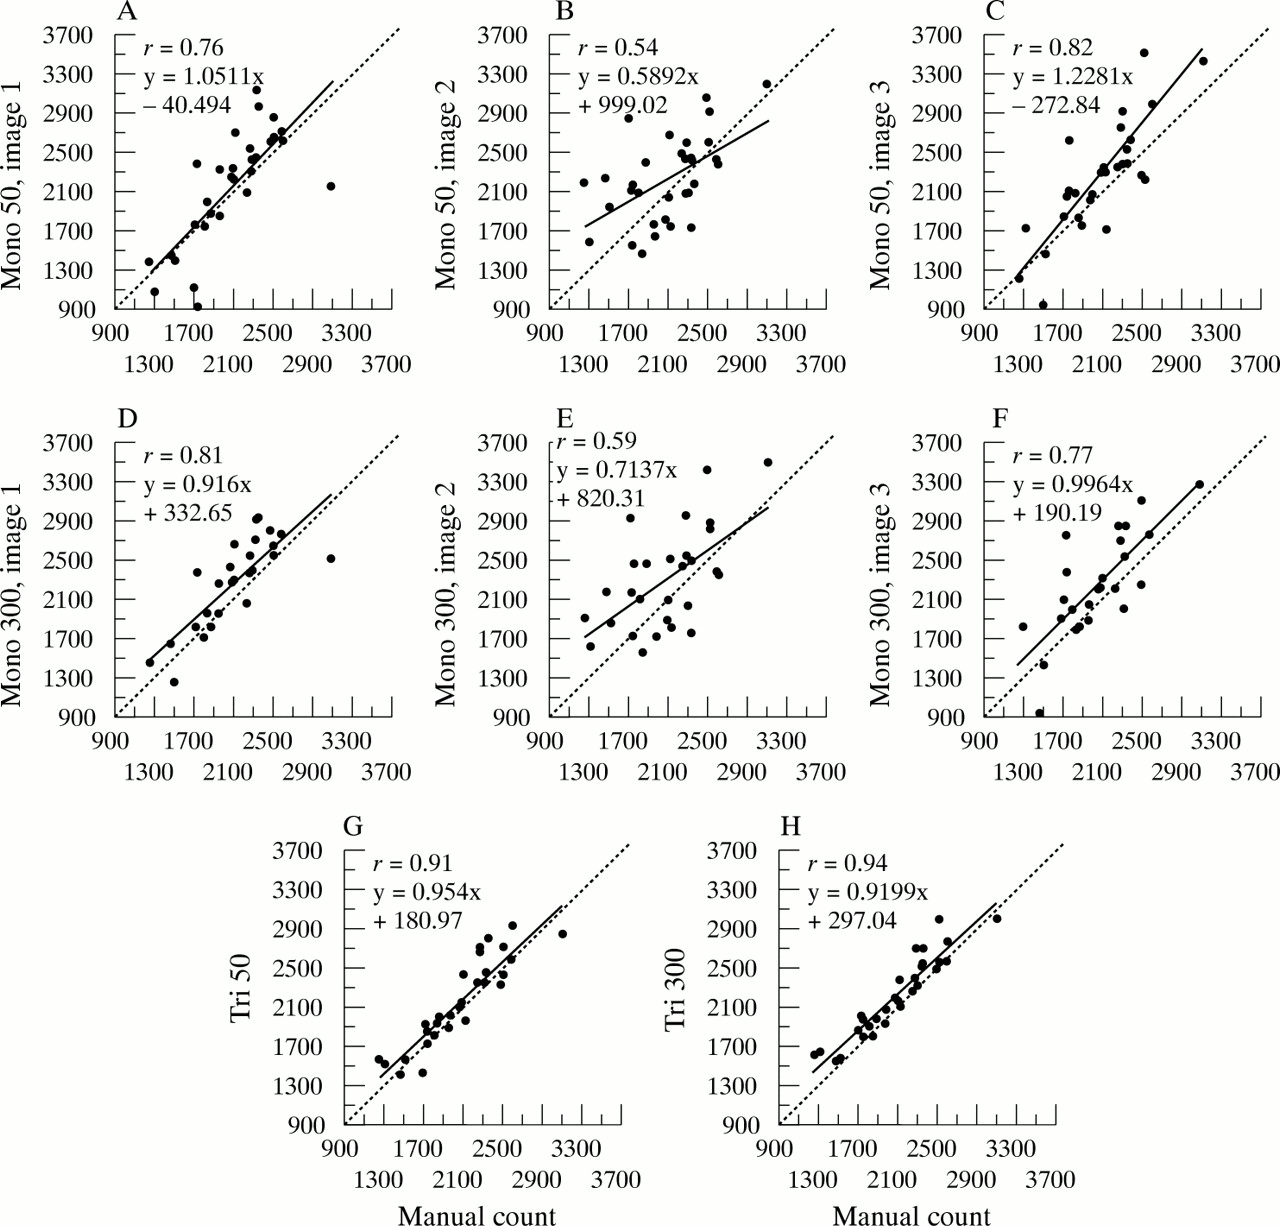
In manual mode, the technician counted a mean of 339 cells (SD 56, range 192–476). The ECDs provided by the automated analysis methods, in group 1 of homogeneous corneas and group 2 of heterogeneous corneas, are presented respectively in Tables 4 and 5. The manual count always slightly underestimated ECD, by mean values of 3.8% (group 1) and 7.1% (group 2) in comparison with all the automated analyses. In group 1, all the automated analysis methods were strongly correlated with the manual count (r between 0.78 and 0.93, p<0.001) (Fig 3). But in group 2 (Fig 4), the strongest correlations with the manual count were in tri-image 300 mode (r = 0.94, p <0.001), and the weakest were in mono-image 50 mode (r = 0.54, p <0.001) and then mono-image 300 mode (r = 0.59, p <0.001).
Endothelial cell density (ECD) of homogeneous corneas (group 1, n=30) by automated analysis method: mono-image (each of the three images is analysed in isolation) or tri-image (the three images are analysed simultaneously) for 50 and 300 cells, and comparisons with manual count
Endothelial cell density (ECD) of heterogeneous corneas (group 2, n=30) by automated analysis method: mono-image (each of the three images is analysed in isolation) or tri-image (the images are analysed simultaneously) for 50 and 300 cells, and comparison with manual count

The relations between each of the eight automated analysis methods and manual count for homogeneous corneas (group 1, n=30). Whatever the analysis method, discrepancies with the manual count were rare. Correlations were best with the tri-image mode, for 300 and even 50 cells. For all correlations, p was <0.001.

The relations between each of the eight automated analysis methods and manual count for heterogeneous corneas (group 1, n=30) The mono-image 50 or 300 counts often gave rise to serious discrepancies. Correlations were best (r=0.94) in mono-image 300 and tri-image 50 modes (r=0.91). For all correlations, p was <0.001.
Serious discrepancies in ECD measurement (of 20% and more) between manual and automatic methods were observed for heterogeneous corneas in 31.1% and 29.1% of cases in mono-image 50 or 300 mode respectively, but less often in tri-image 50 or 300 modes (respectively 3.3% of cases, p<0.006, and 6.7% of cases, p<0.01). In group 1 such serious discrepancies were far rarer (only three out of 240 analyses) irrespective of the analysis method and the number of cells counted.
DISCUSSION
We developed a prototype automated analyser which, using three standard microscopy video images, allows rapid and effective measurement of ECD and morphometry of organ culture stored corneas, even with adequate or medium quality images and heterogeneous mosaics. It reduces the human bias that exists with other analysers, which only analyse one mosaic zone chosen by the technician.
The use of computerised image analysis tools reduces interindividual and intraindividual variability by lowering the risk of error, and saves time compared to manual counting.6–8 Such tools were originally developed for in vivo analysis of specular microscopy images9–17 and then for endothelial examination during short term storage at +4°C.18,19 The contours of ECs viewed in specular mode are non modified and relatively well contrasted. The moderate descemetic folds and stromal oedema seen in short storage allow generation of easy to analyse images. However, some authors stress that the accuracy of automated specular image analysers remains linked to image quality13,15,16,20 and to the size of the visible field.10
Automated analysis of the mosaic in optical microscopy, the most common technique in European banks that use organ culture, is more difficult given the often poorer image quality.6,21 EC contours can only be viewed after osmotically induced dilation of the intercellular spaces, typically by a solution of 0.9% NaCl.22 This dilation varies from one cornea to another and between zones of the same cornea.6 It must not be excessive, because analysis of too retracted cells is very difficult. The use of 0.9% NaCl for about 4 minutes helped us obtain medium (44%) and good (46%) images without recourse to other osmotic agents liable to enhance viewing of the cell contours, such as 1.8% sucrose.23 Furthermore, the technician must capture the images when the intercellular spaces are well dilated, and adjust the focus, light, and the microscope condenser to improve contour definition and contrast and the percentage of visible cells, and to limit background noise. Thresholding, which is done independently on each zone of each image, must also receive special attention since it reduces the need for touch ups. When images were of good quality, very limited and sometimes no touch ups were needed. Prolonging organ culture increases the number of folds23 and the stromal oedema,24 and can also degrade images. Barisani, with his mono-image analyser, had 44% failure beyond 21 days' organ culture.6 This was not the case in our study, because even in the case of prolonged storage (up to 31 days in our series), analysis was always possible in tri-image mode, even with a high cell count (300). The possibility to choose several zones on the same image according to the free forms, avoiding zones where the mosaic was not visible, and to repeat the operation on the three images, prevented failure even with mediocre images. Lastly, direct acquisition of the video images, without an intermediate photographic stage, limited information loss and eliminated the risk of errors linked to image magnification,16,18 because the entire optical and computing chain was directly calibrated.
All automated analysers currently used in optical and specular microscopy select a single parallelepipedic zone for analysis. This has two drawbacks: (1) this form does not always allow elimination from analysis of zones where the image is worst, as stated above, or of zones of folds responsible for ECD overestimation due to parallax error; (2) since there is only one zone, which is often limited in size, this reduces accordingly the number of cells counted and the accuracy of the ECD measurement. Hirst points out that such an analysis is only representative of the whole endothelium in cases where the mosaic is particularly homogeneous.11,14 Development of wide field specular microscopy, enabling 2000 to 3000 cells to be viewed,25 allowed better mosaic sampling and analysis of a very large number of cells (over 400).12 However, the technology of the time limited its use because of excessive analysis time, close to 30 minutes, and was only suited to in vivo specular microscopy. With our analyser, selection of several zones on three wide field optical microscopy images makes it theoretically possible to analyse between 4000 and 6000 cells on a corneal area of 2.25 mm2, constituting a sample of over 4% of the central 8 mm area (50.26 mm2). This is the widest field analysed in the literature. We have thus shown that analysis of a single image of 50 or even 300 cells could be faulted, especially if the mosaic is heterogeneous. This was not the case with our original analysis method, which considers three images simultaneously.
Corneas with a heterogeneous endothelium are not rare. Observation of thousands of consecutive images of endothelial mosaics led us to note that about one cornea in five may be deemed heterogeneous (data not shown). Some zones, where polymegethism and pleomorphism are greatest, may have a lower ECD than others where the mosaic is more uniform. This was shown by cartographic studies evaluating the spacial variations of the ECD in corneal pathologies such as keratoconus.26 This has also been noted in scarring procedures (especially cataract surgery)27 which are generally excluded from procurement. However, ageing is a factor in heterogeneity28–30 that banks increasingly face, and particularly in Europe, where donor age is high.31,32 In our series, in tri-image 300 mode the 30 heterogeneous corneas had a mean ECD of 2204 cells/mm2 (SD 412, range 1545–2994) and 19 of these (63%) were grafted. In this group, mono-image analysis gave substantial discrepancies in ECD measurement, more than 20% (greater or less) than the manual count, for nearly a third of the corneas. These could thus have been wrongly eliminated or delivered. The possibility, in tri-image 300 mode, to analyse simultaneously several non-adjacent zones on several images and a large number of cells limits technician bias in selecting a single mosaic zone: it reproduces his strategy of overall screening of multiple mosaic zones and takes account of 300 cells as when he counts manually. This analysis method is most strongly correlated with manual analysis, particularly for heterogeneous corneas (r = 0.94), but also for homogeneous ones (r =0.93).
Analysis time is necessarily lengthened by counting of a large number of cells. While the number of ECs counted increases the validity of ECD measurement through improved sampling, it also increases the risk of touch up related error, the laboriousness of the operation, and the cost of analysis. Most authors thus deemed counting of 75 to 100 ECs, in specular33–35 and optical35,36 microscopy, a good compromise, assuming the endothelial mosaic is relatively homogeneous. Moreover, the tools of that time could typically analyse only a relatively restricted field of the mosaic, and computers were slower and did not offer automated error detection or correction. Time is saved by programming these features, in particular the elimination of surfaces smaller than 50 μm2 corresponding to debris, nuclei, or contour artefacts. Likewise, automatic detection of probable contour recognition error enables touch ups to be guided, thus making them more rapid and accurate, an appreciable factor in morphometric validity. Our mean analysis time was just under 7.5 minutes for 300 cells. We felt it unreasonable to design a process exceeding 10 minutes, the duration of a manual analysis, in order to make the analyser routinely available to the technician. The choice of three images, rather than four, five or even more, was partly imposed by this time constraint. The tri-image mode does not increase analysis time; and in the case of mediocre images substantially shortens it by allowing selection of multiple zones of interest where the mosaic is clearly visible. Furthermore, these error detection and correction tools enhance system user friendliness and make learning to use it easier, a skill acquired after a few counts. Lastly, two major benefits should be emphasised: (1) because analysis can be deferred, capture of the three images takes about 1 minute, which considerably reduces the time spent by the corneas out of the storage medium; (2) image archiving (in TIFF format) and results transmission via a computer network (thanks to the HTML format) save considerable time.
CONCLUSIONS
Since January 2001our analyser has been routinely used in our bank, and analysis in tri-image mode of 300 cells is now our gold standard for cornea delivery. This analysis method has markedly increased our cornea delivery rate, but also allowed more stringent selection, especially for heterogeneous mosaics. This is important for our clinical research, where accurate ECD data at delivery are required for postoperative study of diminishing ECDs. More recently, our laboratory's acquisition of a second analyser has proved particularly useful in the experimental evaluation of new storage media, where slight ECD and morphometric variations must be highlighted. Provision of this system to Europe's ophthalmological community may represent a step towards the standardisation and improvement of endothelial examination within and between cornea banks.
Acknowledgments
We thank the AIRE association (which supports local medical research) for funding (2000–01 research programme)
Part of this paper was presented at the 14th annual meeting of the European Eye Bank Association, held on 18–19 January 2002 in Paris, France. It won the best oral presentation award.
Proprietary interest: none.