Article Text

Abstract
Aims: To investigate the effect of central corneal thickness and corneal curvature on intraocular pressure measurements using the pulsatile ocular blood flow tonograph and the Goldmann applanation tonometer, and to assess the agreement between the pulsatile ocular blood flow tonograph and the Goldmann applanation tonometer in intraocular pressure measurement.
Methods: 479 subjects underwent intraocular pressure measurements with the Goldmann applanation tonometer and the pulsatile ocular blood flow tonograph. Of these, 334 patients underwent additional measurement of central corneal thickness with an ultrasonic pachymeter and corneal curvature measurement with a keratometer.
Results: The intraocular pressure measurements obtained with both the Goldmann applanation tonometer and the pulsatile ocular blood flow tonograph varied with central corneal thickness and mean keratometric reading. Intraocular pressure measured using the Goldmann applanation tonometer increased by 0.027 mm Hg per µm increase in central corneal thickness. Intraocular pressure measured using the pulsatile ocular blood flow tonograph increased by 0.048 mm Hg per μm increase in central corneal thickness. For an increase of 1 mm of mean corneal curvature there was rise in intraocular pressure of 1.14 mm Hg measured by the Goldmann applanation tonometer and of 2.6 mm Hg measured by the pulsatile ocular blood flow tonograph. When compared to the Goldmann applanation tonometer, the pulsatile ocular blood flow tonograph underestimated at low intraocular pressure and overestimated at higher intraocular pressure.
Conclusion: Central corneal thickness and corneal curvature affected measurements obtained with the pulsatile ocular blood flow tonograph more than they affected measurements obtained with the Goldmann applanation tonometer.
- pneumotonometer
- Goldmann applanation tonometer
- central corneal thickness
- corneal curvature
- glaucoma
- CC, corneal curvature
- CCT, central corneal thickness
- GAT, Goldmann applanation tonometer
- IOP, intraocular pressure
- POBF, pulsatile ocular blood flow tonograph
- pneumotonometer
- Goldmann applanation tonometer
- central corneal thickness
- corneal curvature
- glaucoma
- CC, corneal curvature
- CCT, central corneal thickness
- GAT, Goldmann applanation tonometer
- IOP, intraocular pressure
- POBF, pulsatile ocular blood flow tonograph
Statistics from Altmetric.com
- pneumotonometer
- Goldmann applanation tonometer
- central corneal thickness
- corneal curvature
- glaucoma
- CC, corneal curvature
- CCT, central corneal thickness
- GAT, Goldmann applanation tonometer
- IOP, intraocular pressure
- POBF, pulsatile ocular blood flow tonograph
- pneumotonometer
- Goldmann applanation tonometer
- central corneal thickness
- corneal curvature
- glaucoma
- CC, corneal curvature
- CCT, central corneal thickness
- GAT, Goldmann applanation tonometer
- IOP, intraocular pressure
- POBF, pulsatile ocular blood flow tonograph
Tonometry is important in the diagnosis and management of glaucoma. The Goldmann applanation tonometer (GAT) is the internationally accepted “gold standard” tonometer.1 Central corneal thickness (CCT) and corneal curvature affect intraocular pressure measurements obtained with the GAT.2 Errors in pressure measurement as a result of ignoring CCT can result in the misdiagnosis of ocular hypertension and normal tension glaucoma.2–11
The manufacturer claims that the measurements by the pulsatile ocular blood flow tonograph (POBF tonograph) (now called the ocular blood flow analyser, Paradigm Medical Industries, Inc, Salt Lake City, UT, USA) are unaffected by physical corneal characteristics like corneal thickness.
In a recent study Bhan and co-workers reported that the normal variation in CCT in a population affected the intraocular pressure measurements obtained by the POBF tonograph.12 However the study did not examine the influence of corneal curvature.
We sought to compare the way CCT and corneal curvature affect the measurements obtained by the POBF tonograph and the GAT. We also assessed agreement between the POBF tonograph and the GAT in intraocular pressure measurement.
SUBJECTS AND METHODS
The subjects involved in the study were recruited from the outpatient department of the Rural Eye Hospital, Sankara Nethralaya (a unit of the Medical and Vision Research Foundation) in Chennai, India, and the Department of Ophthalmology, Norfolk and Norwich University Hospital NHS Trust, Norwich, UK. The Medical and Vision Research Foundation ethics committee and Norfolk and Norwich local research ethics committee approved the study and the tenets of the Declaration of Helsinki were observed. Written informed consent was obtained from all study participants.
Each subject underwent a complete ophthalmic examination, including refraction, external eye evaluation with a slit lamp biomicroscope and dilated retinal evaluation by an ophthalmologist. Subjects with corneal disease or with a history of intraocular surgery were not included in the study. If both eyes fitted the inclusion criteria then the measurements were performed on a randomly selected eye. All measurements were performed before any pupil dilatation.
A total of 479 subjects (266 men and 213 women) were involved in the study. All subjects underwent intraocular pressure measurements using the GAT and the POBF tonograph. Subjects were cyclically allocated a serial number in order of attendance. Individuals with an odd serial number underwent measurements with the GAT first and subjects with even serial numbers underwent measurements with the POBF tonograph first. Three hundred and thirty four subjects (184 men and 150 women) underwent additional tests to determine corneal curvature and CCT. Corneal radius of curvature was determined using a keratometer (Bausch and Lomb) before intraocular pressure measurements. The mean of the two principal corneal meridians was calculated to give the mean keratometric reading.
The GAT and the POBF tonograph were mounted separately on a slit lamp. The subjects were given 15 minutes of rest before intraocular pressure measurement. A drop of topical anaesthetic (proxymetacaine 0.5%) was used before the measurement using the POBF tonograph and a fluorescein anaesthetic combination (proxymetacaine 0.5% with fluorescein sodium 0.25%) was used before the GAT measurement. All GAT measurements were performed by one of two operators (PG and ISJ). An experienced observer (PG) performed all measurements with the POBF tonograph. The observer measuring intraocular pressure using the GAT was masked to the reading obtained using the POBF tonograph. There was also an interval of 15 minutes between intraocular pressure measurements to minimise the carryover effects from sequential tonometry.
Subjects underwent CCT measurement after the measurement of intraocular pressure with both the GAT and the POBF tonograph. An ultrasonic pachymeter (BVI Pocket Pachymeter, BV International, France) was used to measure the CCT. The subject’s eye was anaesthetised with a drop of proxymetacaine 0.5%. Subjects were instructed to keep the eye closed for a period of 30 seconds to 1 minute to ensure good anaesthesia. Ten measurements were performed in rapid succession and the lowest reading was taken as the CCT.5 Patients were instructed to blink after each measurement to avoid desiccation of the corneal epithelium.
Multiple regression analysis was used to calculate the change in intraocular pressure (per μm increase in CCT and per mm change corneal curvature). The Mann-Whitney test was used to determine any difference between male and female subjects. The Bland-Altman bias plot was used to examine the agreement of intraocular pressure measurements with the GAT and the POBF tonograph.
RESULTS
Effect of CCT and corneal curvature on POBF tonography and Goldmann applanation tonometry
Data were obtained from 334 subjects, of whom 159 were normal and 175 had either open angle glaucoma, ocular hypertension, combined mechanism glaucoma or were glaucoma suspects. One hundred and twelve subjects were on topical intraocular pressure lowering medications. Table 1 shows the median age, refraction, CCT, mean corneal curvature, and intraocular pressure measured with both techniques. The difference in age of the men and women was statistically significant (Mann-Whitney U = 10166, p<0.0001). The CCT and the mean corneal curvature of the subjects included in the study followed a normal distribution (Shapiro-Wilk p = 0.35 and p = 0.10 respectively). The difference in CCT between men and women was not significant. The difference in mean corneal curvatures between men and women was statistically significant (Mann-Whitney U = 11315, p<0.05).
Values for subjects included in the effect of CCT and corneal curvature on pulsatile ocular blood flow tonography and Goldmann applanation tonometry study
Figure 1 shows that intraocular pressure measured using the GAT tends to be higher in eyes with thicker corneas. Figure 2 shows that intraocular pressure measured by the GAT tends to be lower in flatter corneas. Multiple regression analysis of the intraocular pressure measured using the GAT, CCT, and mean corneal curvature gives the following equation

Effect of central corneal thickness on intraocular pressure (IOP) measurements by Goldmann applanation tonometer (GAT). Results are shown for 334 subjects.

Effect of mean corneal curvature on intraocular pressure (IOP) measurements by Goldmann applanation tonometer (GAT). Results are shown for 334 subjects.

R = 0.22, p<0.001, 95% confidence interval (CI) of CCT slope is 0.13 to 0.04, 95% CI of mean CC slope is −2.66 to 0.38; where R is the multiple correlation coefficient, IOP GAT is the intraocular pressure measured using the Goldmann applanation tonometer, CCT is central corneal thickness in μm, and mean CC is the mean corneal curvature in mm.
Partial regression shows the effect of CCT is significant (t = 3.9, p<0.001) but the effect of mean corneal curvature is not statistically significant (t = −1.5, p>0.05). The regression equation remained the same when the subjects having intraocular pressure lowering treatment were removed from analysis.
Figure 3 shows that the POBF tonograph tends to give higher intraocular pressure measures in eyes with thicker corneas. Figure 4 shows that the POBF tonograph tends to give lower reading on flatter corneas.
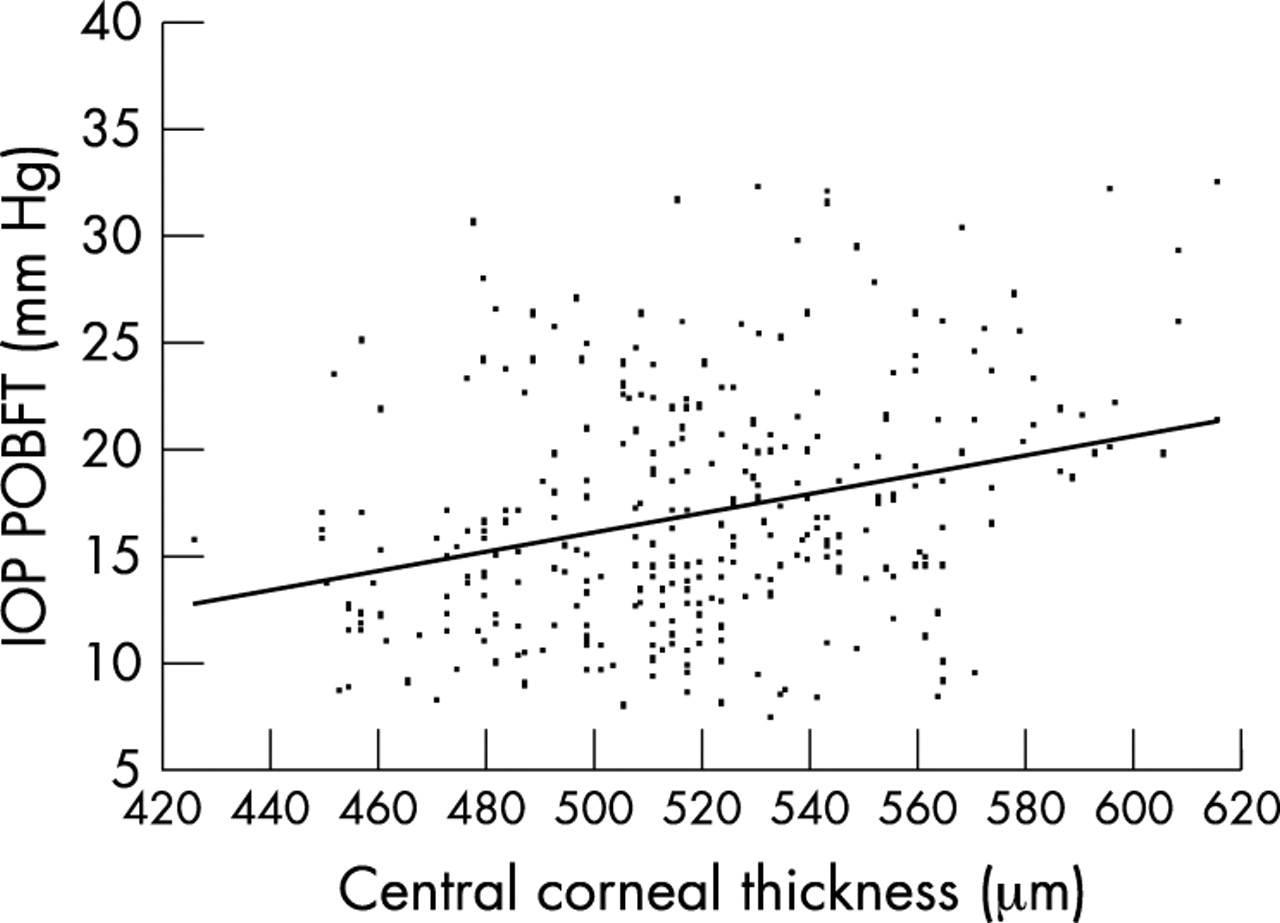
Effect of central corneal thickness on intraocular pressure (IOP) measurements by pulsatile ocular blood flow tonograph (POBFT). Results are shown for 334 subjects.
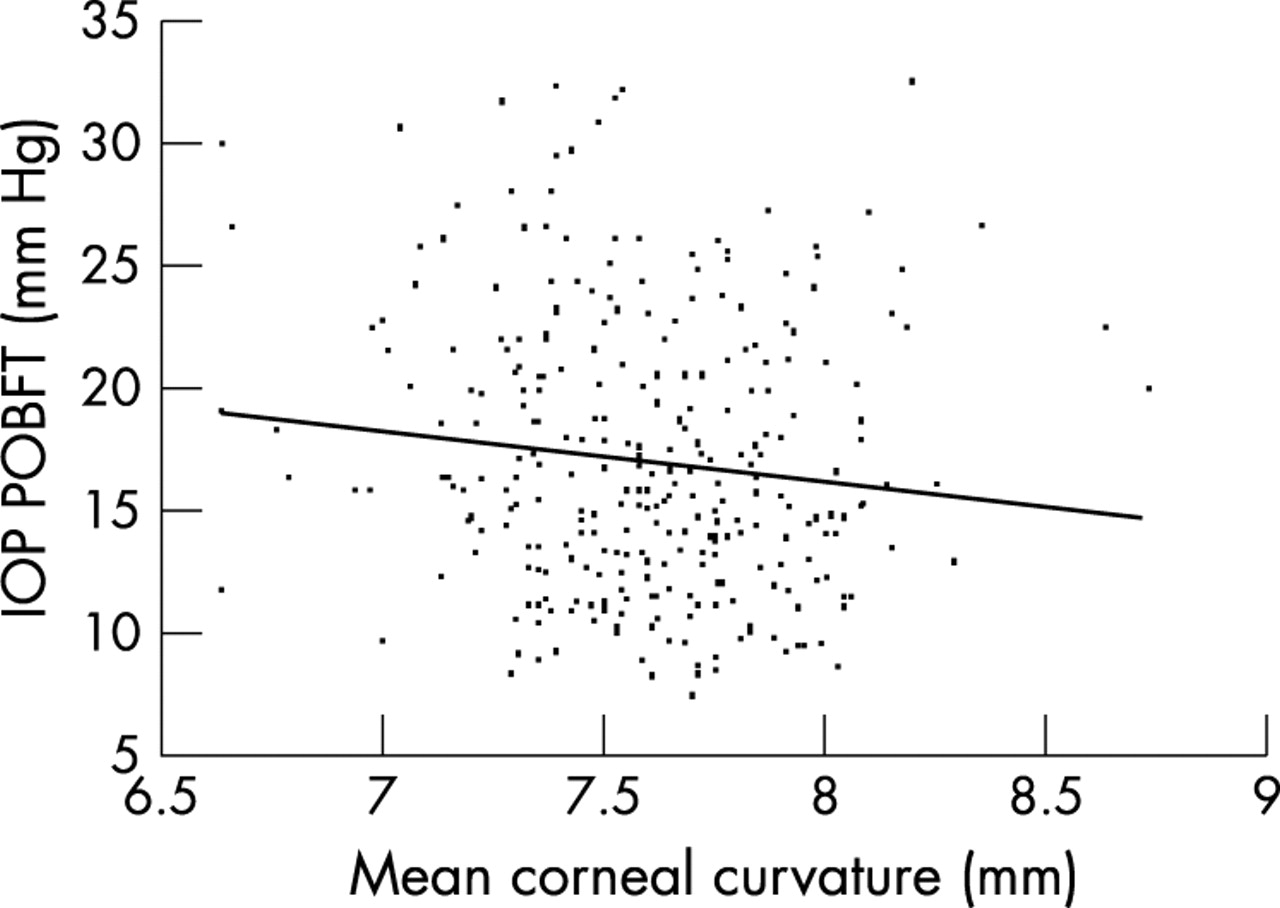
Effect of mean corneal curvature on intraocular pressure (IOP) measurements by pulsatile ocular blood flow tonograph (POBNFT). Results are shown for 334 subjects.
Multiple regression analysis of the intraocular pressure measured using the POBF tonograph and factors, CCT and mean corneal curvature gives the following equation:

R = 0.32, p<0.001, 95% CI of CCT slope is 0.03 to 0.06, 95% CI of mean CC slope is −4.22 to −0.76; where R is the multiple correlation coefficient, CCT is central corneal thickness in μm, and mean CC is the mean corneal curvature in mm.
Partial regression analysis shows that intraocular pressure is significantly affected by CCT (t = 5.8, p<0.001) and by mean corneal curvature (t = −2.8, p<0.01) which contributed 2% of the total variance in intraocular pressure.
There was an increase of 0.027 mm Hg in intraocular pressure measured by the GAT per μm increase in CCT. There was an increase of 0.048 mm Hg in intraocular pressure measured by the POBF tonograph per μm increase in CCT. Equation 2 remained the same when the subjects having intraocular pressure lowering treatment were removed from the analysis. Because we cannot determine directly the corneal thickness at which the POBF tonograph gives the correct intraocular pressure, we cannot be certain of which POBF tonograph measurements are overestimates and which are underestimates.
There was an increase of 1.14 mm Hg in measured intraocular pressure by the GAT per mm increase in mean corneal curvature. There was also an increase of 2.6 mm Hg in measured intraocular pressure by the POBF tonograph per mm increase in mean corneal curvature.
To investigate whether the effect of CCT and mean corneal curvature was significantly different between GAT and PBOF tonograph, we calculated the difference in intraocular pressure measured using the GAT and the POBF tonograph (equation 3). This indicates that the difference in slope of CCT and mean corneal curvature between intraocular pressure measured by the GAT and the POBF tonograph is significant.

R = 0.24, p<0.001, 95% CI of CCT slope is −0.03 to −0.11, 95% CI of mean CC slope is 0.27to 2.65; where R is the multiple correlation coefficient, CCT is central corneal thickness in μm, and mean CC is the mean corneal curvature in mm; GAT–POBFT is the difference in intraocular pressure measured by the GAT and the POBF tonograph.
Comparison of the POBF tonograph with GAT
Data were used from all 479 subjects (266 men and 213 women), of whom 276 were normal and 206 had open angle glaucoma, ocular hypertension, combined mechanism glaucoma, or were glaucoma suspects. In all, 134 subjects were on topical intraocular pressure lowering medications. Table 2 shows the age, intraocular pressure, and refraction of the subjects. The median difference in age between men and women was statistically significant (Mann-Whitney U = 23237; p = <0.001). Figure 5 shows a Bland-Altman bias plot, which examined the agreement between the GAT and the POBF tonograph. There was a tendency for the POBF tonograph to underestimate intraocular pressure at lower intraocular pressure and to overestimate at higher intraocular pressure when compared to the measurements obtained from the GAT which was significant (equation 4).
Values for subjects included in the comparison of the pulsatile ocular blood flow (POBF) tonograph with Goldmann applanation tonometer (GAT)

A Bland-Altman bias plot comparing intraocular pressure (IOP) measurement obtained by the pulsatile ocular blood flow tonograph (POBFT) with the Goldmann applanation tonometer (GAT). Results are shown for 479 subjects. The trend line indicates that when compared to the GAT the POBF tonograph underestimates IOP at lower IOPs and overestimates IOP at higher IOPs (equation 4).

R = 0.33, p<0.001, 95% CI of CCT slope is −0.32 to −0.17; where IOP is intraocular pressure, GAT is the Goldmann applanation tonometer, and POBFT is the pulsatile ocular blood flow tonograph. GAT–POBFT is the difference in intraocular pressure measured by the GAT and the POBF tonograph, R is the multiple correlation coefficient.
DISCUSSION
The GAT and the POBF tonograph tend to overestimate intraocular pressure in thicker and steeper corneas. This study showed that CCT affected the measurements obtained by the POBF tonograph to a greater degree than it affected the measurements obtained by the GAT. The POBF tonograph was about twice as sensitive as the GAT to CCT changes. Bhan and co-workers12 reported a 0.023 mm Hg change in intraocular pressure measured by the GAT and a 0.028 mm Hg change in intraocular pressure measured by the POBF tonograph per μm change in CCT. The latter effect was less than obtained in the present study and this may be due to the difference in the sample sizes of the two studies. Bhan and co-workers reported data from 181 eyes in 94 subjects and both the right and the left eye results were used for analysis.12 In a given individual the right and the left eye are not independent of each other and hence it is ideal that only one eye of each subject be used.3 If the data from both eyes are used then covariance between eyes should be accounted for. Unfortunately Bahn et al12 did not account for covariance.
In this study there was a bigger sample size than that used by Bhan and co-workers,12 and the data from only one eye of each subject was used for statistical analysis.
Corneal curvature also affected the measurements of both the POBF tonograph and GAT. The effect of corneal curvature on GAT has been reported previously.13 Mark13 concluded that the effect of corneal curvature on the intraocular pressure measurement by the GAT was not statistically significant owing to the wide scatter in the values of corneal curvature. The results of the present study confirm the findings of Mark.13
This is the first report that shows that mean corneal curvature influences intraocular pressure measurement using the POBF tonograph. The results of this study showed that mean corneal curvature affected the measurements obtained by the POBF tonograph more than it affects the measurements obtained by the GAT. The latter difference may be because the mechanical principle on which the POBF tonograph is based is different from that of the GAT.
Comparing the POBF tonograph with the GAT using a Bland-Altman bias plot revealed that the POBF tonograph underestimated intraocular pressure at lower values while overestimating intraocular pressure at higher values, which confirms the findings of Yang et al.14
Lam and co-workers15 found that the POBF tonograph overestimated intraocular pressure in all cases when compared to the GAT. This may be because of lack of randomisation between their measurements, with POBF measurements always performed before GAT in their study. It is possible that the second reading was lower due to a carryover effect from the first reading.
Singh and co-workers16 reported a good correlation between the POBF tonograph and the GAT, which was not surprising since the instruments are measuring the same parameter.
The manufacturers claims that the POBF tonograph is unaffected by corneal parameters, with CCT having only a negligible effect on its measurement. The results of the present study showed otherwise and suggest that CCT and mean corneal curvature should be included in the equations used in the POBF tonograph.
Acknowledgments
This study was presented in part as poster at the Association for Research in Vision and Ophthalmology annual meeting 2002. PG thanks the Wellcome Trust UK for a travel grant. We thank Dr Dawn Hawkins and Professor Shahina Pradhan for their help with the statistical analysis.