Article Text

Abstract
Aim: To determine the ocular haemodynamic response to gas perturbations in glaucoma.
Methods: Intraocular pressure (IOP), systemic systolic and diastolic blood pressure (SBP and DBP), and retrobulbar blood flow velocities, measured by colour Doppler imaging (CDI), were recorded at two visits. CDI was used to measure peak systolic and end diastolic velocities (PSV and EDV) and resistance index (RI) in the ophthalmic artery (OA), central retinal artery (CRA), and short posterior ciliary arteries (SPCAs). At the first visit, measurements were taken at baseline (B1: breathing room air) and during isoxic hypercapnia (end tidal PCO2 increased 15% above baseline) in 16 normal subjects and 12 patients with glaucoma. On another day, measurements were repeated at a second baseline (B2) and during hyperoxia (100% oxygen breathing) for 15 normal subjects and 13 glaucoma patients. Baseline systemic data were compared using paired t tests; REANOVA was performed to compare group differences at baseline and to determine the vessel response to each condition. Fisher’s LSD was used for post hoc comparison.
Results: Baseline OA PSV was lower for the glaucoma than for the normal group (p = 0.047); the groups were otherwise similar at baseline. IOP demonstrated no response to hypercapnia, but reduced during hyperoxia for both the normal subjects (p<0.0001) and glaucoma patients (p = 0.04). During hypercapnia, SBP increased in normal subjects (p = 0.03) and glaucoma patients (p = 0.01); DBP increased in normal subjects (p = 0.021). There was a corresponding increase in ocular perfusion pressure (OPP) for normal subjects (p = 0.01) and glaucoma subjects (p = 0.028), and as a result OPP was included as a covariate in the REANCOVA model. Hypercapnia resulted in increased PSV in the CRA of normal subjects (p = 0.035) and increased PSV and EDV in the SPCAs of glaucoma patients (p = 0.041 and p = 0.030 respectively). Hyperoxia resulted in reduced PSV and EDV in the ophthalmic arteries of normal subjects only (p = 0.001 and 0.031 respectively).
Conclusions: These findings suggest the presence of relative vasoconstriction in glaucoma patients, which is at least partially reversed by hypercapnia.
- hypercapnia
- hyperoxia
- glaucoma
- blood flow
- intraocular pressure
- CDI, colour Doppler imaging
- CRA, central retinal artery
- DBP, diastolic blood pressure
- EDV, end diastolic velocity
- IOP, intraocular pressure
- MAP, mean arterial pressure
- OA, ophthalmic artery
- OPP, ocular perfusion pressure
- PSV, peak systolic velocity
- RI, resistance index
- SBP, systolic blood pressure
- SPCAs, short posterior ciliary arteries
Statistics from Altmetric.com
- hypercapnia
- hyperoxia
- glaucoma
- blood flow
- intraocular pressure
- CDI, colour Doppler imaging
- CRA, central retinal artery
- DBP, diastolic blood pressure
- EDV, end diastolic velocity
- IOP, intraocular pressure
- MAP, mean arterial pressure
- OA, ophthalmic artery
- OPP, ocular perfusion pressure
- PSV, peak systolic velocity
- RI, resistance index
- SBP, systolic blood pressure
- SPCAs, short posterior ciliary arteries
Glaucomatous optic neuropathy is a disease characterised by pathological changes to the optic nerve head with an accompanying visual field loss and there is evidence to suggest a vascular involvement in the aetiology of the disease.1–4 Two principal theories of vascular participation have evolved: autoregulatory dysfunction and vasospasm. Vasospasm is defined as a reversible constriction or insufficient dilation of the vasculature in the absence of a recognisable anatomical defect.5 Several investigators have reported the presence of peripheral vasospasm in glaucoma.6–8 Harris et al2 proposed that vasospasm distal to the ophthalmic artery may be present in patients with normal tension glaucoma and can be reversed with the administration of a cerebral vasodilator. This condition may directly exacerbate the vascular insult to the optic nerve head in glaucoma. Studies have shown that the inferior temporal quadrant of the retina, in comparison with the superior portion, is less responsive to vasodilation and more responsive to vasoconstriction.9 The regional differences in the vascular haemodynamics of these two areas may account for the typical distribution of damage to the optic nerve and the preponderance of defects in the superior visual field in eyes with glaucoma.
If this is the case, glaucoma patients could potentially demonstrate three vascular characteristics. Firstly, under normal breathing conditions, blood flow to the eye will be reduced as a direct result of vasoconstriction.2 Secondly, vasodilatory stimulants will result in increased blood flow as this constriction is reversed. This effect may be more marked in glaucoma patients than in normal subjects since there is greater potential for dilation in vessels that were relatively constricted at the outset. Finally, the response to vasoconstrictive triggers will be less marked in glaucoma patients than in normal subjects because the vessels are already in a relatively constricted state.
In order to test the hypothesis that vasospasm underlies some cases of glaucoma, the known vasodilative effects of hypercapnia9–12 and vasoconstrictive effects of hyperoxia12–15 were used to stimulate autoregulatory responses in the retrobulbar vasculature of normal subjects and glaucoma patients. It was proposed that if the glaucoma patients’ vasculature was in a pre-existing reversible vasoconstricted state the glaucoma and normal groups would differ in their response to vasoactive stimuli.
METHODS
Experimental design
The study was divided into two experimental sessions which were performed at the same time of day in order to avoid diurnal fluctuation in ocular blood flow and intraocular pressure (IOP).16–18 At one session, measurements were made under baseline conditions (B1: room air) followed by repeated measures during induced hypercapnia. At a second session measurements were obtained at baseline (B2: room air) followed by induced hyperoxia. The two sessions took place on different days within a 2 week period.
Measures of systemic blood pressure, heart rate, and IOP (Goldmann applanation tonometry) were performed under each baseline and gas condition. Mean arterial pressure (MAP) was calculated as diastolic pressure +⅓ arterial pulse pressure. Mean ocular perfusion pressure (OPP) was calculated as ⅔ MAP − IOP.
Retrobulbar blood velocities were measured in the ophthalmic artery (OA), central retinal artery (CRA), and the nasal and temporal short posterior ciliary arteries (SPCAs) by a single observer using the Siemens Quantum 2000 colour Doppler imaging (CDI) system. Peak systolic velocity (PSV), end diastolic velocity (EDV) and Pourcelot’s resistive index (RI = (PSV − EDV)/PSV) were determined for each vessel group.
Subject groups
One eye of 16 normal subjects (mean age 60.1 (SD 11.1) years) and 13 glaucoma patients (59.5 (13.0) years) was randomly assigned and included in the study. All subjects and patients were systemically healthy with no known history, disorders, or medication thought to affect blood flow; they were free from asthma and other respiratory disorders. Subjects and patients had a visual acuity of 6/9 or better, refractive error of less than 6 dioptres and astigmatism less than 1.50 dioptres cylinder. Subjects were ophthalmoscopically normal and had no family history of glaucoma or diabetes. All patients were recruited from the ophthalmology clinic at Indiana University, were diagnosed with primary open angle glaucoma, and were taking pressure lowering treatment using topical β blocker therapy. They exhibited glaucomatous optic disc cupping, one or more recorded episodes of IOP>22 mm Hg, and repeatable Humphrey 24-2 visual field defects consistent with the diagnosis of glaucoma and categorised as early or moderate by the classification criteria of Hodapp et al.19 They presented no other ocular abnormality and had no history of ocular surgery. One normal subject did not complete the hyperoxia portion of the study and one glaucoma patient did not complete the hypercapnia portion.
All procedures conformed to the tenets of the Declaration of Helsinki, and were approved by the ethics review board of Indiana University. Subjects and patients gave informed consent before inclusion in the study.
Baseline, hypercapnia, and hyperoxia conditions
All measurements were recorded with the patient breathing through a mouthpiece and with nasal occlusion. End tidal carbon dioxide and oxygen levels were continuously recorded using a gas analyser (POET II model 602–3, Criticare Systems Inc, Waukesha, WI, USA).
Baseline conditions were achieved by breathing room air for 5 minutes. Hypercapnia was achieved by adding 4–6% carbon dioxide to the room air mixture until end tidal PCO2 was elevated 15% above baseline levels for 5 minutes. Hyperoxia was induced by breathing 100% oxygen for 5 minutes. Both induced conditions were continued long enough for all parameters to reach equilibrium.
Statistical analysis
Baseline systemic data were compared using paired t tests. Repeated measures analysis of variance (REANOVA) was used to determine differences between baseline values and between each baseline and the two corresponding gas conditions for the vascular data. Since an effect of OPP was identified between baseline and treatments, this was included as a covariate in the REANOVA model, in which significant change was considered to have occurred if p<0.05. Where significant change was identified by REANOVA, post hoc analysis using Fisher’s LSD test was used to confirm the significant effects.
The variability of CDI measurements for the three vessel groups under study have been published previously and are summarised in table 1.20 On this basis, with a power of 90%, and allowing up to 15% variability in the CDI measurements, this experimental design was sensitive to changes as small as 13.5% with a sample size of around 13 subjects per group. This sample size is similar to other published work in which gas breathing was required of volunteers.9,12
Colour Doppler imaging repeatability values
RESULTS
Table 2 summarises the sample statistics for both study sessions, and table 3 the baseline systemic blood pressure, IOP, and OPP for both groups.
Subject sample characteristics for the normal and glaucoma groups
Summary statistics showing systemic blood pressure, pulse rate, intraocular pressure (IOP), and ocular perfusion pressure (OPP) values before and after hypercapnia and hyperoxia (mean (SD))
Baseline conditions
There was no significant difference between glaucoma patients and normal subjects in systemic variables including age, pulse rate, diastolic and systolic blood pressure (tables 1 and 2). The PSV was generally lower in glaucoma patients compared to normal subjects, reaching significance only in the OA (p = 0.047). The PSV, EDV, and RI data for the OA, CRA, and SPCAs were otherwise similar for glaucoma patients and normal subjects. Summary data for the two baseline and corresponding gas conditions are shown in table 3 and the CDI data for all subjects and patients are summarised in table 4.
Summary table showing the mean (SD) (arbitrary units) factors for normal and glaucoma groups during each of the four breathing conditions
Systemic response to blood gas perturbations
A significant increase in systolic blood pressure during hypercapnia was observed for both the glaucoma patients (from 129.9 (27.7) to 136.9 (22.7) mm Hg; p = 0.01) and normal subjects (from 123.6 (12.5) to 130.0 (12.2) mm Hg; p = 0.03); diastolic blood pressure increased in normal subjects (from 77.2 (6.4) to 79.9 (6.4) mm Hg; p = 0.021). During hyperoxia, pulse rate decreased in both the normal subjects (from 75.6 (9.5) to 70.0 (7.8) bpm; p<0.001) and the glaucoma patients (from 75.8 (11.4) to 69.3 (9.5) bpm; p = 0.001). There were no other significant systemic changes resulting from either gas condition.
IOP response
There was no significant difference between the IOP for glaucoma patients and normal subjects at baseline or during hypercapnia. Under hyperoxic conditions, IOP reduced in both glaucoma patients (p = 0.04) and normal subjects (p<0.001). These findings are summarised in table 3.
Ocular perfusion pressure
The elevation of IOP during hyperoxia, and elevation of systemic blood pressure during hypercapnia, highlights the potential confounding effect of OPP on blood flow measures. Ocular perfusion pressure was statistically unchanged in response to hyperoxia, but elevated during hypercapnia in both the normal (p<0.0001) and glaucoma groups (p = 0.04). In order to account for this confounding variable OPP was included as a covariate in the REANOVA model.
Vascular response
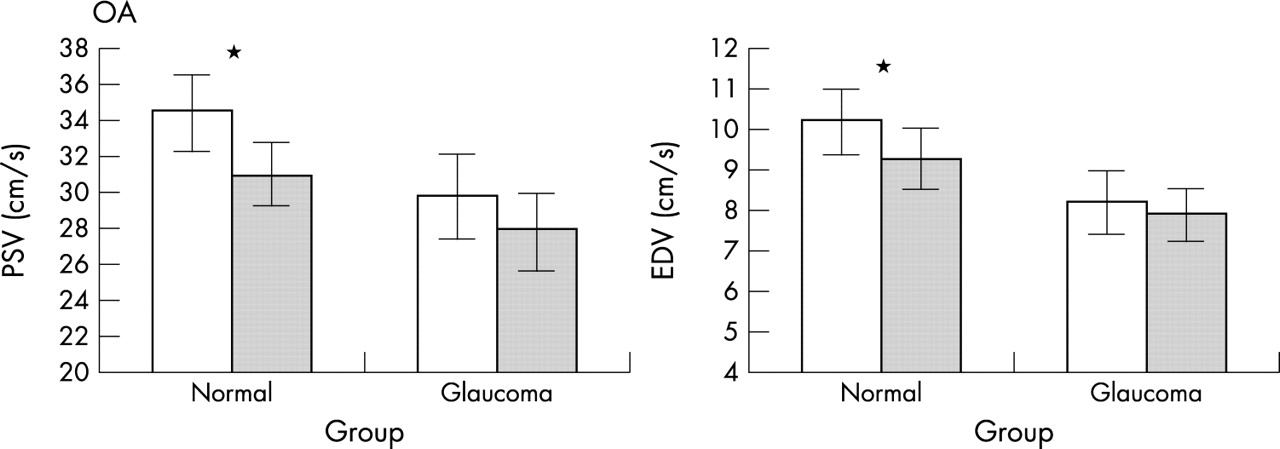
Hypercapnia resulted in a significant increase in PSV in the CRA of normal subjects (p = 0.035) and an increase in both the PSV and EDV in the SPCAs of patients with primary open angle glaucoma (p = 0.041 and p = 0.030 respectively) (fig 1). Hyperoxia resulted in significantly reduced PSV and EDV in the OA of normal subjects (p = 0.0001 and p = 0.031 respectively) (fig 2). There was no measurable change in blood flow parameters for the glaucoma patients.
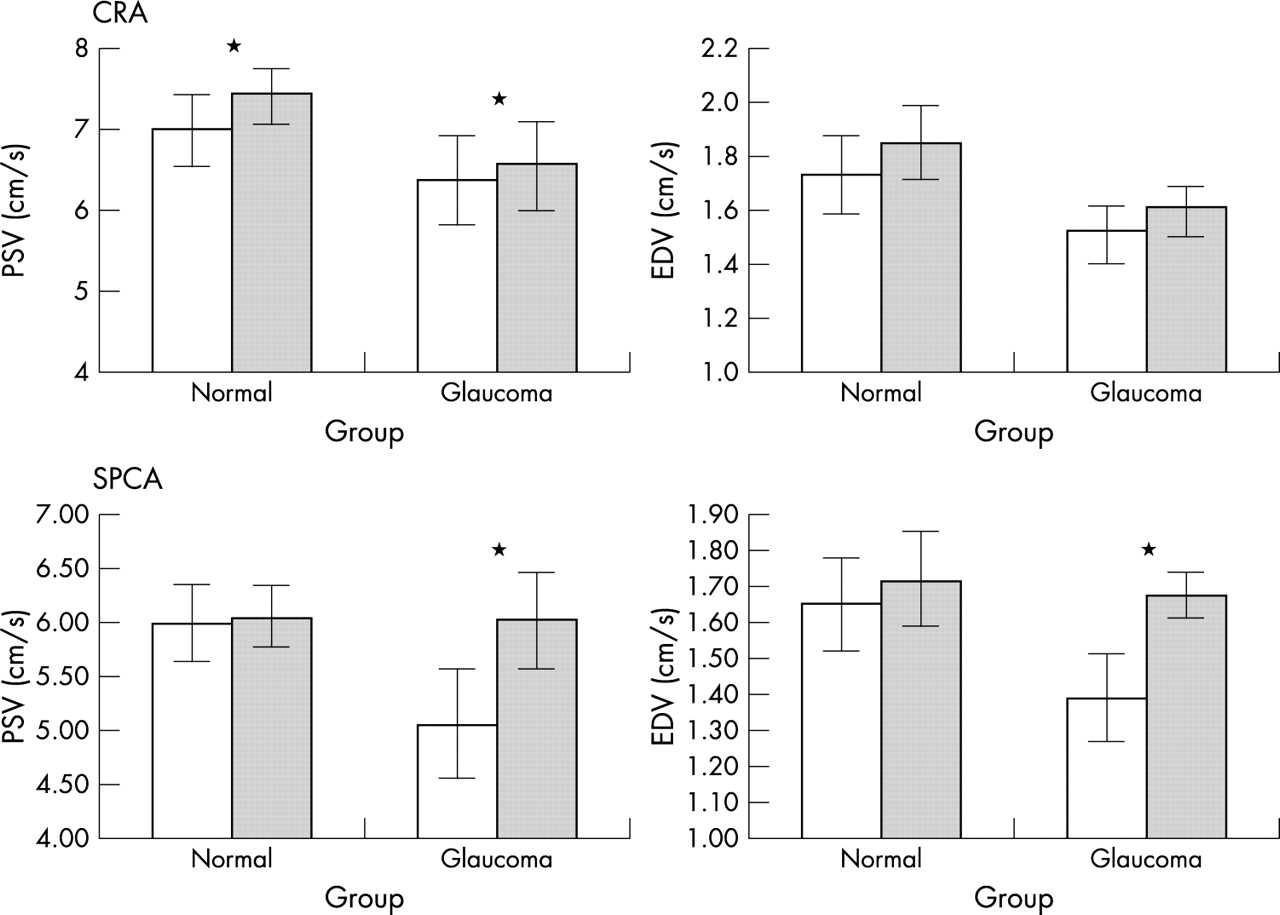
Histograms showing the mean (SD) peak systolic velocity (PSV) and end diastolic velocity (EDV) in the central retinal artery (CRA) and short posterior ciliary arteries (SPCAs) for normal subjects and glaucoma patients at baseline (open) and in response to hypercapnia (solid). *Significant effects where p<0.05.
Histograms showing the mean (SD) peak systolic velocity (PSV) and end diastolic velocity (EDV) in the ophthalmic artery (OA) for normal subjects and glaucoma patients at baseline (open) and in response to hyperoxia (solid). *Significant effects where p<0.05.
DISCUSSION
Ocular perfusion differences at baseline
Under room air conditions, retrobulbar blood velocities were generally lower in glaucoma patients compared to normal subjects, reaching significance only for the PSV measured in the OA. Although the smaller vessels failed to reach significance the finding of reduced peak systolic velocity in glaucoma is consistent with reduced retrobulbar blood velocities in glaucoma reported previously.2
The finding of reduced PSV alone in the glaucoma group at baseline can be interpreted in two ways. Firstly, from Bernoulli’s equation relating to laminar flow of a fluid through a tube, it is well established that flow velocity increases as a result of a constriction or narrowing in calibre.21 This would suggest that relative to the normal group the blood velocity in the glaucoma patients was reduced in response to a relatively vasodilated state at baseline. An alternative hypothesis is that reduced PSV occurs as a manifestation of a general reduction in blood flow in glaucoma, irrespective of any tendency towards either vasospasm or vasodilation. Since CDI measurements are not volumetric, total blood flow changes cannot be confirmed from these data alone. The general finding of reduced ocular blood flow in glaucoma has been reported elsewhere, and supports the second hypothesis.22–25
Responses IOP
All glaucoma patients were treated with a topical β blocker and as such their IOP was controlled to a level similar to that for the normal group. No significant IOP change resulted from hypercapnia and a relative resistance of IOP to hypercapnia has been reported previously.26,27
Hyperoxia resulted in reduced IOP in both normal subjects and glaucoma patients. This is consistent with previous reported findings.28 The IOP drop was greater in normal subjects than in glaucoma patients, a difference which may be accounted for by the previous pressure lowering treatment in the glaucoma group.
Vascular response to hypercapnia
Normal subjects exhibited an increase in PSV in the CRA in response to hypercapnia; however, no other effects were found in the normal group. This is consistent with previous CDI findings in the ocular vessels.2,11 Increased cerebral blood flow in response to hypercapnia has also been reported in normal subjects.9–11 The relatively mild reaction of the normal subjects in this study may be due to a response of the cerebral vasculature during hypercapnia in which elevated cerebral flow may have created a steal phenomenon, directing flow from the eye. Alternatively, it may result from the relatively mild vasodilatory effects of the gas levels administered during this study.
In the glaucoma group, an increase in both the PSV and EDV was identified in the SPCAs. In vitro models have shown that parallel changes in both PSV and EDV indicate a change in volumetric flow.29 This suggests that in this study volumetric flow increased during hypercapnia in the glaucoma patients; however, the change in the CRA of normal subjects was limited to PSV since the increase in EDV did not reach significance. It is most likely that this is also indicative of increased flow in the normal subjects, albeit to a lesser extent than for the glaucoma group. This would tend to suggest a greater vasodilatory response potential in the glaucoma patients in comparable experimental conditions. The findings would further support a pre-existing vasospasm or insufficient dilation that is reversed, in part at least, under hypercapnia.
Vascular response to hyperoxia
Several previous studies have shown that when the partial pressure of oxygen in the blood increases, blood flow decreases, presumably as the result of localised vasoconstriction.13,14,30–33 This finding was confirmed for the normal group, in whom a reduction in both the PSV and EDV was apparent in the OA in response to hyperoxia. As described earlier, the finding of reduced PSV and EDV in tandem is considered to be indicative of reduced volumetric flow.29 Conversely, no significant change in blood flow was observed for the glaucoma group. The absence of any response in the glaucoma group would seem to support the hypothesis of pre-existing vasospasm, creating an inability to constrict further under hyperoxic conditions.
The finding that blood flow measures reduced in the OA but not CRA or SPCAs of the normal group only could be attributed to the reduction in IOP seen in this group. As IOP decreases OPP increases thus increasing blood flow.34 The smaller calibre vessels of the ocular circulation, particularly the CRA and SPCAs, are more sensitive to change in altered OPP arising from IOP change than larger calibre vessels such as the OA, which are known to be relatively resistant to alterations in IOP.35,36 In this way the velocity lowering effects of hyperoxia could be masked by the reduction in IOP in the smaller vessels. Similar arguments could be attributed to the vascular changes in hypercapnia in which elevated systemic blood pressure in both groups could increase OPP. Furthermore, reduced resistance index in the CRA and SPCA and increased end diastolic velocity in the CRA of glaucoma patients exhibiting no alteration to systemic blood pressure has previously been reported,30 suggesting that systemic variables are unlikely to account for the findings in our study. Since both IOP and systemic blood pressure have been accounted for by including OPP as a covariate in the REANOVA model, these factors do not explain the vascular changes described in this study. It is interesting to observe that the responses in hypercapnia affected mainly the smaller vessels, while the responses in hyperoxia affected only the OA (figs 1 and 2), although any physiological basis for this is unclear.
In relation to the baseline condition; only PSV showed a reduction in the glaucoma group. It is difficult to interpret differences in PSV alone. Flow measures cannot be derived from CDI data; however, it has been demonstrated that coupled changes in PSV and EDV indicate a generalised change in volumetric flow.29 Given that our gas perturbation data suggest a pre-existing vasospasm in glaucoma, the difference in baseline PSV values may indicate a generalised reduction in overall flow in the glaucoma patients at baseline. However, without a matching deficit in EDV velocities, any interpretation of the PSV data is speculative.
One potential, and important criticism of this study is that the reported changes in CDI values were not consistent across the three vessel groups. It might be reasonable to expect that the increase in the blood flow of the SPCAs observed in glaucoma patients following hypercapnia should be evident in the OA and CRA also, and similarly for the other data reported. There are a number of reasons why this may not be the case. Firstly, there may be physiological differences such as, in this example, smaller calibre vessels may be more responsive to the gas perturbation than the larger diameter vessels. Alternatively, since the extent and nature of gas perturbation was quite mild, smaller changes in blood flow struggle to reach significance. The variability of systemic effects as an explanation is largely negated by the use of OPP as a covariate. One further argument is that the significant findings are a statistical anomaly because of multiple comparisons. This is extremely unlikely as our findings do show consistency with blood velocities increasing in response to hypercapnia and reducing in hyperoxia, as reported in numerous other studies. For this reason, a correction for multiple comparisons, which is often regarded as an overly conservative reaction to this type of data, was not applied in the study.37
In summary, this study demonstrated a reduction in the PSV of glaucoma patients compared to normal subjects. When corrected for the effects of change in OPP, hypercapnia resulted in increased blood velocities in normal and glaucoma patients which appear to be volumetric in nature. In contrast, hyperoxia had no effect on glaucoma patients while normal subjects demonstrated reduced blood velocities indicative of reduced blood flow. These findings may suggest that glaucoma patients have a pre-exisiting vasospasm that is reversed, at least in part, in response to vasodilatory agents, but is relatively resistant to vasocontrictors.
Acknowledgments
Supported in part by NIH grant EY10801, an unrestricted grant from Research to Prevent Blindness (AH), and the David Cole Fellowship, Glaucoma Society UK and Eire (SH).