Article Text

Abstract
Aim: To describe and classify patterns of abnormal fundus autofluorescence (FAF) in the junctional zone of geographic atrophy (GA) in patients with age related macular degeneration.
Methods: Digital FAF images were recorded in 164 eyes of 107 patients using a confocal scanning laser ophthalmoscope (cSLO; excitation 488 nm, detection above 500 nm) as part of a prospective multicentre natural history study (FAM Study). FAF images were obtained in accordance with a standardised protocol for digital image acquisition and generation of mean images after automated alignment.
Results: Image quality was sufficient for classification of FAF patterns in 149 eyes (90.9%) with lens opacities being the most common reason for insufficient image quality. Abnormal FAF outside GA in 149 eyes was classified into four patterns: focal (12.1%), banded (12.8%), patchy (2.0%), and diffuse (57.0%), whereby 12.1% had normal background FAF in the junctional zone. In 4% there was no predominant pattern. The diffuse pattern was subdivided into four groups including reticular (4.7%), branching (27.5%), fine granular (18.1%), and fine granular with peripheral punctate spots (6.7%).
Conclusions: Different phenotypic patterns of abnormal FAF in the junctional zone of GA can be identified with cSLO FAF imaging. These distinct patterns may reflect heterogeneity at a cellular and molecular level in contrast with a non-specific ageing process. A refined phenotypic classification may be helpful to identify prognostic determinants for the spread of atrophy and visual loss, for identification of genetic risk factors as well as for the design of future interventional trials.
- AMD, age related macular degeneration
- cSLO, confocal scanning laser ophthalmoscope
- ETDRS, Early Treatment Diabetic Retinopathy Study
- FAF, fundus autofluorescence
- GA, geographic atrophy
- HRA, Heidelberg retina angiograph
- LF, lipofuscin
- RPE, retinal pigment epithelium
- VA, visual acuity
- fundus autofluorescence
- confocal scanning laser ophthalmoscopy
- age related macular disease
- geographic atrophy
- retinal imaging
Statistics from Altmetric.com
- AMD, age related macular degeneration
- cSLO, confocal scanning laser ophthalmoscope
- ETDRS, Early Treatment Diabetic Retinopathy Study
- FAF, fundus autofluorescence
- GA, geographic atrophy
- HRA, Heidelberg retina angiograph
- LF, lipofuscin
- RPE, retinal pigment epithelium
- VA, visual acuity
- fundus autofluorescence
- confocal scanning laser ophthalmoscopy
- age related macular disease
- geographic atrophy
- retinal imaging
In developed countries age related macular degeneration (AMD) has become the most common cause for registered blindness. Severe visual loss results from choroidal neovascularisation (CNV), pigment epithelial detachment or geographic atrophy (GA) of the retinal pigment epithelium (RPE).1 GA is thought to be the natural end stage of the atrophic AMD process when CNV does not develop.2 While CNV is the more common cause for visual loss, GA is responsible for approximately 20% of the severe visual impairment from AMD.3,4 While extensive research in recent years has been attributed to the pathomechanisms of CNV formation and its inhibition, relatively little attention has been focused on GA as a common disorder.
With the advent of confocal scanning laser ophthalmoscopy (cSLO) it has become possible to visualise fundus autofluorescence (FAF) and its spatial distribution in vivo.5–8 It represents a tool to evaluate the RPE during ageing and in retinal disease.9 As shown by spectrometric investigations by Delori and associates FAF is mainly derived from lipofuscin (LF) in the RPE.10 Excessive accumulation of LF represents a common pathogenetic pathway in various monogenetic and complex retinal diseases and may precede photoreceptor degeneration.11–13 Recent studies described FAF changes in early and advanced atrophic AMD.7,14 Hereby, excessive LF accumulation in the junctional zone precedes the development of GA and the enlargement of pre-existing GA.15 Preliminary observations using FAF imaging suggested that there may be distinct phenotypes with regard to changes in FAF in the junctional zone of GA.7 Based on these findings a prospective, multicentre, natural history study was initiated to more precisely identify FAF variations in patients with AMD. Here we report on a refined classification of FAF patterns in the junctional zone of GA in patients with AMD.
METHODS
Digital FAF images were obtained as part of the prospective, multicentre Fundus Autofluorescence in Age-related Macular Degeneration (FAM) Study using a cSLO (Heidelberg retina angiograph, HRA classic, and HRA 2, Heidelberg Engineering, Dossenheim, Germany), the optical and technical principles of which have been described previously.7,15
For FAF imaging, an argon blue laser (HRA classic) or an optically pumped solid state laser (HRA2) (both 488 nm) was used for excitation. Emitted light was detected above 500 nm (barrier filter). With an interference filter, the green share of the argon laser light was reduced to the extent that the ratio of the intensities of green and blue is below 10−7. The above mentioned cut-off filter suppressed blue argon excitation light at 488 nm by a factor of 10−6. Consequently, it was assumed that reflectance signals do not contribute to the FAF image obtained from the posterior pole of the examined eye. This blockage even suppressed reflexes on the optical surface of the lens.
Maximal retinal irradiance using the HRA was approximately 2 mW/cm2 for a 10°×10° frame and was therefore well below the limits established by the American National Standards Institute (ANSI) and other international standards (ANSI Z136.1; 1993). Images were immediately digitised and processed using a flexible frame processor and subsequently displayed on a computer screen. The digital images were saved on hard disc for further analysis and processing.
For acquisition of FAF images a standard operation procedure was developed which included focusing of the retinal image in reflection and red-free mode, sensitivity adjustment and acquisition of at least 15 single 30°×30° FAF images which encompassed the entire macular area and at least part of the optic disc. In order to amplify the FAF signal the best nine single images were aligned and a mean image was calculated after detection and correction of eye movements using image analysis software (Heidelberg Eye Explorer, Heidelberg Engineering, Dossenheim, Germany).
Patients with unilateral or bilateral GA caused by AMD were included into the study. Any sign of exudation or choroidal neovascularisation as well as previous drug, surgical, or laser therapy were exclusion criteria. The study followed the tenets of the Declaration of Helsinki and was approved by the local ethics committees. Informed consent was obtained from each patient after explanation of the nature and possible consequences of the study. Best corrected central visual acuity (VA) was determined using Early Treatment Diabetic Retinopathy Study (ETDRS) charts. EDTA blood samples were taken for future molecular genetic analyses. The pupil of the study eye was dilated with 1% tropicamide and FAF images were obtained from each patient.
FAF images were evaluated by two independent readers. In case of discrepancy a third reader was involved to arbitrate. Abnormal FAF was defined as an increased or decreased FAF signal compared with the FAF outside such lesions, the latter being referred to as normal FAF, which shows an even distribution, with a typical lower intensity in the macula caused by absorption of macular pigment in the neurosensory retina and lower LF levels in central RPE cells.5,6 There is also a lower signal along large retinal vessels (absorption) and at the optic disc (absence of autofluorescent material).
RESULTS
Digital FAF images were obtained from a total of 164 eyes from 107 patients (mean age 72.96 (SD 7.43) years; 44 male and 63 female patients) with unilateral or bilateral GA caused by AMD.
Sixty eyes (36.6%) had multifocal areas of atrophy whereas 103 eyes (62.8%) presented with an unifocal patch of GA. In one eye (0.6%) delineation of the GA was not clear and the distinction between unifocal and multiple confluent areas of atrophy therefore impossible. An extrafoveolar location of the atrophic areas was observed in 86 eyes (52.4%); GA involved the foveola in 77 eyes (47.0%). In one eye (0.6%) the atrophic patch seemed to reach the fovea, but an exact demarcation was not possible. Because VA was 10/25 the foveola probably was not involved in the atrophic process. The total area of atrophy ranged from 0.4–39.8 mm2 (mean 6.6 mm2). Mean VA in eyes with extrafoveolar GA was 10/20 (range 5/200–20/16), and 10/50 (range 5/200–20/20) in eyes with subfoveal GA.
GA as well as retinal vessels and the optic disc typically showed a markedly decreased FAF signal as previously described.15–17 Evaluation of the FAF pattern outside GA requires good image quality and was performed in FAF images with sufficient image quality regarding contrast and sharpness. FAF image quality was sufficient for evaluation in 149 (90.9%) out of 164 eyes. Cataract and inability of proper fixation during the image recordings represented the most common reasons for insufficient image quality. Frequency data therefore refer to 149 eyes. In 18 eyes (12.1%) there was no abnormal FAF noted in the junctional zone. The FAF outside the GA (fig 1) showed a normal even distribution.
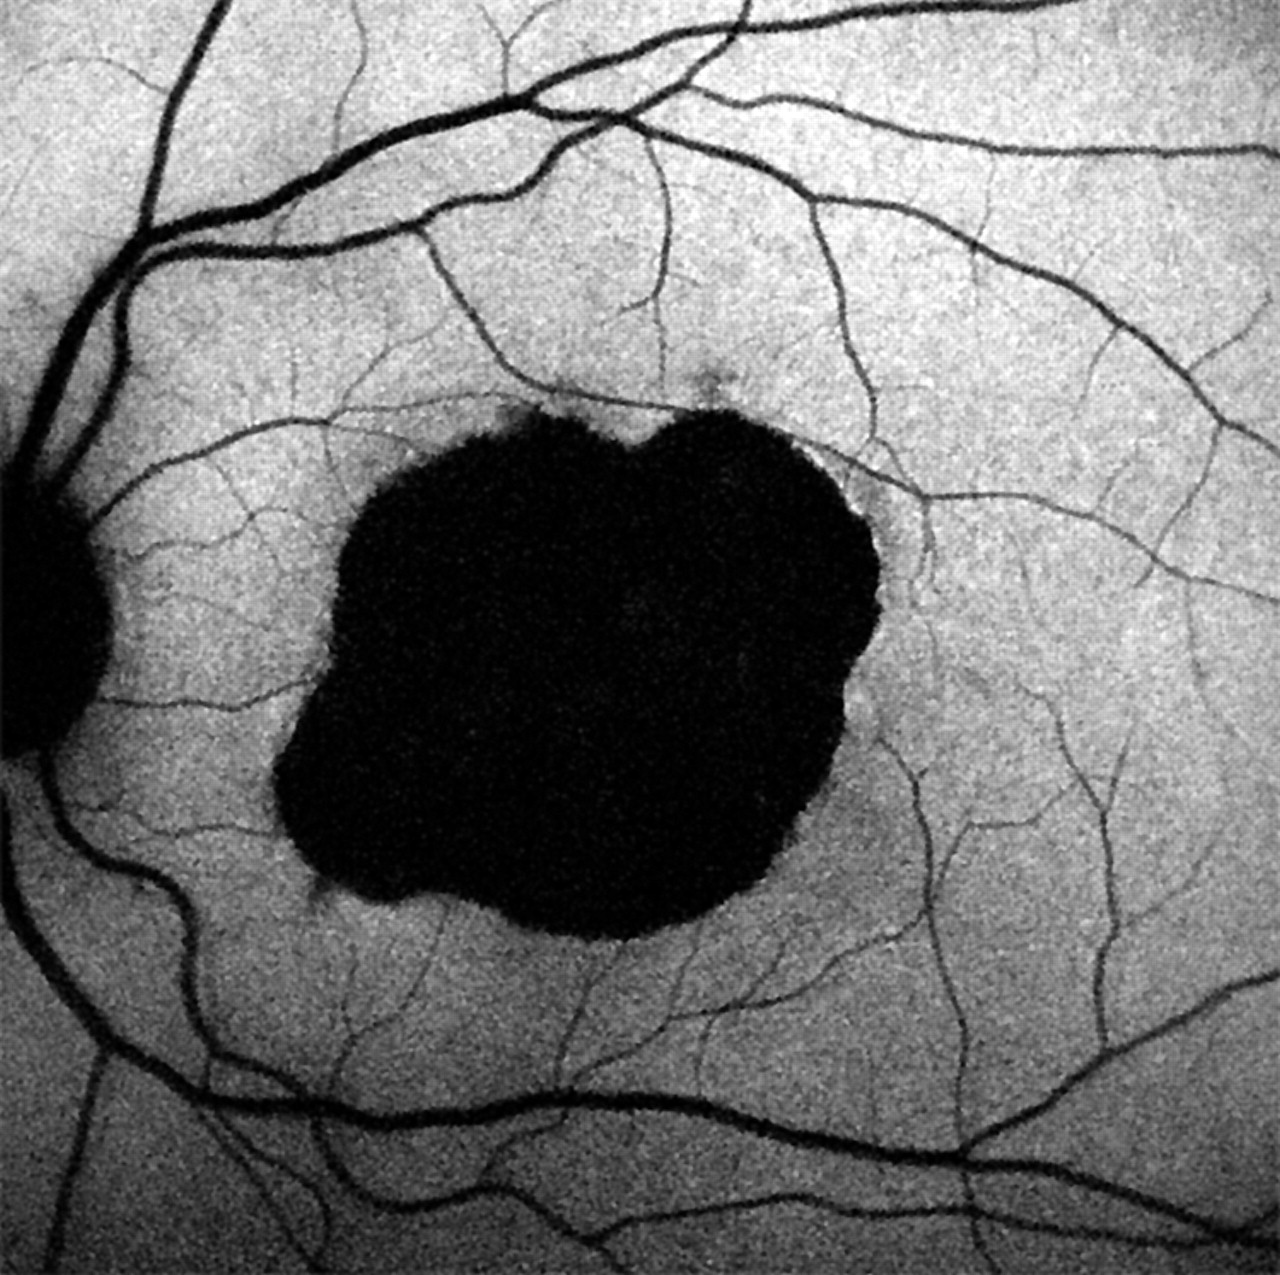
Normal background fundus autofluorescence outside the central patch of geographic atrophy (66 year old patient, left eye, VA 5/80). The atrophic area is associated with a markedly decreased fundus autofluorescence because of the absence of retinal pigment epithelial cells, and, thus, autofluorescent lipofuscin.
The following patterns of abnormal FAF in the junctional zone of GA were identified (table 1).
Variations in fundus autofluorescence (FAF) in the junctional zone of geographic atrophy (GA) of 149 eyes* with atrophic AMD
Focal increased autofluorescence
In 18 eyes (12.1%) single or multiple small spots of markedly focal increased FAF were present at the margin of the atrophic patch (fig 2).

Multiple patches of markedly focal increased fundus autofluorescence at the margin of the atrophic patch (77 year old patient, right eye, VA 5/80).
Band of increased autofluorescence
In 19 eyes (12.8%) there was a continuous stippled band of increased FAF surrounding the entire atrophic area (fig 3).

Band of increased fundus autofluorescence surrounding the geographic atrophy (69 year old patient, right eye, VA 10/40).
Patchy increased autofluorescence
Three eyes (2.0%) showed larger areas of patchy increased FAF outside the area of GA. FAF intensity of these patches tended to be of lesser degree compared with the focal pattern described above (fig 4).

Larger areas of patchy increased fundus autofluorescence outside the area of geographic atrophy (66 year old patient, right eye, VA 10/20).
Diffuse increase of autofluorescence
The most frequent pattern of increased FAF in eyes with GA was a pattern referred to as diffuse, which was noted in 85 eyes (57.0%). Hereby, FAF changes were not confined to the margin of the atrophic areas but showed a larger spread at the posterior pole. These diffuse changes showed again interindividual differences that were classified into four subtypes.
Reticular
A so called reticular pattern (seven eyes, 4.7%) was characterised by various lines of increased FAF with a preferred radial orientation (fig 5A).

Diffuse types of increased fundus autofluorescence in the junctional zone of geographic atrophy. (A) Reticular pattern of increased fundus autofluorescence with a preferred radial orientation (69 year old patient, left eye, VA 10/32). (B) Diffuse pattern of increased fundus autofluorescence with relatively short branching linear features (79 year old patient, left eye, VA 10/32). (C) Diffusely increased fundus autofluorescence with a granular-like appearance surrounding the well defined area of geographic atrophy (55 year old patient, right eye, VA 10/20). (D) Peripheral elongated small lesions with increased fundus autofluorescence signal (62 year old patient, right eye, VA 10/100).
Branching
In 41 eyes (27.5%) there was a diffuse increased FAF with a fine branching pattern of an increased FAF signal (fig 5B).
Fine granular
This pattern was characterised by a larger area of increased FAF with a granular-like appearance surrounding the GA, and was present in 27 eyes (18.1%) (fig 5C). There was a clear border between the granular increased FAF and the surrounding normal background FAF.
Fine granular with peripheral punctate spots
In 10 eyes (6.7%) with a diffuse FAF change surrounding the atrophic area there were elongated small lesions with increased FAF signal (fig 5D).
Six eyes (4.0%) were not grouped to one of these types. There was no predominant FAF pattern in the junctional zone of GA which led to discrepancy between the different readers. Frequency data of table 1 therefore show the results of 143 eyes of 97 patients. Bilateral GA was present in 46 patients. In 41 patients (89.13%) the pattern of abnormal FAF outside the GA was identical reflecting a high degree of intraindividual symmetry.
DISCUSSION
With the advent of confocal scanning laser ophthalmoscopy it is possible to visualise FAF in vivo. While preliminary reports indicated interindividual variations in association with GA in patients with AMD7 a refined classification of FAF changes in the junctional zone of GA is reported here. Refined phenotyping is not only important to identify prognostic determinants, it appears also as a prerequisite to determine specific genetic factors in a complex, multifactorial disease such as AMD.18,19 We propose that the FAF classification system presented here may be used in other studies on GA caused by AMD.
RPE LF contains the dominant fluorophores responsible for FAF.20 Excessive LF accumulation represents a common final pathogenetic pathway in various monogenetic and complex retinal disorders. LF granules also accumulate with age.21 Recent experimental studies have addressed possible molecular mechanisms of how excessive LF may interact with normal cellular functions of RPE cells. Hereby, A2-E has been identified as a main autofluorescent compound of LF.22 Toxic properties of A2-E include phototoxic and detergent effects as well as inhibitory effects on lysosomal function.23–26 Identification of other molecular species besides the LF proteome is in progress.27 Recently developed animal models that share phenotypic characteristics of AMD including excessive LF and A2-E accumulation in the RPE, add to the understanding of potential underlying molecular mechanisms.28,29 Clinical evidence of adverse LF effects comes from FAF investigations and psychophysical studies. Scholl et al have demonstrated impaired photoreceptor function in association with increased FAF by fine matrix mapping in patients with AMD including GA.30 We have shown that increased FAF in the junctional zone of GA and, thus, excessive LF accumulation precede the development of new areas of GA or the enlargement of pre-existing atrophic patches,7 and is associated with impaired retinal sensitivity on microperimetry testing.31
Various limitations have to be considered for FAF imaging. Media opacities including lens opacifications may result in FAF images that cannot be analysed adequately. Furthermore, this system currently does not allow for absolute quantitation of the FAF signal. However, this is not a prerequisite to delineate topographic patterns of abnormal FAF and, therefore, it might not be required to detect absolute levels of FAF. The accurate delineation of atrophic areas is facilitated in FAF imaging compared to fundus photographs as a result of the absence of the RPE containing the dominant fluorophores.32,33
Rückmann et al initially described the presence of elevated FAF surrounding GA.14 Different abnormal FAF patterns in the junctional zone of GA in association with AMD have been identified previously in a smaller cohort.7 Based on these findings the hypothesis was raised that there may be marked interindividual variation in the presence of high intraindividual symmetry with distinct phenotypic patterns in FAF.33 Here we examined patients using FAF imaging. Particular features of FAF changes allowed for classification into various patterns.
GA in association with AMD has been shown to gradually enlarge over time.34–37 Schatz and McDonald determined the yearly spread of atrophy in fundus photographs.36 Medium sized areas of atrophy grew faster than smaller areas. Sunness et al determined rates of spread in a cohort of 123 patients and identified interindividual variaton.2,37 So far, prognostic determinants for the individual progression of atrophic AMD, and, therefore, additional visual loss, are unknown. Since there is both experimental and clinical evidence of toxic properties of LF23–26 we hypothesise that different phenotypes of FAF changes in the junctional zone of GA are associated with different rates of spread of pre-existing atrophy. Our preliminary analyses indicate that progression is smaller in eyes with no or minimal FAF alteration in the junctional zone as opposed to eyes with widespread diffuse changes (Bindewald et al ARVO 2004; #2960). As different patterns of increased FAF might reflect heterogeneity at a cellular and molecular level, this classification might be helpful to identify genetic factors. The high degree of symmetry of abnormal FAF in patients with bilateral GA points rather towards specific genetic contributions than non-specific ageing processes.33
In summary, based on a cross sectional analysis of patients with GA associated with AMD a classification system is presented to distinguish phenotypic patterns of FAF alterations in the junctional zone of atrophic areas. The observations implicate excessive RPE LF accumulation in atrophic AMD and are useful to test hypotheses in this respect. Non-invasive FAF imaging obviously gives information over and above conventional imaging methods. Expanding the ongoing FAM study with longitudinal analyses it may be useful to identify prognostic determinants for the progression of atrophic AMD, to monitor future interventional trials and to determine genetic factors.
APPENDIX
Centres and members participating in the Fundus Autofluorescence in Age-Related Macular Degeneration (FAM) Study: Department of Ophthalmology, University of Bonn, Germany: investigators: Almut Bindewald, Hans-Martin Helb, Felix Roth, Steffen Schmitz-Valckenberg, Johannes N Witten, Frank G Holz study nurse: Martina Hofmann; Department of Ophthalmology, University of Heidelberg, Germany: investigators: Jork J Jorzik, Daniel W Miller, Helena Sieber, Stefan Dithmar study nurse: Maria Herrmann Institute for Medical Statistics and Biometry, University of Heidelberg, Germany: Jens Dreyhaupt, Manuela Herzig, Maria Pritsch, Anja Schuldt; Ulrich Mansmann Coordination Center for Clinical Trials, University of Heidelberg: Marcus Schwabedissen, Kristina Unnebrink; Department of Ophthalmology, University of Aachen, Germany: investigator: Andreas Weinberger; Department of Ophthalmology, University of Leipzig, Germany: investigators: Wilma Einbock, Andreas Moessner, Ute Schnurrbusch-Wolf, Henrike Wustemeyer, Sebastian Wolf; Department of Ophthalmology, University of Wuerzburg, Germany: investigators: Juliane Mlynski, Claudia Keilhauer; St Franziskus Hospital Muenster, Germany: investigators: Georg Spital, Astrid Meister, Daniel Pauleikhoff.
REFERENCES
Footnotes
-
↵* Fundus Autofluorescence in Age-related Macular Degeneration Group. See appendix for list of participants.
-
Supported by Deutsche Forschungsgemeinschaft DFG Ho 1926/2-1, 1926/2-2 DFG Research Priority Program AMD SPP 1088.