Article Text

Abstract
Purpose Binocular visual field (VF) loss is linked to driving impairment, guiding authorities to implement fitness to drive requirements for VFs. Yet, evidence is limited regarding the specific types of VF defect that impede driving. This study used a novel gaze-contingent display to test the hypothesis that superior VF loss impacts detection of driving hazards more than inferior loss.
Methods The Hazard Perception Test (HPT) is a computer-based component of the UK examination for learner drivers. It measures the response rate for detecting hazards in a series of real-life driving films, yielding a score out of 75, calculated based on the efficiency of detecting 15 hazards. Thirty UK drivers with healthy vision completed three versions of the HPT in a random order. In two versions, a computer set-up incorporating an eye-tracker modified a simulated VF defect in the superior and inferior VFs, respectively, according to the users’ real-time gaze as they completed the HPT. The other version was unmodified to measure the baseline performance.
Results Participants’ mean score at baseline was 49/75 (SD=9). Mean (SD) performance fell by 18% (40(11)) when viewing films with a superior defect and 12% with an inferior defect (43(10)). These average differences were statistically significant (p<0.001; 95% CI for mean difference=1–7)
Conclusions In this study, simulated VF defects impaired the ability to detect driving hazards relative to participants’ normal performances, with superior defects having more impact than inferior defects. These results could help inform the design of fairer tests of the VF component for fitness to drive.
- Glaucoma
- Field of vision
Statistics from Altmetric.com
Introduction
Patients with binocular visual field (VF) defects report difficulties with driving1 ,2 and can make more driving errors than people with healthy vision.3 ,4 Moreover, people with VF defects are involved in more traffic collisions than normally sighted individuals.5–7 As such, anyone with bilateral VF loss is required by UK law to report to the Driving Vehicle and Licensing Agency (DVLA) for VF assessment and those failing to meet the standards must surrender their license. While this stance is taken with wider safety in mind, this outcome could have many negative consequences for the persons losing their licence.8–11 Driving authorities must, therefore, have complete confidence regarding what exactly constitutes an ‘unsafe’ VF defect.
Current criteria for the VF component for legal fitness to drive are based on a complicated configuration of missed test points on the binocular Esterman Visual Field Test (EVFT).12 The EVFT is used because of its common availability on automated perimeters and is relatively simple to administer but was never designed with driving in mind. As such, many of the VF locations measured by the EVFT are likely not relevant to the driving scene (figure 1). The EVFT test grid is also weighted heavily towards the central and inferior VFs; locations deemed important for functioning when the EVFT was initially designed for manual perimetry more than 30 years ago.13 Ultimately, there is no systematic evidence that any of the tested VF locations specified in the standards are actually related to the visual demands of driving.

The Esterman Visual Field Test (EVFT) grid superimposed over a road scene as seen from the driver's perspective (A), and an example of a clinical EVFT output (B). Test locations within the region covered by the car windscreen are coloured red: it can be seen that many points on the EVFT, especially in the inferior visual field, are irrelevant to the driving scene.
Typically, the impact of VF loss on driving is assessed by comparing patients with another group of people with healthy vision (controls) on aspects of their driving performance.3–5 ,14 ,15 However, each patient has his or her own unique pattern of VF loss, making it difficult to determine the importance of specific regions of the VF for driving performance. Moreover, the sensory and physical demands of driving are highly multifactorial,16 so results from these case–control studies are always difficult to interpret, no matter how carefully all confounders are corrected for. An alternative, allowing more experimental control, is to investigate the effect of a specific simulated VF defect on the performance of a person with normal vision on a driving task. Therefore, the effects of a carefully chosen VF defect configuration can be investigated relative to a person's own normal performance with healthy vision. This idea is central to the study that we report here.
In this study, we developed a novel software application that modifies the position of a simulated VF defect according to a person's gaze as they watch a video. We used this set-up to investigate the effects of simulated VF loss on performance on the HPT: a computerised assessment that forms part of the official UK examination for learner drivers.17 Specifically, this study investigates the effects of visual degradation in the superior (upper) parts of the field of view compared with similar loss in the inferior (lower) VF. Our primary hypothesis is that superior defects impair hazard perception more than inferior defects.
Methods
Participants
Participants were recruited via advertisements placed around City University London. A participant was required to hold a valid UK driving license and to have prior experience of the HPT as part of the theory component of their official Driver and Vehicle Standards Agency (DVSA) test. Participants were also required to meet DVSA standards for vision.12 A visual examination prior to the study confirmed that all participants had a corrected binocular acuity of 6/6 or better according to an Early Treatment Diabetic Retinopathy Study chart. VFs were examined in all participants in both eyes using an SITA-Fast 24-2 assessment on a Humphrey Field Analyser (HFA; Carl Zeiss Meditec). All the resulting VFs were within normal limits. Everyone was in good self-reported general health, with no history of an eye disease or any medical condition that would impact driving according to the DVLA standards.
All participants gave their informed written consent prior to participation. Participants received financial reimbursement for their time.
Design
DVSA HPT
The HPT is a compulsory component of the DVSA driving examination for learner drivers in the UK. It is a computerised assessment consisting of a series of road scene videos (each around 1 min long) filmed from the driver's perspective. The task is to click the computer mouse when a hazard is detected (ie, an event that would cause the driver in the video to take action by slowing down, changing direction or stopping the vehicle). The participant scores between 0 and 5 according to how quickly one responds to each of 15 hazards in 14 videos, yielding a total score out of 75. A score of 44 out of 75 is required to pass the DVSA assessment. Other studies investigating vision loss and driving have used the HPT to investigate aspects of driving behaviour.18 ,19
Gaze-contingent software
Central to this study was the use of a purpose-written software application (authored in C# using Microsoft XNA Game Studio) that applies a ‘simulated’ VF defect in correspondence to the user's position of gaze as they view video content. Sensitivity values for chosen left and right eye VFs, obtained from the outputs from HFA SITA-standard 24-2 VF tests, are inputted into the system, which then combines these values to produce a representation of the binocular VF (integrated visual field (IVF)).20 For each video frame (extracted at the screen refresh rate every 1/60 s), all locations of the scene that correspond to regions of VF loss (∼<25 dB) are degraded systematically. This process involves applying layers of Gaussian blur coded using High-Level Shader Language, whereby the blur intensity increases depending on the severity of VF degradation. The resulting simulated defect is set to coincide with the position of an HFA 24-2 VF defect. The application incorporates a Tobii TX300 eye tracker (Tobii, Danderyd, Sweden) that provides automatic recording of participants’ gaze positions at 300 Hz following calibration using the predefined algorithm. The application ‘moves’ the blurred region(s) in accordance with this gaze position information, effectively allowing users with otherwise normal vision to experience the effects of a region of visual degradation in real time.
Study set-up
Participants were seated with their head placed in a comfortable head rest at a fixed distance of 60 cm from an integrated 58.4 cm LCD monitor (resolution 1920×1080 pixels), subtending half angles of 26° and 14°. They then completed three versions of the HPT (selected from a DVSA-approved training DVD). During one version of the HPT, a simulated VF defect was set to move in the superior VF according to gaze position as a participant searched for hazards. This simulated ‘superior’ VF defect (figure 2B) was based on an actual patient's VF information. The same VF defect, but reflected in the horizontal meridian, was applied to a second version of the HPT, thus producing an equivalent ‘inferior’ VF defect that moved according to gaze. A third, unmodified HPT was completed as a measure of baseline performance. Figure 2 shows example screenshots taken from each version of the task and the corresponding greyscale binocular VFs that were used to construct the simulations. The order of the three conditions (‘baseline’, ‘superior defect’ and ‘inferior defect’) was counterbalanced across participants, with the ordering of the videos within each HPT version also randomised.
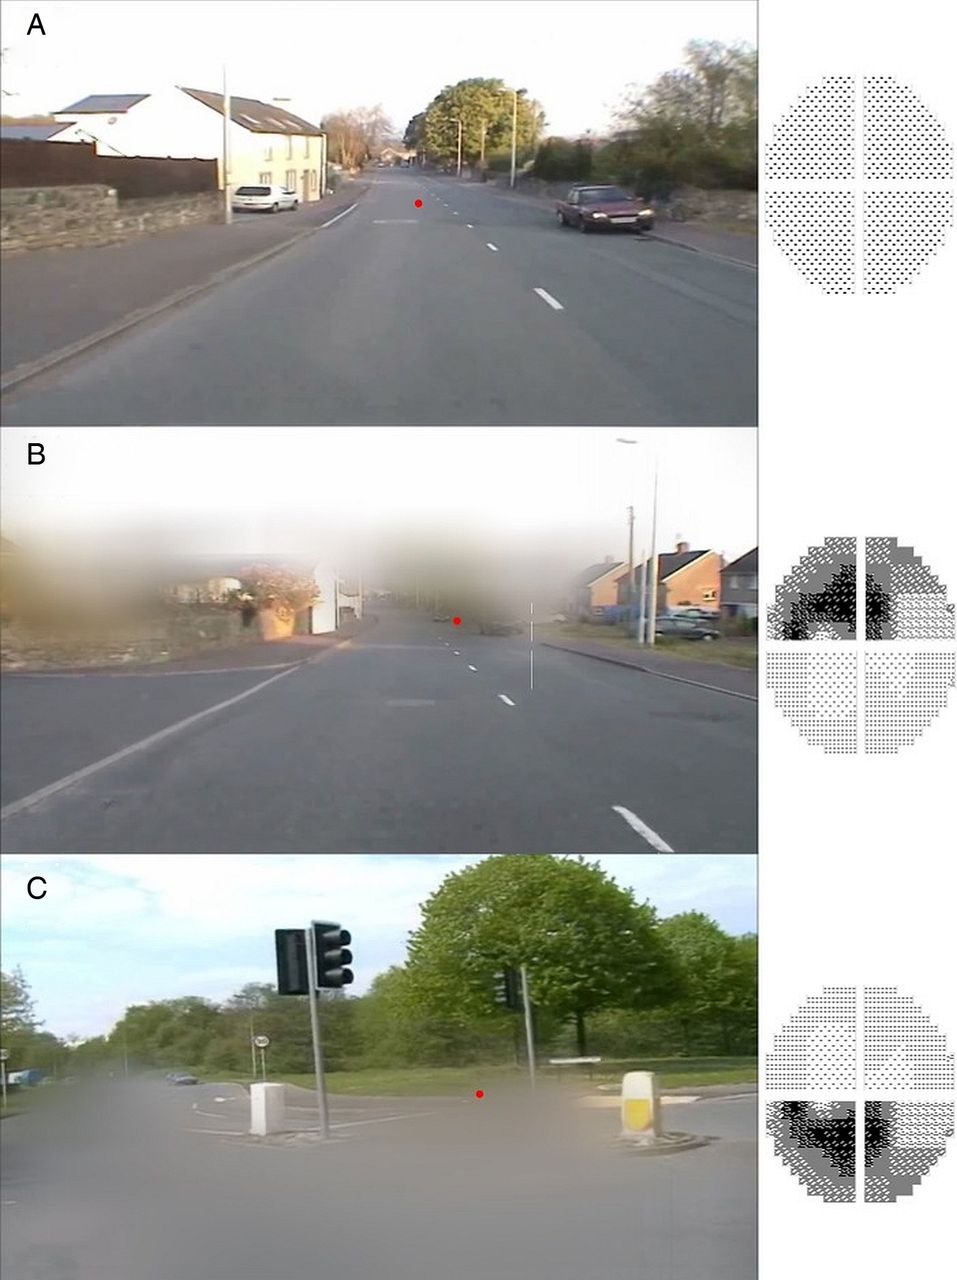
Example screenshots from the three versions of the Hazard Perception Test (HPT) completed by participants. One version of the HPT was unmodified (no simulated defect) to measure baseline performance (A). In the other versions, a simulated visual field (VF) defect moved according to the person's gaze position (red dot) in the superior (B) and inferior (C) VF, respectively. Greyscales of the binocular VFs used to construct the simulated defects are shown.
Participants were informed that they would complete three versions of the HPT and were instructed to click the left button of the computer mouse whenever they saw a hazard occur. They were also warned that excessive ‘clicking’, or responding in a pattern, would mean they would score zero for that video. These instructions were consistent with the official requirements of the HPT, a task everyone had completed in the past during their official driving theory test.21 Participants were told that some of the films would include a distorted area that would be aligned to their gaze. Participants also completed a set number of practice videos (that were not included in the analysis) to allow them to get accustomed to the specific demands of that experimental condition.
Additional information about higher-order visual processing abilities was also gathered using the brief paper-and-pencil Trail Making B Test (‘Trail B’). In this assessment, participants are timed as they connect a series of items according to a pre-defined sequence of numbers and letters (1-A-2-B-3-C…). A slower processing speed in this task, which also assesses problem solving, executive functioning and working memory, has been shown to be correlated with heightened motor accident involvement.22
Analysis
A repeated-measures general linear model (GLM) analysis of variance (ANOVA) was used to calculate within-person differences for total score across the three defect conditions. The Bonferroni adjustment for Type 1 error was applied to post-hoc multiple comparisons. The change in total score between the ‘baseline’ and ‘superior’ and ‘baseline’ and ‘inferior’ conditions was calculated for each person. Spearman's rho correlations were then used to determine whether there was an association between these resulting variables and the time taken to complete the Trail B assessment. All statistical analyses were conducted using SPSS V.21 (IBM Corporation, Somers, New York, USA).
Results
Thirty UK drivers (mean age 22 years (SD:3); 44% female) took part in the study. Participants had held a UK driving license for 4 years (SD:2) on average. The time taken to complete the Trail B assessment ranged between 19 and 120 s (Mean: 45 (SD:20)).
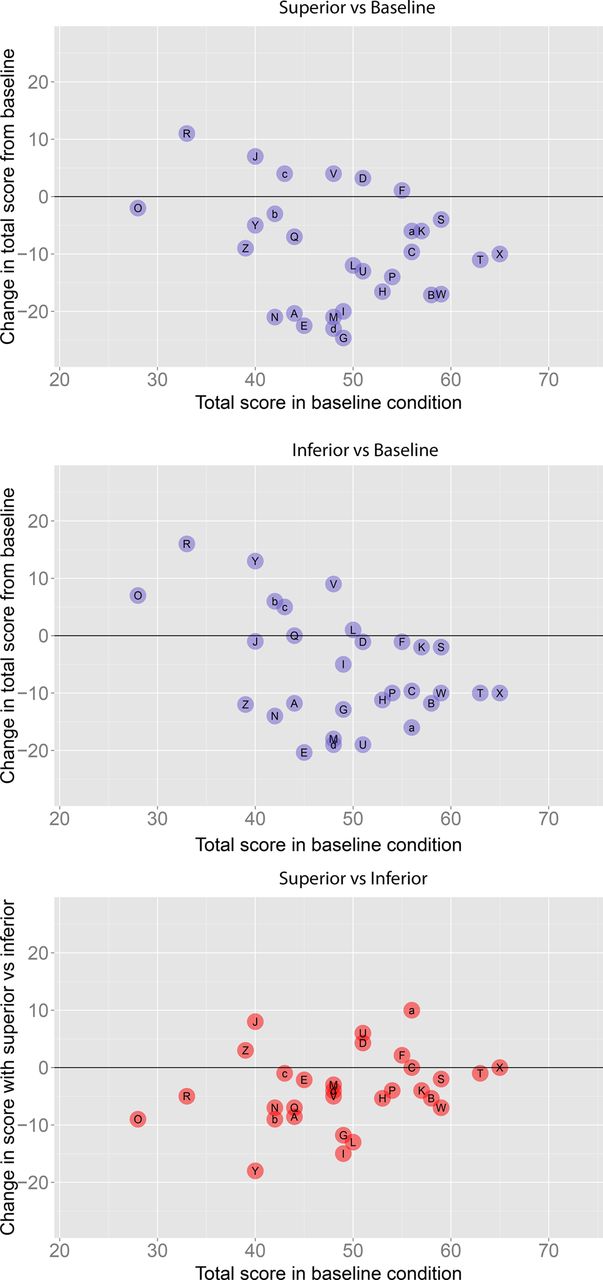
The sample mean baseline total score (no defect) for the HPT was 49 out of 75 (SD:9). When participants completed the HPT with a superior VF defect, the mean total score fell by 18% on average compared with each person's baseline performance (mean=40; SD=11). When completing the HPT with the inferior defect, the average total score was 12% worse than baseline (mean=43; SD=10). Results from a GLM repeated-measures ANOVA (Greenhouse–Geisser correction applied) showed that there was a statistically significant main effect (F(2,48)=17.5; p<0.0001). Bonferroni adjusted pairwise comparisons revealed that the total score in both the superior (p<0.0001) and inferior blocks (p=0.01) was significantly reduced compared with baseline performance (95% CIs for the differences (CI) were 5 to 14, and 1 to 10, respectively). Furthermore, the total score with a superior defect was significantly worse than the total score with an inferior defect (p=0.01; CI 1 to 7). Figure 3 shows the change in each participant's score relative to their baseline score with a superior and inferior defect, and their performance with a superior defect compared with an inferior defect. There were no statistically significant associations between Trail B time and change in score from baseline in the superior (ρ=0.05) and inferior conditions (ρ=−0.07).

Individual value plots showing each person's total score when completing the Hazard Perception Test (HPT) without a defect (x-axis) and the change in score relative to this baseline (y-axis) when completing the HPT with a simulated visual field (VF) defect in the superior VF (top graph) and inferior VF (middle graph). The y-axis of the bottom graph shows the change in score with a superior defect relative to each person's total score with an inferior defect. Each participant has been assigned a unique letter for comparative purposes.
Discussion
Driving is a fundamental component of an independent lifestyle for many patients. A revoked driving license may cause adverse personal, social and professional repercussions.9 ,11 On the other hand, the safety of the driver and other road users is paramount. Although the DVLA standards (and those in other countries) list criteria for the VF that must be met for a patient to retain one's license, it is surprising that little scientific research has been conducted to support the VF configurations and criteria specified. The current study employed a novel study design to provide a first step towards an evidence base for these criteria.
First, simulated VF defects were shown to significantly impair hazard perception. These results support existing evidence that binocular VF loss impacts driving14 ,7 ,23 ,24 and may indicate that increased motor vehicle accident rates for patients with VF loss are related, at least in part, to an impaired ability to detect hazards in a timely manner. Worsening performance was not related to a slower visual processing time in the Trail B assessment, implying that the effects shown were visual, as opposed to being related to the increased cognitive demands of the task.
Secondly, the results revealed a statistically significantly effect that showed HPT performance was worse with a defect in the superior VF when compared with identical loss in the inferior VF. When driving, a hazardous event is first likely to be observed in the upper regions of the VF corresponding to the vehicle's windscreen, with the inferior VF incorporating regions inside the vehicle itself, such as the steering wheel, speedometer and other controls. Therefore, it is perhaps not surprising that obscuring the superior VF will lead to heightened difficulty with detecting road hazards. This finding, nevertheless, challenges the appropriateness of basing criteria for the VF component for fitness to drive on performance on the EVFT, given this assessment's configuration of test points (figure 1).13
It should be noted that we report average results here; not all participants experienced a reduction in total score when completing the study with simulated defects in the superior and inferior VFs. Future studies may wish to consider whether these participants are using certain strategies to help improve their vigilance when detecting hazards or driving. Some patients may compensate for their visual deficit by using more effective scanning strategies when driving,25 a finding that has also been reported when considering other visual tasks.26 ,27 We, therefore, plan to investigate whether compensatory eye movement changes may have helped some participants to overcome hazard perception impairment.
There are limitations to the approach adopted by our study. We used findings suggesting that patients perceive blurred or distorted areas in their VF,28 but the simulation may exaggerate the effects of real VF loss. Our set-up cannot mimic the likely compensatory or adaptive aspects of vision loss. For example, many patients experience cortical plasticity, whereby the brain ‘fills in’ missing information,29 explaining why some report ‘missing regions’ in their vision.28 Each person's experience is likely to differ, making it difficult to replicate in an experimental set-up such as the one used here. Furthermore, extra practice trials would not help capture real adaptation to VF loss, which will involve a combination of visual, cortical, cognitive and psychological processes. Also, in comparison with older people, our younger participants may have been able to adapt more quickly to the simulated defects.
Moreover, the HPT and driving are not one and the same; participants were focused only on hazard detection and had no actual control over a vehicle. The HPT also does not examine key tasks such as monitoring speed or changing or keeping to lanes and our eye-tracking necessitated minimising head movements – a constraint that is not realistic in driving or in the real HPT. If the objective is to design a vision test to make recommendations about safe driving, then studies measuring actual driving and vehicle accidents are also required. However, no two car journeys are the same, making it difficult to compare individuals’ performances in an objective, systematic manner using an on-road driving assessment. Driving simulators allow for standardised and objective assessments of driving performance, providing higher control and repeatability when compared with on-road assessments while maintaining the appearance of driving.30 However, the virtual tasks are less realistic than real driving, for example, detecting a target letter flashed on the driving screen31 or a single target hazard such as a pedestrian.15 Although still far removed from actual driving, our current computer-based set-up maintained this experimental control but at least used actual driving scenarios typically encountered on the road.
There were also some strengths to our study design. There are many individual variables that could affect an individual's hazard perception performance such as their age, hand–eye co-ordination, gender or experience. The specific characteristics of visual loss will also vary from patient to patient. However, by comparing each person against his or her own ‘normal’ hazard detection performance, we can eliminate the influence of many of the potential confounders seen in case–control designs and exert more control over VF defect properties. The experimental set-up we report here could be used to help design a bespoke grid of VF test points more relevant to the driving experience. In turn, a VF test designed in this way could be used in future prospective studies of real driving safety. We considered VF loss due to glaucoma here, but our study design also lends itself well for investigations considering the impact of VF loss in other eye conditions. For instance, it may be useful to consider the impact of loss on the right versus the left VF, thus simulating vision loss with hemianopia.
In summary, the decision to revoke a patient's driving license could potentially be life-changing; therefore, it is important that this judgement is evidence-based. The results reported in this study highlight the importance of considering the location of a VF defect when assessing whether or not a patient is safe to drive. Moreover, the findings provide a first step towards improving the fairness of standards when assessing the VF component for fitness to drive.
Acknowledgments
The authors would like to acknowledge our small panel of patients with glaucoma who provided valuable guidance regarding the development of the gaze-contingent software application and general study design.
References
Footnotes
-
Correction notice This article has been corrected since it was published Online First. Several of the instances of DSA in the text have been updated to DVSA.
-
Funding This work was supported by a research award from the International Glaucoma Association (http://www.glaucoma-association.com/).
-
Competing interests None.
-
Ethics approval School of Health Sciences REC City University London.
-
Provenance and peer review Not commissioned; externally peer reviewed.
Linked Articles
- At a glance