Article Text

Abstract
Aims: To determine the level of agreement between merged monocular visual field tests (the integrated visual field) and the binocular Esterman visual field test in classifying patients’ visual status for UK legal fitness to drive. To examine the link between these two tests and the useful field of view (UFOV) test, a test which is considered to be a surrogate for the visual capability for safe driving.
Methods: Primary open angle glaucoma patients with bilateral overlapping visual field defects were recruited prospectively. Patients performed the bilateral monocular field tests (to generate the integrated visual field), the Esterman test and the UFOV test on the same visit. Patients were classified as “pass” or “fail” by both the integrated visual field and the Esterman test. UFOV risk scores were calculated for each patient.
Results: 65 patients were recruited. Substantial agreement was found between the integrated visual field and the Esterman test in classifying patients as “pass” or “fail” (kappa = 0.69). No patients classified as “pass” by the integrated visual field test were classified as “fail” by the Esterman test. Eight patients who were classified as “pass” by the Esterman test were classified as “fail” by the integrated visual field test. The UFOV risk characteristics of these eight patients suggested they were more similar to those of the 13 patients who were classified as “fail” by both the tests, than the 44 patients who were classified as “pass” by both tests.
Conclusions: The integrated visual field test agrees well with the current method (Esterman) of classifying visual fields with regard to legal fitness to drive in the United Kingdom in patients with glaucoma; it appears superior to the current method in identifying those with reduced fitness to drive as measured by the UFOV. The integrated visual field test could perform a valuable screening or diagnostic role in the assessment of glaucoma patients’ fitness to drive.
- DVLA, Driving and Vehicle Licensing Authority
- EVFT, Esterman visual field test
- IVF, integrated visual field
- UFOV, useful field of view
- visual fields
- perimetry
- driving
- glaucoma
- DVLA, Driving and Vehicle Licensing Authority
- EVFT, Esterman visual field test
- IVF, integrated visual field
- UFOV, useful field of view
- visual fields
- perimetry
- driving
- glaucoma
Statistics from Altmetric.com
- DVLA, Driving and Vehicle Licensing Authority
- EVFT, Esterman visual field test
- IVF, integrated visual field
- UFOV, useful field of view
- visual fields
- perimetry
- driving
- glaucoma
- DVLA, Driving and Vehicle Licensing Authority
- EVFT, Esterman visual field test
- IVF, integrated visual field
- UFOV, useful field of view
- visual fields
- perimetry
- driving
- glaucoma
The difficulties in establishing standards for visual acuity in individuals with regard to their fitness to drive are well known.1 Setting bench marks for visual field defects is equally, if not more, problematic,2 mainly because the association between visual field loss and driving accidents is equivocal.3 The availability in various automated perimeters of the binocular Esterman visual field test (EVFT) has meant this has become the standard used by ophthalmologists to implement the guidelines recommended by the Driving and Vehicle Licensing Authority (DVLA). On advice from the relevant medical panel, the DVLA has recently revised the recommended minimum visual field permissible for safe driving using this test. The requirement of a field of vision at least 120° measured on the horizontal remains unaltered but the standard with respect to the central (20°) binocular field was deemed to be overly rigorous. This has led to a change in the metric used to quantify central defects flagged by the EVFT. It may well be that the ambiguities with regard to patients failing previous standards are to do with the inadequacy of the EVFT for this purpose: there is no published research directly linking results from this test with the requirements for safe driving. In addition, the test pattern for the EVFT, primarily devised for manual perimetry more than 20 years ago,4 was not developed with driving in mind. Moreover, research has shown that central full threshold monocular fields are better guides to assessing visual processing relevant to mobility in both glaucoma5,6 and other visually disabling conditions.7
Ideally, it would be best to measure the binocular visual field required for driving with a test specifically designed to evaluate the function required for driving but at present no such test is available. In the clinical management of ocular conditions detailed threshold testing of monocular fields, based on well established automated white on white perimetry is the standard for measuring visual fields. A method of assessing whether a patient’s visual fields render them fit to drive, and which is based on this standard method of clinical testing, would be a practical solution since it would not involve any extra testing beyond that routinely done for diagnostic and monitoring purposes.
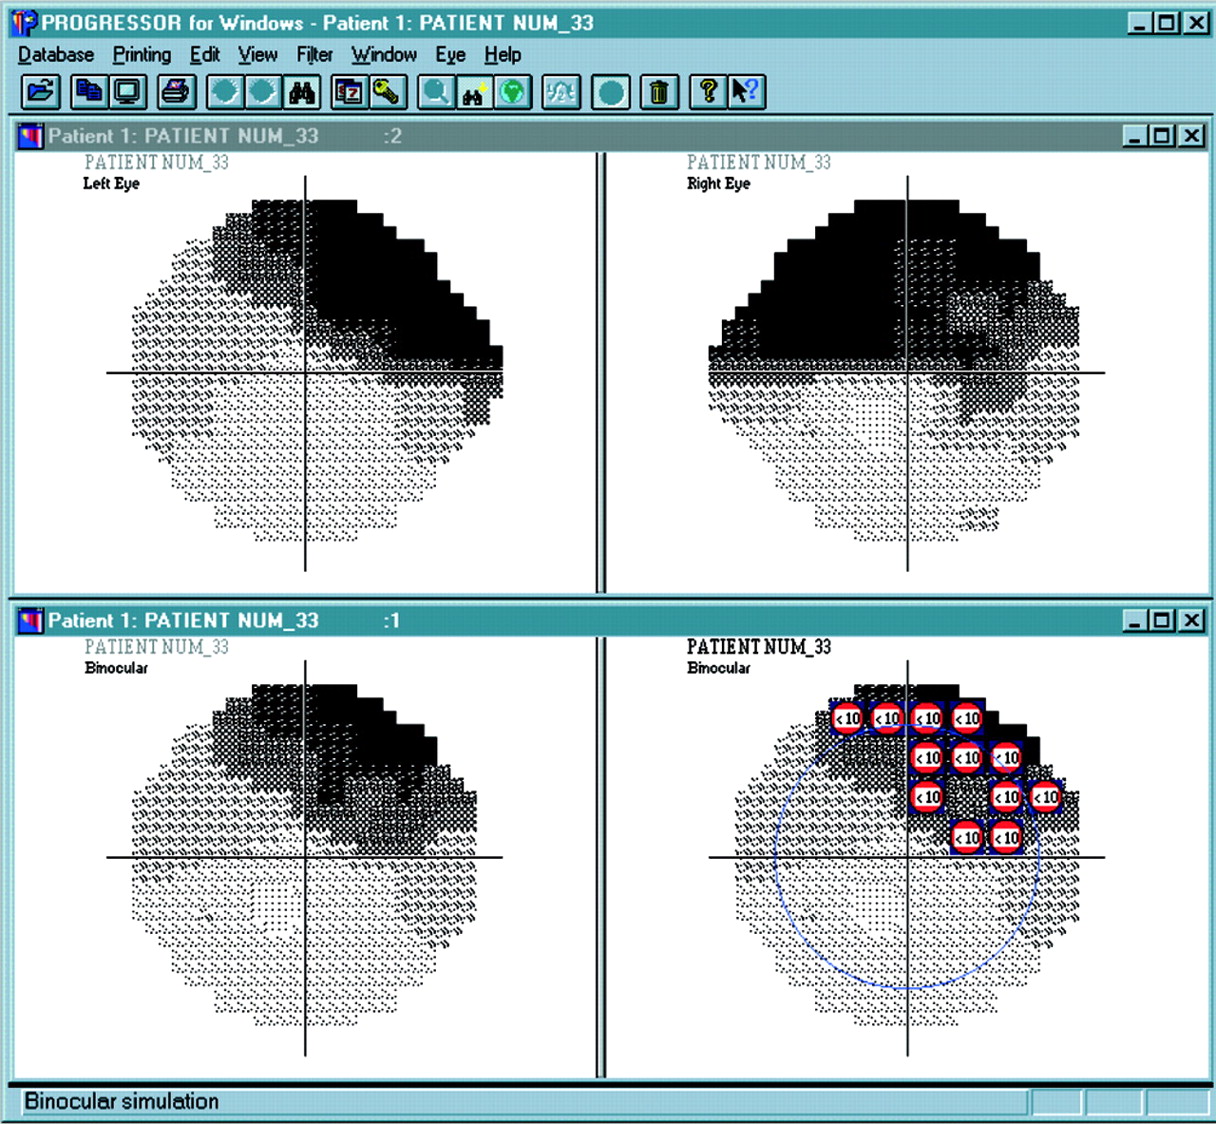
We have previously described a novel method of estimating a patient’s binocular field of view from their monocular measurements (fig 1).8 Computer software merges individual sensitivity values from left and right visual fields to generate a map of the central binocular visual field, known as the integrated visual field (IVF). Nelson-Quigg and colleagues9 examined different ways of “merging” results from monocular visual fields and recommended that the IVF technique is best at representing the central binocular visual field in patients with glaucoma. The IVF has also been shown to be more relevant than the binocular EVFT in measuring patients’ self reported problems with performing daily tasks and general mobility.6

An image captured from the software developed to produce the integrated visual field. The example shows a patient with visual field defects in both eyes. The left (top left) and right (top right) monocular fields are shown as Humphrey type grey scales. The corresponding sensitivity values from the “overlapped” monocular eyes are simply compared with the maximum or better value, used in the integrated visual field (shown in the lower left panel). The lower right panel is the same binocular reconstruction with superimposed symbols denoting defects with a sensitivity of less than 10 dB; equivalent to threshold measured in the EVFT (the blue circle indicates the 20° field). Clearly this patient’s corresponding monocular visual field damage gives a binocular defect in the upper hemifield of the central field of view.
The purpose of this study is to first determine the agreement between the IVF and the EVFT in classifying a glaucomatous patient’s legal fitness to drive using the new guidelines set by the DVLA. The second aim is to examine the performance of these patients on a separate measure of the visual function required for safe driving. This chosen arbiter is a psychophysical test, specifically designed to examine visual attention important in driving, called the useful field of view (UFOV) test.
METHODS
Patients and data
Patients with a consistent clinical diagnosis of primary open angle glaucoma in both eyes were recruited prospectively from a glaucoma clinic. Of course, these are the patients that should notify the DVLA that they require binocular visual field testing to ascertain if their vision will allow them to drive legally and are, therefore, representative of a large, important target population affected by the standards. However, we did not seek to ascertain whether a subject was a driver or not.
Monocular visual field testing was performed with program 24-2 of the Humphrey field analyser model 750 (Humphrey Instruments, Dublin, CA, USA) with a Goldmann size III white stimulus in clinic conditions using the SITA standard testing strategy. Patients had previously presented with glaucomatous visual field loss in both eyes confirmed using the Statpac2 glaucoma hemifield test.10,11 Patients were not selected if they produced unreliable fields at their clinical visit (that is, unsatisfactory false negative, false positive, and fixation losses adhering to the Humphrey criteria) or were inexperienced in perimetry (at least three previous field tests were required). Corrected visual acuity was required to be 6/9 or better in at least one eye. Monocular patients and patients with significant ocular pathology apart from glaucoma were not recruited. The patients then performed, on the same day, an EVFT and a UFOV test in random order with an adequate rest period in between.
Binocular EVFT
The binocular EVFT examines more than 130° visual field and consists of a grid of 120 test points. Each location is tested once, in a suprathreshold manner with a size III white stimulus at intensity of 10 dB. Missed points are retested, with a second negative response resulting in a recorded defect. In the binocular mode, the stability of fixation is monitored indirectly by observation.
UFOV test
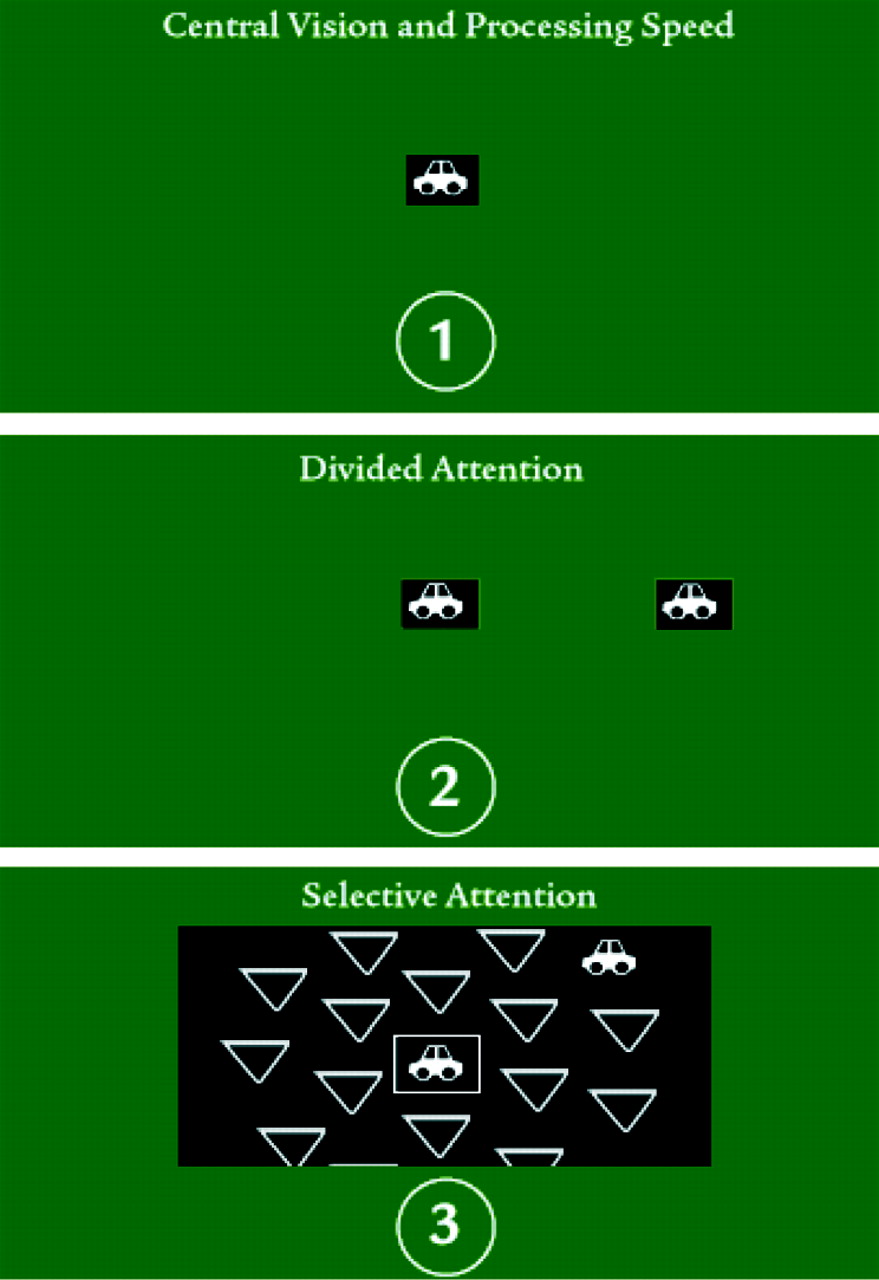
The UFOV test (Visual Awareness, Inc, Chicago, IL, USA 2001), is a computer administered test of visual attention (fig 2). It differs from standard ophthalmological vision tests in that it measures the central processing speed at which visual information is interpreted (a key component in driving ability determination). It also assesses divided attention and peripheral discrimination abilities. The test expresses the patient’s UFOV as a percentage reduction from the ideal. The output for the latest version of the software is an individual risk rating from 0 (lowest risk and best performance) to 5 (highest risk and worst performance).

The UFOV test, described in the schematic diagram here, consists of three parts, each measuring a component of the useful field of view. Target objects are presented on a customised computer monitor, with information displayed progressing from simple to complex. Presentation time varies depending on the participant’s performance pattern. In stage 1 (central vision processing speed) the participant identifies a target object presented in the centre of the computer screen for varying lengths of time. In stage 2 (divided attention) the participant identifies a target object as before but also locates a simultaneously presented target object displayed in the periphery of the screen. Stage 3 (selective attention) is similar to the previous stage, except that the target object displayed in the periphery is embedded in distracters, making the task more difficult. The test is driven by a PC and administered using a touch screen monitor.
The UFOV test has gained some acceptance as a useful tool in assessing the visual attention requirements for driving. In a retrospective study of an older population, a UFOV test correlated highly with crash frequency over the preceding 5 years.12 Moreover, a prospective study demonstrated that a poor performance in this test (equating to risk scores of 4 or 5 on the new software) was associated with a twofold increase in relative risk of crash involvement over the subsequent 3 year period.13 The latter represents one of the few prospective studies undertaken in the “methodologically hazardous” research area of vision and driving accidents.3
The UFOV test was administered to the patients in this study according to the instructions in the UFOV User’s Guide (Visual Awareness, Inc, Chicago, IL, USA, 2001) following the standard verbal guidance and implementing the practice sessions. Viewing conditions and distances were kept as consistent as possible following the guidelines.
Assessing the EVFT and integrated visual fields
The EVFT for each patient was classified as either a “pass” or “fail” in relation to the current group 1 (ordinary licence) visual field standard for driving issued by the DVLA (www.dvla.gov.uk). In short, for retinal conditions such as glaucoma anything less than, or equal to, scattered single missed points or a single cluster of two or three contiguous points in the area within 20° of fixation indicates a “pass.” However, significant and therefore unacceptable central defects are a cluster of four or more contiguous points that lie either wholly or partly within the central 20° area, or loss consisting of both a single cluster of three contiguous missed points up to and including 20° from fixation, and any additional separate missed point(s) within the central 20° area, and this is classed as a “fail.” In addition, a patient was “failed” if there was peripheral constriction of the binocular field as set out in the guidelines.
Integrated visual fields were constructed for each patient using the Progressor software (Institute of Ophthalmology, University College London)8,14,15 with 10 dB sensitivity symbols “equivalent” to a point missed on the EVFT. These integrated visual fields were also classified as either “pass” or “fail” in relation to the same DVLA standards, with some notable corrections. The EVFT only tests 24 points whereas the integrated visual field examines 32 points in the central 20° area; hence, the integrated visual field will be more likely to flag a visual field as a “fail” by chance alone. So, for the integrated visual field we adjusted the definition from above such that six (32/24×4 rounded to a whole figure) or more contiguous points either wholly or partly within the central 20° area, or a single cluster of four (32/24×3) contiguous points with any additional separate points would constitute a fail. While this takes account of the extra points “tested” it does not account for differences in the spatial test pattern between the different measures, and this is where we hypothesised that the EVFT may lack sensitivity in detecting relevant defects.
Once the classification of the patients was complete, all the data (including the UFOV risk scores) were transferred to statistical software where frequency tables were constructed and data analysis carried out.
RESULTS
Sixty five POAG patients, satisfying all the methodological criteria, took part in this prospective study. The mean age of the patients at examination was 69.3 years (range 30–85 years). Patients presented with a wide range of visual field defects in both eyes. The sample mean Humphrey MD (mean deviation) was −11.8 dB (SD 6.0 dB; range −1.4 to −27.5 dB) for the left eye and −11.7 dB (SD 5.3 dB; range −1.4 to −21.9 dB) for the right eye.
The simple frequency table shown in table 1 highlights several interesting results. Firstly, the agreement between the two techniques in classifying a patient as passing or failing the visual field component of fitness to drive is good (57, or 88% exact agreements). The kappa value assesses the agreement beyond what would be expected by chance alone.16 In this case kappa = 0.69 (SE 0.10), and such levels of agreement are described as “substantial.”17
Frequency table comparing the EVFT and the integrated visual field test in quantifying whether a patient would fail or pass the current DVLA criteria
Forty four (68%) patients passed the fitness to drive criteria in both tests. If we assume that our sample is representative of a population of patients that, by legal requirement, need to inform the DVLA that they require further binocular testing because they have bilateral field defects, then it seems about two thirds (95% confidence interval for this percentage, using the binomial distribution, is 55% to 79%) will actually go on to satisfy the requirements of both tests.
No patients in this sample passed the requirement on the integrated visual field test but failed using the current EVFT standard. In fact, we have yet to find a single example of a patient in this category (59 patients were considered in our previous published study looking at the same patient population). This 100% specificity for the integrated visual field test in predicting the EVFT suggests that, in this patient population, this technique would be a useful screener for the DVLA requirements as they stand. The absence of any cases passing with the integrated visual field test but failing with the EVFT is also important for another reason: none of the glaucomatous patients representative of the target population prospectively examined had a peripheral defect without a central visual field defect. This suggests, certainly in patients with glaucoma, that the central field is sufficient to distinguish “pass” from “fail.”
The next interesting feature in table 1 concerns the eight cases where the techniques gave different classifications—that is, a patient failed the criteria using the integrated visual field test but passed when using the binocular EVFT, and would therefore be considered legally fit to drive. Four of these subjects had a UFOV risk rating of 4 or 5; a level of performance in UFOV which has been shown to equate with an increased risk of a car accident involvement.13 (The other four subjects all had a risk rating of 3, with none of the cases in the low or no risk category.) A selection of these eight cases is shown in figures 3–5. Some statistics, summarised in table 2, suggest that the integrated visual field is more sensitive than the EVFT at detecting a visual field required for safe driving when using the UFOV as the arbiter: the mean UFOV risk score for the eight cases where the techniques disagree does not significantly differ from the mean UFOV risk score for that group of patients where both techniques failed the patient (independent t test; p = 0.371). Conversely, the mean UFOV values of these two individual groups do differ significantly from the mean UFOV value recorded for the 44 patients who passed the criteria using both methods (independent t test; p = 0.003 for fail/fail against pass/pass, and p = 0.003 for fail/pass against pass/pass). (Since we were making multiple comparisons, the statistical significance of these individual comparisons were confirmed, using a one way ANOVA with post hoc Tukey’s test for means at the 1% level of significance.) Therefore, these UFOV results indicate that the eight cases are more likely to belong to the population of patients at risk when driving because of their vision, and are less likely to belong to the population not at risk. In turn, this implies that the integrated visual field has better sensitivity in detecting those at risk.
Summary of UFOV scores tabulated by the fail and pass criteria for the integrated visual field and the EVFT

Visual field results from patient A. The top panel shows the EVFT (the superimposed blue line indicates the central 20° area). This patient passes the current DVLA criteria using the EVFT because the central defect is made up on only three missed points. The panel below the EVFT shows the monocular Humphrey grey scale for the same patient indicating the patient has bilateral visual field defects. The next panel shows the integrated visual field with the bottom panel showing the same reconstruction but with superimposed symbols denoting defects with a sensitivity of less than 10 dB; equivalent to threshold measured in the EVFT (the blue circle indicates the 20° field). This patient fails the current DVLA criteria using the integrated visual field because the central defect is made up of six or more contiguous defects at the 10 dB level. This patient had a high UFOV risk score of 4. This risk has been shown to equate with an increased risk of a car accident.14 This may suggest that this patient does not have a field of view compatible with safe driving, though according to the current standards this patient would be deemed fit to drive.

Visual field results from patient B. This composite figure is made up in the same way as figure 3. This patient passes the current DVLA criteria using the EVFT because the central defect is made up on only two missed points but fails the current DVLA criteria using the integrated visual field because the central defect is made up of six or more contiguous defects at the 10 dB level. This patient had a very high UFOV risk score of 5. This risk has been shown to equate with an increased risk of a car accident.14 This may suggest that this patient does not have a field of view compatible with safe driving, though according to the current EVFT standards this patient would be deemed fit to drive.

Visual field results from patient C. This composite figure is made up in the same way as figures 3 and 4. This patient passes the current DVLA criteria using the EVFT because the central defect has only one missed point but fails the current DVLA criteria using the integrated visual field because the central defect is made up of six or more contiguous defects at the 10 dB level. This patient had a moderate UFOV risk score of 3, so on this basis visual function in this patient is equivocal with regard to their fitness to drive. However, this example is included because this shows a patient with obvious, severe defects but this patient has an almost “clear” EVFT. On close inspection, the bulk of the large binocular defect (clearly exposed by the integrated visual field) probably falls into “spaces” that are not tested in the upper hemifield of the EVFT test pattern.
DISCUSSION
It is not surprising that the integrated visual field and the EVFT had substantial agreement about whether patients were in the “pass” or “fail” categories: previous work has shown that the integrated visual field is a good predictor of the binocular field.8,9 This finding could equate to a massive saving in resources since the integrated visual fields could be rapidly and easily constructed during a routine visit.
This study also suggests that around two thirds (and almost certainly more than half) of glaucoma patients who are subjected to the legal requirement of further visual field testing because they have bilateral defects will actually go on to pass that extra test, and therefore be fit to drive. This testing must currently represent a burden on resources for the DVLA, the patient and the centre where the extra testing is done. The 100% specificity for the integrated visual field in predicting the EVFT suggests that, in this patient population, this technique would be a very useful screener for the current DVLA requirements; perhaps a patient with glaucoma would only require the burden of further testing if they failed the criteria using the integrated visual field test. However, this finding depends on our sample being representative of a population of patients that, by legal requirement, need to inform the DVLA that they require further binocular testing. It is possible that patients who had already had their licences revoked, or were worried about this, declined to take part in the study. Still, this trend may have been offset or reversed by those patients with a range of visual field loss who did not drive and were included in the study.
The results from this study indicate that when using the UFOV test as a surrogate measure of the visual attention capacity needed for safe driving, the integrated visual field test has better sensitivity in predicting patients at risk than the EVFT. The cases with a high UFOV risk that pass the current standards using the EVFT but fail when using the integrated visual field test are particularly informative: it seems the spatial configuration of the EVFT pattern prevents it from revealing the type of central binocular defects that exist on detailed monocular testing. Moreover, a recent retrospective study of integrated visual fields constructed on more than 2500 glaucomatous patients has shown that a number are likely to have isolated binocular scotomas adjacent to fixation that would be missed by the EVFT and measures of visual acuity.18 It may be that these dense but localised central defects, missed by the EVFT, have a real bearing on the visual function needed for driving, but real proof of this is beyond this current study.
Our results may be generalised only to those glaucoma patients who are currently obliged to inform the DVLA of their condition and have visual acuity sufficient for a group 1 (motor car) licence. However, this group of patients forms an important subset of those applying to the DVLA for a decision on vision related legal fitness to drive. The high specificity of the integrated visual field test may reflect the inclusion criteria (that is, the exclusion of patients with other pathologies which may only involve the peripheral visual field).
The UFOV test has some merits as a surrogate measure of the visual attention needed for safe driving since it is the only psychophysical test which has been prospectively evaluated in terms of association with motor vehicle accidents.13 Recently, an extensive study on licensed drivers on closed road driving circuits19 demonstrated that the UFOV test, when added to a battery of other vision tests, significantly improves prediction of poor driving performance. Despite its merits as a surrogate measure for the visual function needed for safe driving, the UFOV test is expensive (a special computer touch screen is ideally required) and is considered to be impractical for widespread use19; this would possibly preclude it from being used as a standard.
The use of the integrated visual field test as a screening tool for the current DVLA requirements appears to be in conflict with the 2nd European Council Directive for a width of field of at least 120°. However, in this group of glaucomatous patients, binocular peripheral visual field defects were always accompanied by a central binocular defect as estimated by the integrated visual field. Previous work on the existence of isolated peripheral defects in glaucoma has been ambiguous; while some report this is a rare occurrence others report it as being more common but the reported incidence seems inversely proportional to the quality of the examination used.20–22 In other words, the more detailed the examination of the central field, the less often peripheral defects are found. In conclusion, future work in this area should be directed towards establishing the relation between visual field status, both peripheral and central, with actual driving performance. Such work is difficult, because accident rates are low in the general population, and closed road tracks and driving simulators are difficult to utilise.23,24 A longitudinal study relating visual loss to risk of motor vehicle accident (adjusted for driving exposure and cognitive and attentive skills) would help clarify the roles of the current standard (EVFT) and IVF in the assessment of visual fitness to drive, and would provide an evidence base for their application and for the pass/fail criteria used.
Acknowledgments
This research was funded by the UK Department for Transport. We would like to thank Dr Lily Read of the UK Department of Transport for her helpful comments on this manuscript.
REFERENCES
Footnotes
-
Disclosure of interest: ACV, FWF, and RAH are developers of the Progressor software used in this study. DPC has no commercial interest.