Article Text

Abstract
BACKGROUND Scanning laser Doppler flowmetry (SLDF) enables the measurement of the laser Doppler frequency shift in retinal tissue. This process allows the quantification of retinal and optic nerve head perfusion in an area of 2.7 mm × 0.7 mm within 2 seconds and with a spatial resolution of 10 μm × 10 μm. Owing to the local heterogeneity of the retinal microcirculation itself and to heart associated pulsation the capillary retinal blood flow depends on location and time. Because of technical limitations measurements of flow are only valid in retinal points with adequate brightness and focus, and away from big vessels. To include the heart beat associated pulsation and the spatial heterogeneity of retinal blood flow into the evaluation of blood flow an algorithm was developed examining automatically the whole SLDF perfusion image.
AIM To report intraobserver reliability and interobserver reliability of a new method for analysing automatically full field perfusion images.
METHOD The base of blood flow calculation by the automatic full field perfusion image analyser (AFFPIA) was 16 384 intensity time curves of all pixels of the whole perfusion image gained by the SLDF. AFFPIA calculates the Doppler frequency shift and the haemodynamic variables flow, volume, and velocity of each pixel. The resulting perfusion image was processed with respect to (1) underexposed and overexposed pixels, (2) saccades, and (3) the retinal vessel tree. The rim area and the saccades were marked interactively by the operator. The capillaries and vessels of the retinal vessel tree were identified automatically by pattern analysis. Retinal vessels with a diameter greater than 30 μm, underexposed or overexposed areas, and saccades were excluded automatically. Based on the whole perfusion image total mean flow, total mean volume, total mean velocity, standard deviation, cumulative distribution curve of flow, and the capillary pulsation index were calculated automatically. Heart beat associated pulsation of capillary blood flow was estimated by plotting the mean capillary flow of each horizontal line against time. Intraobserver reliability was estimated by measuring 10 eyes of 10 subjects on five different days by one observer. Interobserver reliability of AFFPIA was evaluated by analysing 10 perfusion maps by five different operators. To find a baseline of retinal blood flow, perfusion maps of 67 eyes of normal subjects with a mean age of 40.4 (SD 15) years were evaluated by AFFPIA.
RESULTS The coefficient of reliability of the intraobserver reproducibility of flow was 0.74. The coefficient of reliability of the interobserver reproducibility was 0.95. The juxtapapillary retinal capillary flow was temporally 484 (SD 125), nasally 450 (117); the rim area capillary flow was 443 (110). The mean capillary pulsation index of retinal flow was 0.56 (0.14).
CONCLUSION Retinal blood flow evaluation by the AFFPIA increases significantly the interobserver reliability compared with conventional evaluation of 100 μm × 100 μm areas in SLDF images with the original Heidelberg retina flowmeter software. The intraobserver reliability of AFFPIA was in the same range as conventional evaluation.
- retinal blood flow
- optic nerve head blood flow
- scanning laser Doppler flowmetry
Statistics from Altmetric.com
There is clinical need to quantitate non-invasively retinal or optic nerve head blood flow. Many ocular diseases are associated with decreased retinal or optic nerve head blood flow. By scanning laser Doppler flowmetry (Heidelberg retina flowmeter, HRF) it is possible to generate high resolution perfusion maps of the retinal and optic nerve head circulation. The principles of function of scanning laser Doppler flowmetry (SLDF) are described in detail elsewhere.1-4Briefly, SLDF measures the Doppler frequency shift in each of 16 000 retinal points with a size of 10 μm × 10 μm in a retinal area of 2.7 mm × 0.7 mm within 2 seconds. This enables the quantification of the perfusion of the retina and the optic nerve head in any area of the scanned sector. Owing to the spatial heterogeneity of the retinal microcirculation itself and heart associated pulsation the retinal perfusion is not constant within the perfusion map. Thus, the flow rate within the measuring window of 100 μm × 100 μm depends on its position and varies with location and time. As SLDF scans a total area of 1.89 mm2 with a high spatial resolution within 2 seconds the perfusion of different areas varies depending on the retinal site and pulse phase. This leads to a high interobserver variability of blood flow readings using conventional HRF software. To reduce the influence of both heart beat associated pulsation and the spatial heterogeneity an algorithm was developed evaluating automatically whole perfusion images gained by SLDF.
The purpose of this study was to describe a new method of automatic analysis of full field perfusion images, and to report intraobserver reliability of measurement and interobserver reliability of analysis of perfusion maps by a new automatic method for analysing full field perfusion images.
Patients and methods
PRINCIPLE OF FUNCTION OF THE AUTOMATIC FULL FIELD PERFUSION IMAGE ANALYSER
Using the automatic full field perfusion image analyser (AFFPIA) 16 384 intensity time curves of the whole scanning sector gained by the SLDF were automatically processed. The intensity time curves of the pixels of the 64 × 256 matrix were the basis for the analysis. The examined retinal area has a size of 2.7 mm × 0.7 mm. It has a resolution of 256 points × 64 lines. One sample is taken from each point of the line. Each line is scanned 128 times with a repetition rate of 4000 Hz, leading to an intensity matrix of 256 points × 64 lines × 128 times. Thus, the backscattered intensities of each scanned point are obtained as a function of the time (fluctuation time curve). The collected intensity data of each retinal point of measurement are then analysed by a discrete fast Fourier transformation, thus calculating the frequency shift for each point of measurement by which the blood flow, ω, of each pixel can be computed. Besides the Doppler effect noise contributes to the measured intensity variations. Factor “C” is defined according to the calculation of the noise power. Noise is mainly based on photon statistics. Factor C is calculated for each image. Further detailed information about the technique can be found elsewhere in the literature.4 From the calculated data a two dimensional colour map of the retinal/optic nerve head perfusion is created. The brightness of each point is encoded by the extent of blood flow—that is, to the Doppler frequency shift. The variable “flow” is computed for each pixel. Flow (ω) is calculated by equation ()
AFFPIA calculated the Doppler frequency shift, and the haemodynamic factor, flow, of each pixel according to the theory of Bonner and Nossal.5 For valid estimation of retinal blood flow some assumptions must be made—adequate brightness, no artificial movement, Doppler shift lower 2000 Hz. To meet these requirements the resulting perfusion image was processed with respect to (1) underexposed and overexposed pixels, (2) saccades, and (3) the retinal vessel tree. In the first step of the statistical analysis by AFFPIA the operator marked saccades and the location of the rim area. In the second step the capillaries and vessels of the retinal vessel tree were identified automatically by a vessel detection algorithm based on the intensity and the perfusion image. After these processes retinal vessels with a diameter of more than 30 μm, underexposed or overexposed pixels, and saccades were automatically excluded from the perfusion image. In the third step local inhomogeneities of the perfusion map were softened by a moving average procedure performed with a size of 5 × 5 pixels. This led to a valid perfusion map excluding vessels with a diameter greater than 30 μm, without lines with saccades, and without pixels of inadequate reflectivity. Figure 1 shows the steps of the imaging processing. Based on this processed perfusion map statistical analysis of blood flow was automatically performed of the temporal, nasal, and rim area using all flow values. AFFPIA calculated and presented automatically the mean flow of the temporal, nasal, and rim area with standard deviation, a histogram of all flow values of these areas, a cumulative frequency distribution curve of all flow values of these areas, and the capillary pulsation index of these areas (Fig 2). The heart beat associated pulsation of capillary blood flow was evaluated by plotting the mean capillary flow of each horizontal line against time (Fig 3). The pulsation index P was calculated by equation ():

Graphic representation of the image processing procedure of the automatic full field perfusion image analyser (AFFPIA).
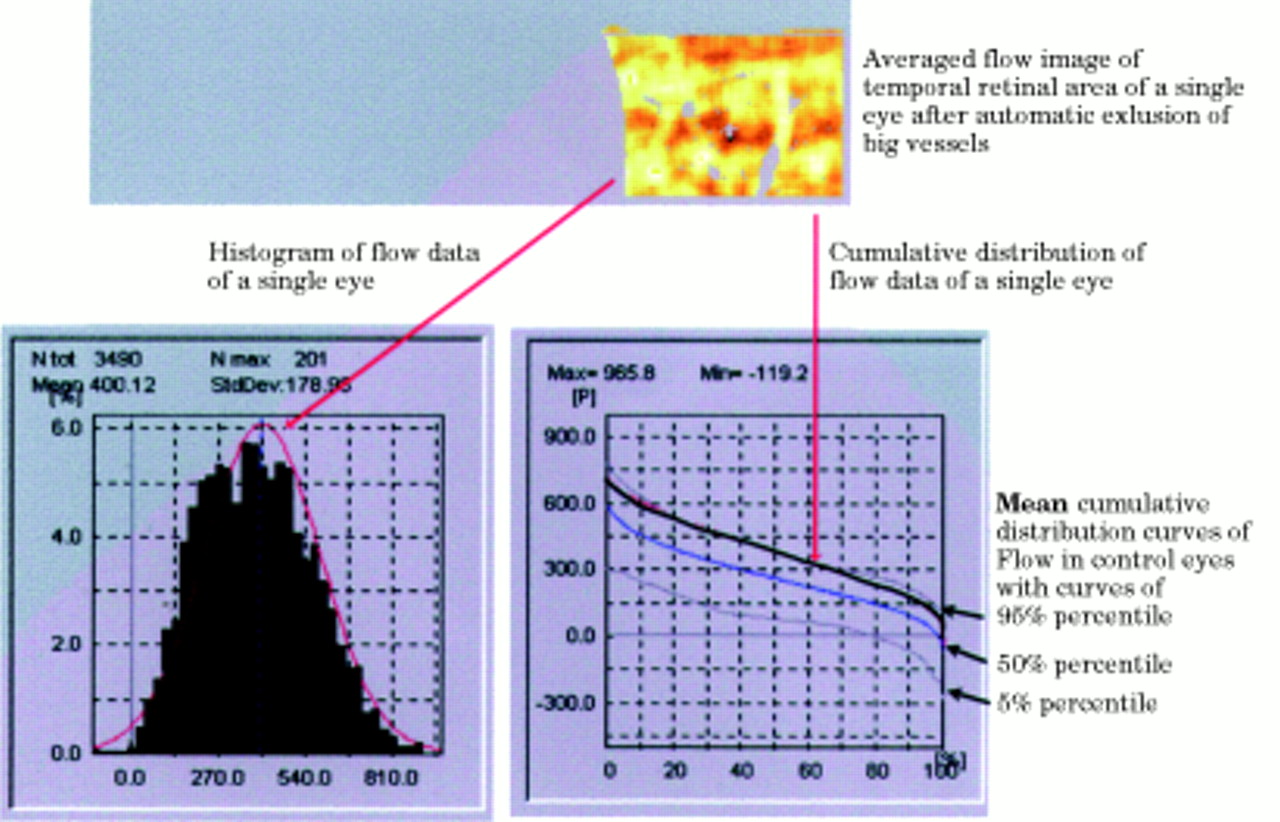
Automatic statistical analysis and presentation of blood flow of the temporal area, with the histogram of all flow values, and the cumulative frequency distribution curve of flow of a single eye in comparison with the mean cumulative frequency distribution curve of the control group with the 5% percentile curve and the 95% percentile curve. Note that the cumulative frequency distribution curve of the examined eye lies in the high 90s. The 5% percentile curve and the 95% percentile curve define the normal range of flow.

Graphic presentation of the heart beat associated pulsation of capillary blood flow by plotting the average flow of each horizontal line against time. The pulsation index, P, was calculated by [P=systolic flow − diastolic flow)/systolic flow].
Steps of calculation of the automatic full field perfusion image analyser (Source: matrix of intensity–time curves (64×256), gained by scanning laser doppler flowmetry (HRF))
EVALUATION OF RELIABILITY
Intraobserver reliability of flow measured by the AFFPIA was estimated by measuring 10 eyes of 10 people on 5 different days by one observer. Interobserver reliability was evaluated by comparing the results of five different operators analysing 10 different perfusion maps.
The coefficient of reliability was calculated by equations (3)–(5). The reliability coefficient, r1, was calculated by the estimation of the variances of the biological component and the error component. The measured value is a combination of the true mean value, the biological variability component, and the error component (equation ()). The variances of the two components are defined in equation (). The error component was differentiated from the biological component by the variance component analysis calculated by var compprocedure from sas stat.6
The reliability coefficient r1 is defined by the following equation:
FLOW IN NORMAL SUBJECTS
The mean flows of the temporal, nasal, and rim area of 67 eyes of 67 normal subjects with a mean age of 40.4 (SD 15) years were evaluated by the AFFPIA.

Figures 7–10 Images of the posterior pole of four eyes gained by reflectivity measurement (A), by Doppler measurement (B), after automatic vessel detection of capillaries and vessels (C), and after automatic vessel detection of vessels greater than 30 μm (D).
VESSEL DETECTION ALGORITHM
The effectiveness of the automatic vessel detection algorithm of AFFPIA examples was evaluated by visual comparison of images gained by reflectivity measurement (A), by Doppler measurement (B), by automatic vessel detection of capillaries and vessels (C), and by automatic vessel detection of vessels greater than 30 μm (D).
Results
RELIABILITY
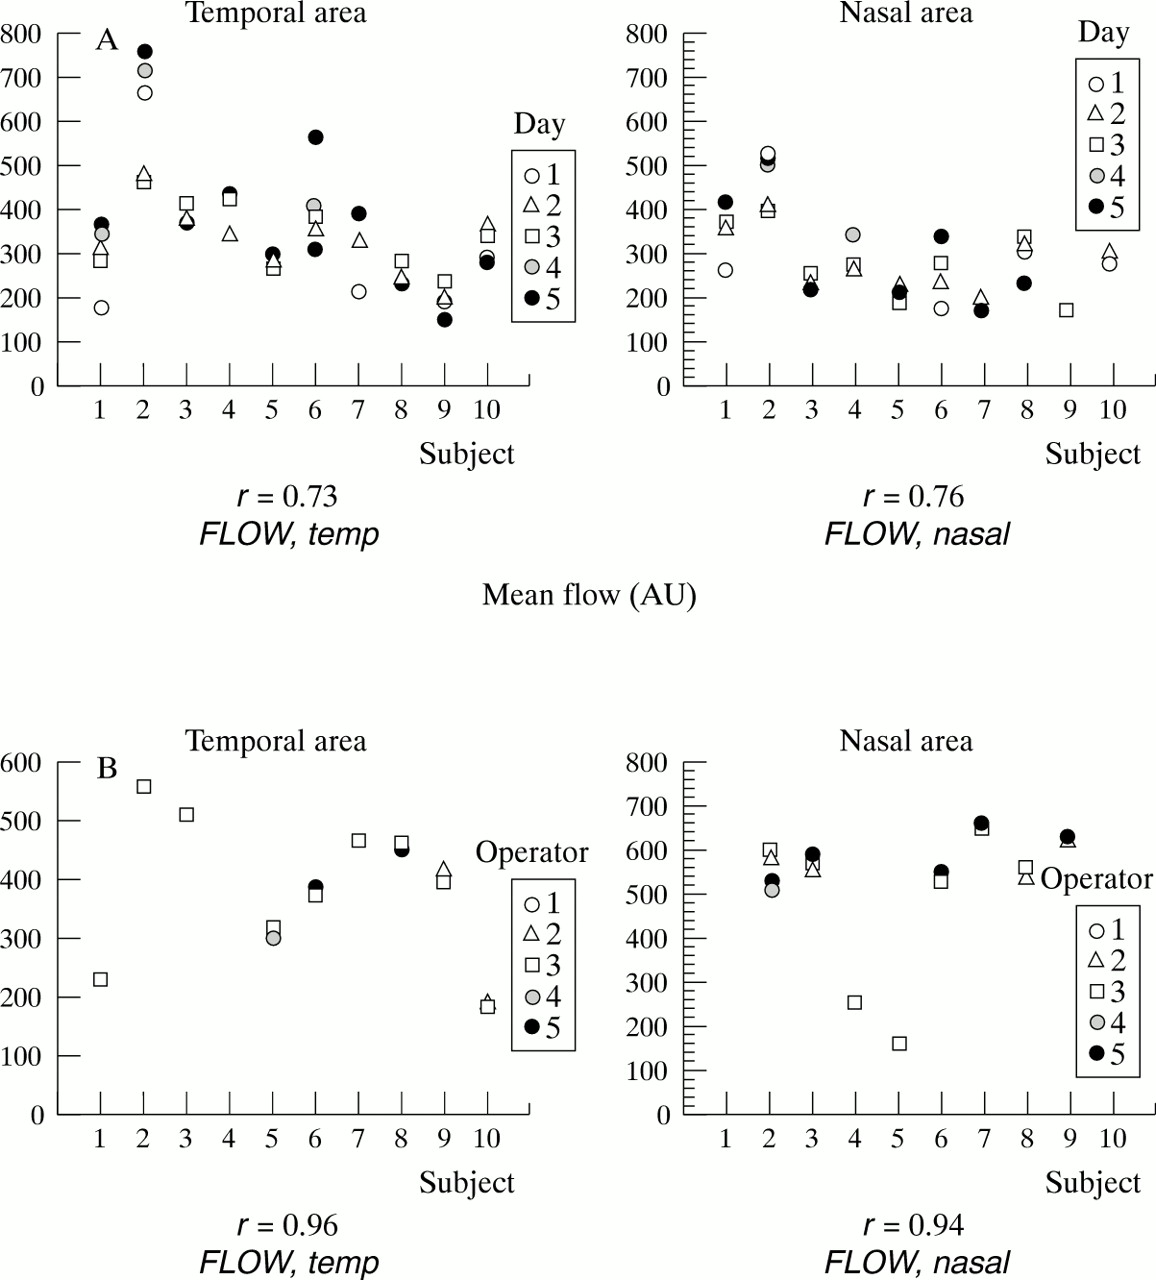
The intraobserver reliability was 0.78 for flow (Fig 4A), the interobserver reliability was 0.95 for flow (Fig 4B).

(A) Intraobserver reliability: repeated measurements of mean flow of 10 subjects on 5 different days measured by one operator. (B) Interobserver reliability: repeated calculations of mean flow of perfusion maps of 10 separate subjects performed by five operators using AFFPIA.
PERFUSION DATA
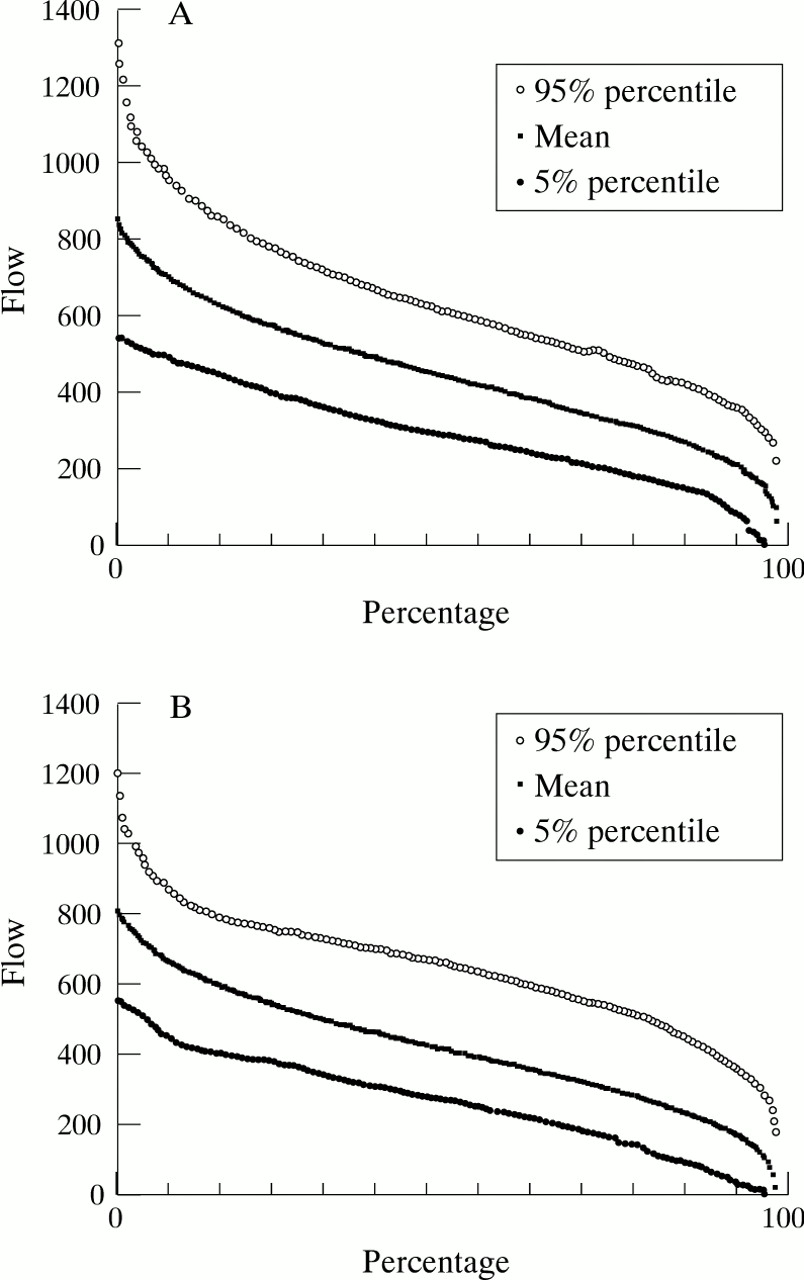
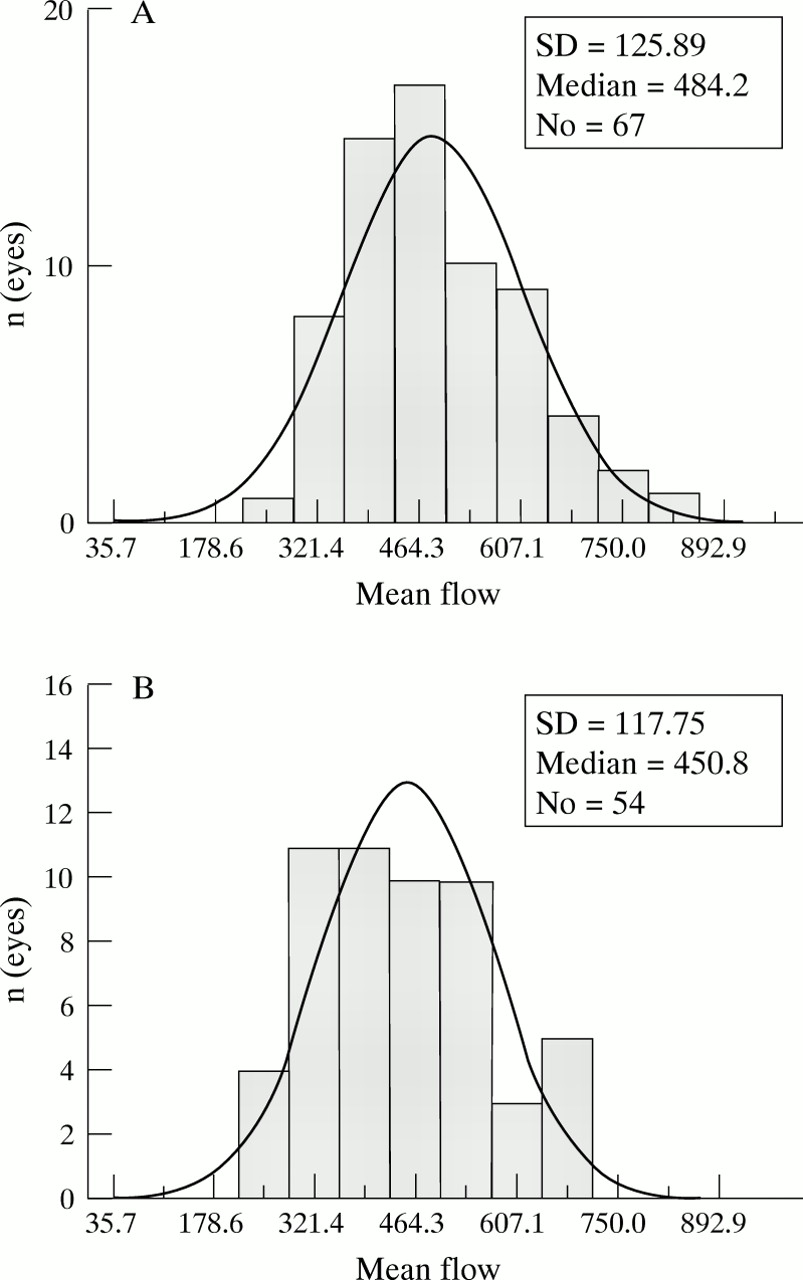
The juxtapapillary retinal capillary mean flow (SD) was temporally 484 (125), nasally 450 (117); the rim area capillary flow was 443 (110). In Figure 5 are depicted the histograms of mean flow values of normal subjects of the nasal (A) (n=54) and the temporal (B) areas (n=67). The corresponding cumulative frequency distribution curves of mean flow values of normal subjects of the nasal and temporal area are shown in Figure 6. The flow of the juxtapapillary temporal (B) area was significantly higher (p<0.01) than the nasal (A) area flow.

(A) Histogram of mean flow values of the nasal area of 54 normal subjects. (B) Histogram of mean flow values of the temporal area of 67 normal subjects.
(A) The cumulative frequency distribution of flow values of all valid pixels of the nasal area of 54 normal eyes with the 5% percentile and 95% percentile curve. 90% of all flow values of the control group are situated within this range. (B) The cumulative frequency distribution of flow values of all valid pixels of the temporal area of 67 normal eyes with the 5% percentile and 95% percentile curve. 90% of all flow data of the control group are situated within this range
VESSEL DETECTION ALGORITHM
Visual comparison of images gained by reflectivity measurement (A), by Doppler measurement (B), by automatic vessel detection of capillaries and vessels (C), and by automatic vessel detection of vessels greater than 30 μm (D) showed a high effectiveness of the automatic vessel detection algorithm. In Figures 7–10 images of four eyes were depicted showing the effectiveness of the automatic vessel detection algorithm of the AFFPIA.
CAPILLARY PULSATION
The capillary pulsation of the retinal flow was in average 0.56 (0.14).
Discussion
LIMITATIONS OF FLOW MEASUREMENTS BY SLDF
Because of technical limitations of SLDF (sampling frequency 4000 Hz, measuring time 2 seconds) blood flow quantification by SLDF is only correct in retinal areas without big vessels, without saccades, and in areas with adequate reflectivity. The AFFPIA improves blood flow measurement by SLDF by including automatically heart beat associated pulsation and the spatial heterogeneity of flow and by excluding automatically pixels with incorrect brightness (underexposed, overexposed pixels), pixels of the excavation area, pixels of artificial movements (saccades), and pixels of vessels with a diameter greater than 30 μm.
RELIABILITY OF AFFPIA
Conventional analyses of SLDF images by the HRF software means evaluating the mean flow of a measuring window of 100 μm × 100 μm, whose position is selected by the operator. Several groups evaluated the reliability of conventional analysis of the SLDF perfusion image by measuring several times the same area of the retina of a subject using 100 μm × 100 μm measuring windows. They reported an intraobserver reliability (intraclass coefficient) of about 0.7–0.8 4.7-9 AFFPIA showed an intraobserver reliability of 0.78 although non-identical areas of the retina were measured. Thus, the reliability of AFFPIA was in the same range as the reliability of conventional analysis by the HRF software. This suggests that the new method for analysing SLDF images showed a greater robustness of measurement of flow. The interobserver reliability of the AFFPIA was very high (0.95) owing to the largely automatic procedure. Only marking of the rim area and the saccades depends on the operator.
JUXTAPAPILLARY FLOW IN NORMAL SUBJECTS
By the automatic evaluation of central perfusion maps by AFFPIA the capillary flow was slightly higher (+7%) in the temporal juxtapapillary area than in the nasal juxtapapillary area. This may be caused by the increased retinal thickness in the temporal area, which is associated with a greater number of capillaries per retinal area.
CAPILLARY PULSATION OF RETINAL PERFUSION
As SLDF sequentially measures the Doppler shift of each pixel of the image processing one line after another (0.031 seconds/line) the perfusion image contains lines of different pulse phases. The scanning procedure for all 64 lines takes 2 seconds. Thus, one or two heart beat associated pulsations of the capillary blood flow were regularly visible. For example, in lines 1–5 of the perfusion image were depicted the flow in the systolic phase and in lines 6–18 the flow in the diastolic phase. AFFPIA evaluated the heart beat associated pulsation of capillary blood flow by plotting the mean capillary flow of each horizontal line against time (Fig 3). Measurement of the capillary blood flow pulsation by AFFPIA assumes that (1) changes of the mean capillary blood flow of one line in the perfusion image depend mainly on the phase of the heart beat associated pulsation, and that (2) capillary retinal blood flow is homogeneous without local extremes in the perfusion image. On average, we found a pulsation index of about 0.56. Riva and coworkers10measured the capillary pulsation of blood flow in the optic nerve head by single spot laser Doppler flowmeter. They found a capillary pulsation of 0.47 (0.08), which is in the same range as our findings.
CUMULATIVE FREQUENCY DISTRIBUTION CURVES OF FLOW VALUES OF WHOLE PERFUSION IMAGES
Each perfusion image contains flow data of 16 384 pixels (64 lines × 256 pixels). The ranking of flow data of valid pixels of one single eye results in a cumulative frequency distribution curve. Presenting flow values of all pixels of the nasal, temporal, and rim area as cumulative frequency distribution curves improves the evaluation of the retinal perfusion in single eyes. The comparison of the cumulative frequency distribution curve of flow of a single eye with the mean cumulative frequency distribution curve of flow of a control group allows the immediate visual evaluation. The cumulative frequency distribution curve of flow of a single eye can be evaluated with respect to its position on the 5% and the 95% percentile curves of the control group. Normal retinal blood flow is assumed if the cumulative frequency distribution curve of the examined eye lies inside the 5% and 95% percentile curves. The range between the 5% and the 95% percentile curves contains 90% of all cumulative frequency distribution curves of the control group. The cumulative frequency distribution curve of a single eye can be evaluated with respect to “inside or outside” the normal range and a “diffuse” or “specific” decrease in high or low flow rates. A cumulative flow curve of a single eye lying outside the normal range is significantly abnormal with a level of significance of p <0.05. This type of evaluation is similar to the evaluation of “Bebie curves” of the Octopus visual field. A “diffuse” decrease of retinal flow is characterised by a parallel decrease of the flow curve, which means that the perfusion is decreased in all types of capillaries and vessels. A “specific” decrease of flow in small or thick vessels leads to a “localised” depression of the cumulative frequency distribution curve in low or high flow rates.
VESSEL DETECTION ALGORITHM
The effectiveness of the automatic vessel detection algorithm is visible by comparison of the reflectivity images, flow images, and processed images. Because the automatic procedure excludes vessels greater than 30 μm only retinal areas away from big vessels were included in the evaluation of retinal blood flow (Figs 7–10).
In conclusion, the AFFPIA is a new approach to analysing perfusion images coded by the Doppler shift. AFFPIA reduces significantly the influence of the operator who is evaluating automatically all valid flow data gained by SLDF. Some technical limitations of blood flow measurement by SLDF (unstable fixation of the patient, defocused images, unclear media) were not overcome by the new method. To obtain reliable measurements of flow by SLDF some minimal requirements have to be fulfilled—focused image with visible capillaries, well fixating patient, and a proper range of reflectivity.
Acknowledgments
Supported by Deutsche Forschungsgemeinschaft Mi320/3–2, DFG-Sonderforschungsbereich 537 (Glaukome, einschliesslich PEX)