Article Text

Abstract
AIMS To simulate the central binocular visual field using results from merged left and right monocular Humphrey fields. To assess the agreement between the simulation and the binocular Humphrey Esterman visual field test (EVFT).
METHOD 59 consecutive patients with bilateral glaucoma each recorded Humphrey 24-2 fields for both eyes and binocular EVFT on the same visit. EVFT results were used to identify patients exhibiting at least one defect (<10 dB) within the central 20° of the binocular field. This criterion is relevant to a patient’s legal fitness to drive in the UK. Individual sensitivity values from monocular fields are merged to generate a simulated central binocular field. Results are displayed as a grey scale and as symbols representing defects at the <10 dB level. Agreement between patients failing the criterion using the simulation and the EVFT was evaluated.
RESULTS Substantial agreement was observed between the methods in classifying patients with at least one defect (<10 dB) within the central binocular field (kappa 0.81; SE 0.09). Patients failing this criterion using the EVFT results were identified by the binocular simulation with high levels of sensitivity (100%) and specificity (86%).
CONCLUSIONS Excellent agreement exists between the simulated binocular results and EVFT in classifying glaucomatous patients with central binocular defects. A rapid estimate of a patient’s central binocular field and visual functional capacity can be ascertained without extra perimetric examination.
- glaucoma
- binocular visual fields
- Esterman visual field test
Statistics from Altmetric.com
Automated perimetry currently provides the standard assessment of a patient’s visual field. Monocular visual fields play an essential role in the clinical detection and management of patients with glaucoma. Binocular visual field testing has little value clinically but it ultimately yields the closest approximation of a patient’s “real” field of view and has been advocated to be more relevant in terms of functional ability than monocular testing.1-3For this reason binocular visual field testing is appropriate for evaluating a patient’s level of visual disability in a medicosocial setting. Currently, binocular field testing is also particularly relevant for testing whether a patient has a field of vision that complies with the requirements for a legal fitness to drive.
Binocular visual field testing programs are readily available in various automated perimeters. However, additional binocular examination is not routinely administered in the clinical setting where perimetric resources are normally directed or “consumed” by monocular testing. Binocular visual field testing in glaucoma normally only becomes necessary when a patient presents with bilateral defects commonly seen in advanced stages of the disease and assessment of visual disability is required.
This paper describes a method of simulating a binocular visual field from the results of Humphrey monocular fields. This technique requires no extra perimetric testing and allows for a quick and useful estimate of a patient’s central functional field. Purpose written computer software merges individual sensitivity values from left and right fields to generate a map of the central binocular visual field. Results are displayed as an easily interpretable grey scale with significant defects denoted by superimposed symbols. The purpose of the study was to assess the agreement between the results from this simulation and an automated test of the binocular field available on the Humphrey field analyser (Esterman visual field test, EVFT). Specifically, the study investigated the concordance between the techniques in classifying glaucomatous patients who exhibit defects with sensitivity values below 10 dB in the central binocular field. These type of field defects have a bearing on the Royal College of Ophthalmologists’ recommendation for the legal fitness to drive in the UK.4
Methods
SUBJECTS AND DATA
Visual field data were acquired from 59 consecutive patients attending the glaucoma clinic at Moorfields Eye Hospital. All had previously presented with glaucomatous visual field loss in both eyes confirmed using the statpac 2 glaucoma hemifield test (GHT).5 6 In all cases GHT was outside normal limits. In addition, all patients had optic disc appearance in both eyes consistent with a clinical diagnosis of primary open angle glaucoma. All patients had no other ocular pathology, specifically cataract or macular degeneration, and all had previous experience of automated perimetry. Visual fields were recorded for both eyes with program 24-2 of the Humphrey field analyser (Humphrey Instruments, San Leandro, CA, USA) with a size III white stimulus in standard conditions using the full threshold strategy. Patients then underwent examination with the automated binocular EVFT which is available on the Humphrey field analyser. This test is recognised by the International Perimetric Society and is recommended by the American Medical Association in its guide to visual impairment.3 In each case all field testing was completed during one visit. The EVFT was administered after the 24-2 examinations. The study was conducted during a routine hospital clinic and this precluded using a random sequence of field examinations but rest periods between tests were implemented throughout.
The binocular EVFT examines more than 130° field and consists of a grid of 120 test points (Fig 1). The aim of this design is to produce a relative scale of defects based on function, with greater weighting in areas considered more useful to the patient.1 Each location is tested once with a size III white stimulus at an intensity of 10 dB. Missed points are retested, with a second negative response resulting in a recorded defect. False positive and false negative responses are assessed in a similar fashion to the monocular programs. In the binocular mode the video eye monitor is aligned to the bridge of the nose, enabling central head positioning. Stability of fixation is monitored indirectly by observation since the automatic checking of fixation via the blind spot cannot be employed.

Esterman visual field test output from the Humphrey visual field analyser for one of the sample patients. A circle representing the central area 20° from fixation has been superimposed. There are 24 test locations within the central area. This patient has five locations with sensitivity values below 10 dB within this area and is therefore classified as exhibiting “At least one defect (<10 dB)” using the EVFT analysis.
The visual field data were transferred to a personal computer and further analysed with purpose written software using s-plus3.2 for Windows (StatSci Europe, MathSoft Inc, Oxford) andprogressor for Windows (Institute of Ophthalmology, London). Where a double determination of sensitivity had been undertaken at a given test location in the 24-2 program, the value of the sensitivity was taken as the mean of the two determinations.
The rationale for studying the central 20° of the binocular visual field is related to the recommendation for the standard of the minimum field of vision for safe driving in the UK. The Royal College of Ophthalmologists in its advice to the Driving and Vehicle Licensing Authority (DVLA) of the UK has suggested:
“.... a field of vision of at least 120° on the horizontal measured by the Goldmann Perimeter using the III4e settings (or equivalent perimetry). In addition there should be no significant [field] defect in the binocular field which encroaches within 20° of fixation either above or below the [horizontal] meridian... . Isolated scotomata represented in the binocular field near to the central fixation point may also be inconsistent with safe driving.”4
This standard is not equipment specific. The EVFT is one of the recommended “equivalent” examinations and is routinely used in cases of equivocal field loss. The advice to the DVLA does not, however, specify the number or configuration of EVFT defects that constitute a “significant” field defect in terms of legal fitness to drive.
This study is concerned only with recorded defects within the central 20° of fixation. Twenty four of the EVFT locations fall within this area as highlighted in Figure 1. The purpose of this study was to identify patients who exhibited at least one defect (<10 dB) within the central 20°.
Therefore, patients were classified as having “At least one defect (<10 dB)” or “No defects (<10 dB)” using the EVFT.
CENTRAL BINOCULAR FIELD SIMULATION
Each location in the right monocular field has a corresponding point in the left monocular field in binocular viewing. The maximum sensitivity from each of the two overlapping locations was determined to give an estimate of sensitivity at that point, as if the subject was viewing in the binocular mode. These merged results can be displayed as a grid of sensitivity values or a grey scale. Individual locations with sensitivity values below 10 dB can be flagged by symbols. These can be considered equivalent to EVFT type defects. This process is described in the schematic diagram shown in Figure 2. Thirty two of the simulation locations fall within the central 20° of fixation. The EVFT test pattern examines fewer locations (24 points) in the central 20°. Therefore, eight locations with no direct equivalent in the EVFT were excluded from the binocular simulation analysis. Four of these locations are sited in the superior hemifield and the remaining four are the closest to fixation (Humphrey coordinates plus or minus 3°). Patients were classified as having “At least one defect (<10 dB)” or “No defects (<10 dB)” using the binocular simulation.

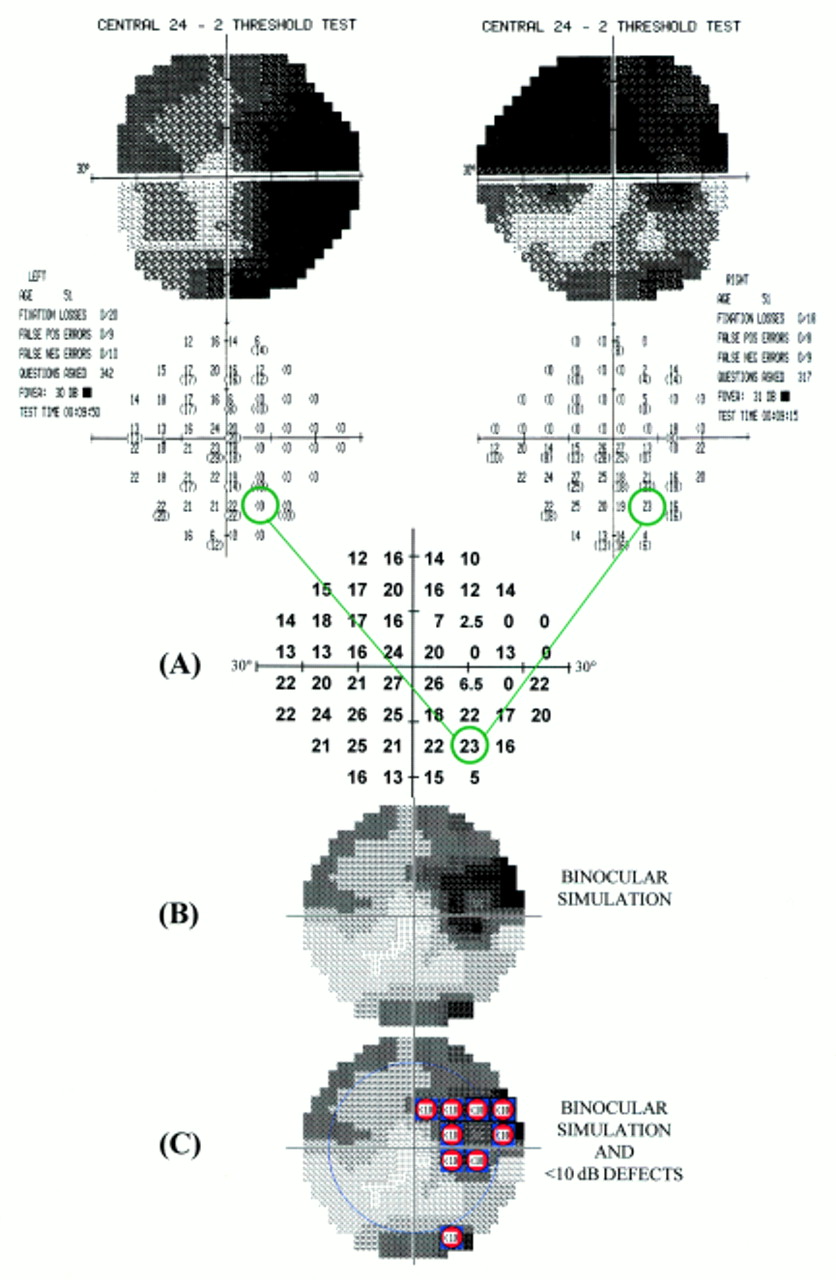
A schematic diagram describing the binocular simulation technique using data from the same patient shown in Figure1. Humphrey 24-2 fields from the left and right eyes are merged point by point. The maximum sensitivity from each of the two corresponding points is determined to give an estimate of sensitivity at that point as if the subject was viewing in the binocular mode (A). The resultant simulated central binocular field can be displayed as Humphrey type grey scale (B). The central area (20° from fixation) can be highlighted and individual locations with sensitivity values below 10 dB are denoted by symbols (C). Note the similarity of the locations exhibiting defects (<10 dB) compared with the EVFT output in Figure1.
All patients were classified in categories of the defect criterion for both the EVFT and binocular simulation analysis. Level of agreement between the two methods was evaluated using a kappa coefficient which gives an indication of agreement beyond chance.7
Results
The mean age of the patients at examination was 65.5 years (range 30–85 years). Patients presented with a wide range of visual field defects in both eyes. The sample mean Humphrey MD (mean deviation) was −11.5 (SD 8.2) dB for the right eye and −10.6 (7.7) dB for the left eye. The sample mean Humphrey CPSD (corrected pattern standard deviation) was 7.1 (3.7) dB for the right eye and 7.0 (3.8) dB for the left eye.
The adequacy of perimetric performance was assessed using the Humphrey reliability indices.8 A visual field was considered unreliable if 33% or more was recorded for at least one of the false positive (FP), false negative (FN), and fixation loss (FL) indices. These limits have been previously recommended for identifying inadequate perimetric performance.9 10Patients were excluded from further analysis if at least one field examined on the 24-2 test or the EVFT was unreliable (FP and FN are also available on the EVFT). In total, 15 patients were excluded from further analysis because of inadequate perimetric performance in at least one of the tests. (Eleven patients were unreliable on at least one monocular field; two unreliable on EVFT; two unreliable on at least one monocular field and EVFT.)
Results from EVFT and binocular simulation analysis for example patients are shown in Figures 3 and 4. Classification by the EVFT and binocular simulation analysis of the reliable 44 patients as exhibiting “At least one defect (<10 dB)” or “No defects (<10 dB)” in the central field (20° from fixation) is shown in Table 1. The kappa coefficient of agreement was 0.81 (SE 0.09). This value indicates a substantial level of agreement between the two techniques.11 All patients that exhibited “At least one defect (<10 dB)” using the EVFT were correctly identified by the binocular simulation (100% sensitivity). Four of the 29 patients defined as having “No defects (<10 dB)” using the EVFT were classified by the binocular simulation as having a defect (86% specificity).

EVFT output for a sample patient is shown in (A). A circle has been superimposed to denote the central 20°. Results from the binocular simulation implemented by the progressor for Windows software (Institute of Ophthalmology, London) are shown for the same patient in (B). The sensitivity of the left and right 24-2 fields are shown as Humphrey type grey scales. The lower panels show the results from the binocular simulation as Humphrey type grey scale with and without superimposed symbols denoting point by point EVFT type defects (<10 dB). The blue circle on the display indicates the central 20° area. This patient clearly demonstrates “At least one defect (<10 dB)” using the EVFT (A) and similarly “At least one defect (<10 dB)” using the binocular simulation (B).

EVFT output (A) and results from the binocular simulation (B) implemented by the progressor for Windows software (Institute of Ophthalmology, London) are shown for another sample patient. The lower panels show the results from the binocular simulation as Humphrey type grey scale with and without superimposed symbols denoting point by point EVFT type defects (<10 dB). This patient demonstrates “No defects” using the EVFT (A). This patient also demonstrates “No defects” using the binocular simulation (B) despite the presence of areas of visual field damage in each monocular field.
Number of patients classified as having at least one defect or no defects (<10 dB) in the central field by EVFT analysis and binocular simulation
Discussion
This study has illustrated a new method of simulating the central binocular field by merging results from monocular Humphrey fields. Using the higher sensitivity from either eye for each test location has been shown to be superior to other methods in combining monocular results to estimate a binocular field in glaucoma patients.12 Earlier studies, using results from Goldmann perimetry, have considered this concept but concluded that ideally a patient’s functional field capacity should only be accurately assessed via binocular viewing because of what is termed enhancement or sensitivity summation.1 Binocular enhancement occurs in areas where the two monocular fields overlap and has the effect of increasing the Esterman score (percentage of 120 EVFT locations where the stimulus was seen) above that predicted by merging the two monocular fields. Enhancement has been demonstrated in normal subjects.13 However, there is evidence that it occurs less often in patients with advanced glaucoma.2 14 15 The results from our study also suggest that enhancement occurs infrequently in the central field (20° from fixation) of a group of patients with bilateral glaucoma. Significant binocular enhancement would have manifested poor agreement between the simulation and the EVFT in identifying patients with at least one defect (<10 dB). This was not the case since high levels of agreement were observed.
A recent study, comparing Esterman score against mean deviation of monocular fields, reported lower than expected number of EVFT defects in glaucoma patients with bilateral field loss.16Moreover, the automated binocular EVFT has been described by others as “less stringent” and “more forgiving” than other perimetric tests.4 These findings may of course be explained in part by binocular enhancement but other explanatory factors are likely to be more significant. For example, the test strategy employed by the EVFT on the Humphrey field analyser is not optimal. Retesting only a selected sample of test locations where the stimulus was not seen provides a simple evaluation of the binocular field. However, in the presence of the inherent variability in patient response to the light stimulus, this test strategy is biased.17 Results from a study investigating the performance of this type of test strategy indicated that the true number of binocular defects can be underestimated by approximately 20%.17
There is no direct monitoring of fixation on the Humphrey EVFT. In contrast, the binocular simulation is based on results from the Humphrey monocular fields where fixation is monitored throughout the test by a method that presents stimuli at the site of the predetermined blind spot. Control of fixation is an important component of perimetric testing and reliability of response.18 While the lack of fixation monitoring on the EVFT may mimic a “real” field of view it may also inflate the number of points seen compared with results from merging the monocular fields.
The obvious limitation of the binocular simulation is that it can only provide an assessment of the central field whereas the EVFT tests the full peripheral field across 130°. It has, however, been suggested that the distribution of points on the Esterman grid does not fully reflect the claimed functional significance.19 For example, it has been shown that the central 10° may provide the input for up to half of the primary visual cortex.20 It may be that a functional assessment based on central areas may have a wider role in assessing visual ability.
The binocular simulation may provide an indication that a patient with bilateral defects should be further investigated in terms of legal fitness to drive. This is particularly relevant in the UK where currently the recommended definition for the standard of the minimum field of vision for safe driving includes, “... no significant [field] defect in the binocular field which encroaches within 20° of fixation [either] above or below the [horizontal] meridian.”4 The high level of sensitivity (100%) and specificity (86%) associated with the binocular simulation in determining whether a glaucomatous patient with bilateral defects will have at least one defect (<10 dB) on the EVFT suggests this may be a useful guide for clinicians. Patients demonstrating defects on the binocular simulation are likely to exhibit defects in the central area of the EVFT and may warrant further investigation. Equally, patients presenting with no defects on the binocular simulation are likely to exhibit no defects in the central area of the EVFT. The utility of this indicator that a glaucomatous patient may fail the criteria for legal fitness to drive in the UK may be proved by establishing a link between defects in the central field and significant defects in the peripheral field. An investigation is under way but actual testing of the peripheral binocular field is likely to remain central to assessing legal fitness to drive. Nevertheless, the simulation provides the clinician with a rapid and routine assessment of the central binocular field. This may be particularly useful since it has been suggested that alerting elderly drivers to deterioration in their visual performance, so that they can make compensatory changes in their driving behaviour, may be important.21
A recent study demonstrated that while glaucoma is a leading cause of visual disability, in many cases visual field progression is not sufficient to lead to bilateral blindness.22 The study concluded that glaucoma management should be closely tailored to the confirmed rate of visual field loss in an individual. A framework for the analysis of the rate of field loss at individual test locations has been developed.23 24 By using this rate of change in a given series of fields it is possible to predict the sensitivity at subsequent fields. Used in tandem with the binocular simulation described in this study it may be possible to predict the future status of a patient’s central binocular field. These predictions of future changes to the functional field may prove to be useful in the management of glaucoma and demonstrate the “relevance” of the insidious behaviour of glaucomatous progression to individual patients. Such forecasts may be impeded by the inherent variability that exists between visual field results25 but improved perimetric test strategies26 27 and variability reduction techniques28 may reduce this limitation.
In summary, a new method for simulating binocular visual field status in glaucoma by merging results from Humphrey monocular fields has been demonstrated. Results are computed quickly, and displayed in an easy to interpret manner on a computer screen. Substantial agreement exists between the simulated binocular results and EVFT in classifying glaucomatous patients with central binocular defects. In contrast with the EVFT, results from the simulation are based on sensitivity values from a full threshold test strategy and are controlled for fixation. The simulation cannot currently estimate the status of the binocular field beyond the central area. However, it may be a clinically useful indicator for determining whether a patient is likely to fulfil the visual field requirement for legal fitness to drive in the UK. In conclusion, this new method provides a rapid estimate of a patient’s central binocular field and visual functional capacity. This can be ascertained in a routine clinical environment without the need for extra perimetric examination.
Acknowledgments
This work is funded in part by grants from the Royal National Institute for the Blind, the International Glaucoma Association, and the Medical Research Council. The authors thank David Edgar (Applied Vision Research Centre, City University, London) for helpful comments on the manuscript.
The intellectual property rights of the progressor programs belong to the Institute of Ophthalmology and Moorfields Eye Hospital of which the authors are employees.