Article Text

Abstract
AIMS To compare stereophotographic and monophotographic optic disc assessments made using a digital optic disc stereo camera.
METHODS Stereo digital optic disc photographs of 150 selected patients who had presented to a glaucoma clinic were assessed by two masked observers on separate occasions using (1) the stereophotographs and a stereoviewer, (2) a single image from the same stereopair. Results were analysed for both right and left eyes separately. 95% tolerance limits for change (TC) and intraclass correlation coefficients (ICC) were calculated and a multivariate analysis using a general linear model for repeated measures was performed.
RESULTS A total of 201 optic disc images of 150 patients (84 females, 108 left eyes) were analysed. Mean age of patients was 64 years. The results for right eyes are as follows (similar results were obtained for left eyes). Intraobserver (stereoscopic compared to monoscopic) measurements of: horizontal cup:disc ratios (CDR), ICC = 0.5995 and 0.7269, TC = 34% and 27%; vertical CDR, ICC = 0.8298 and 0.817, TC = 25% and 27%; area CDR, ICC = 0.7757 and 0.8259, TC = 28% and 25%; circumference CDR, ICC = 0.7618 and 0.8103, TC = 28% and 25%. Interobserver measurements of: horizontal CDR, ICC stereoscopic (SS) = 0.7287; monoscopic (MS) = 0.5030; TC SS = 30%; MS = 32%; vertical CDR, ICC SS = 0.8439; MS = 0.7106; TC SS = 25%; MS = 31%; area CDR, ICC SS = 0.8392; MS = 0.6276; TC SS = 26%; MS = 32%; circumference CDR, ICC SS = 0.8433; MS = 0.6438, TC SS = 26%; MS = 31%. Systematic bias between observers and between methods was within acceptable limits.
CONCLUSIONS This study using a digital stereo camera indicates that there may be little benefit of stereoscopic imaging over monoscopic imaging despite demonstrating small but inconsistent differences between both observers and methods.
- glaucoma
- optic disc camera
- optic nerve topography
Statistics from Altmetric.com
The detection of early or progressive glaucomatous optic disc changes is essential in the optimum management of glaucoma patients. Despite the plethora of new technologies the accepted “gold standard” for optic disc assessment remains stereoscopic optic disc photography.1-4 However, measurements rely on a subjective evaluation by the clinician and are subject to poor interobserver agreement.5-10
The Discam optic disc camera (Marcher Enterprises Ltd, Hereford) obtains digital monochromatic sequential stereophotographic images of the optic disc and the allied software allows the computation of a number of optic disc parameters. In a previous study, the intraobserver and interobserver repeatability of optic disc measurements was shown to compare favourably with ophthalmoscopic and stereophotographic methods of assessment of the optic disc.11 However, stereoscopic versus monoscopic assessments of the images were not performed.
The aims of this study were to determine whether there were significant differences in intraobserver and interobserver repeatability of the computed optic disc parameters using monophotographic and stereophotographic images to determine the margins of the optic disc and optic cup.
Materials and methods
Stereophotographic digital images of patients presenting to a glaucoma clinic were acquired by two experienced operators following pharmacological mydriasis. The detailed method has been previously described.11 The quality of the images were assessed by observer 2 (MC), on the basis of contrast, clarity, stereoscopic appearance, illumination, and excessive movement between the image pair. As this study did not aim to determine the clinical usefulness of the Discam, but purely to compare two methods of assessment, only high quality images were used for analysis in order to maximise any differences. Exclusion criteria were poor illumination of the disc, poor quality image, lens opacity, poor stereoimage (large shift on the screen between images of stereo pair) and optic discs of anomalous configuration (those which were tilted, colobomatous, or myopic). A total of 201 images (from a total of 300) were considered suitable for inclusion in the study. Two masked observers (BP and MC), ophthalmologists experienced in the clinical use of the Discam, assessed the selected disc images on two separate occasions within 1 month, first making a stereoscopic assessment of the discs and on another occasion a monoscopic assessment. The stereoscopic assessment included an initial “flickering” of the image pairs which were subsequently displayed simultaneously on a high resolution computer screen for detailed examination using a hand held stereoviewer (Screen-Vu Stereoscope, USA). The inner edge of the scleral rim (the optic disc) and the point at which the neuroretina first deviated posteriorly (the optic cup) were traced out on the screen using a computer mouse. On a separate occasion, the optic disc and optic cup were drawn without the use of either the stereoviewer or previous “flickering” of the image pairs. The computer software (Discam version 3.0.0.1) then calculated the vertical and horizontal cup:disc ratios (CDR), together with cup area to disc area and cup circumference to disc circumference ratios.
A statistical analysis of the variability of both intraobserver and interobserver measures was then performed. The images acquired from right and left eyes were analysed separately to avoid bias due to intereye correlation. The distribution of the data was examined to demonstrate normality. Scatter plots of measurement differences plotted against measurement averages (Bland-Altman plots12) were produced. To analyse measurement variability, the 95% tolerance limits for change (TC) and the intraclass correlation coefficient (ICC) were calculated. The intraclass correlation coefficient (ICC) coefficient is equivalent to a quadratic weighted kappa statistic, which is a chance corrected measure of agreement, weighting degrees of discrepancies according to the square of the difference between the (paired) measurements.13 The ICC only indicates perfect agreement if the two assessments are numerically equal—that is, if a plot of the two measurements has zero intercept and a slope of unity. However, the (crude) ICC is affected specifically by any systematic differences between the observations within the pairs. In other words, even perfect “agreement” in the context of such systematic differences will result in an ICC less than 1. In addition, a general linear model for repeated measures analysis was performed and disagreements of ⩾0.2 units for horizontal and vertical CDRs were also determined.
Results
A total of 201 images (108 left and 93 right) of the optic discs of 150 patients (66 males and 84 females), mean age 64 (median 66; range 22—87), of normal, suspicious, and glaucomatous eyes were examined. All images were acquired between 9 September 1998 and 16 June 2000.
Intraobserver (stereoscopic/monoscopic = intermethod) and interobserver variability results for right and left eyes are shown in Tables 1, 2, 3, 4. The distributions of all data and the difference between observations approximated to the normal distribution and scatter plots of repeated measurements showed close agreement.
INTRAOBSERVER (STEREOSCOPIC COMPARED TO MONOSCOPIC) ANALYSES
Bland-Altman scatter plots showed that the magnitude of intraobserver differences were unrelated to the size of the measurement. However, for observer 2 there is a suggestion that H-CDR and V-CDR differences between stereoscopic and monoscopic assessments (SM) were smaller in more severely cupped discs (indicated by a funnel shape to the scatter plot in Fig 1). There was also a suggestion in left eyes that V-CDR monoscopic measurements were larger than stereoscopic measurements for less cupped discs (that is, the calculated differences tended to be negative for smaller CDR as shown in Fig 1).
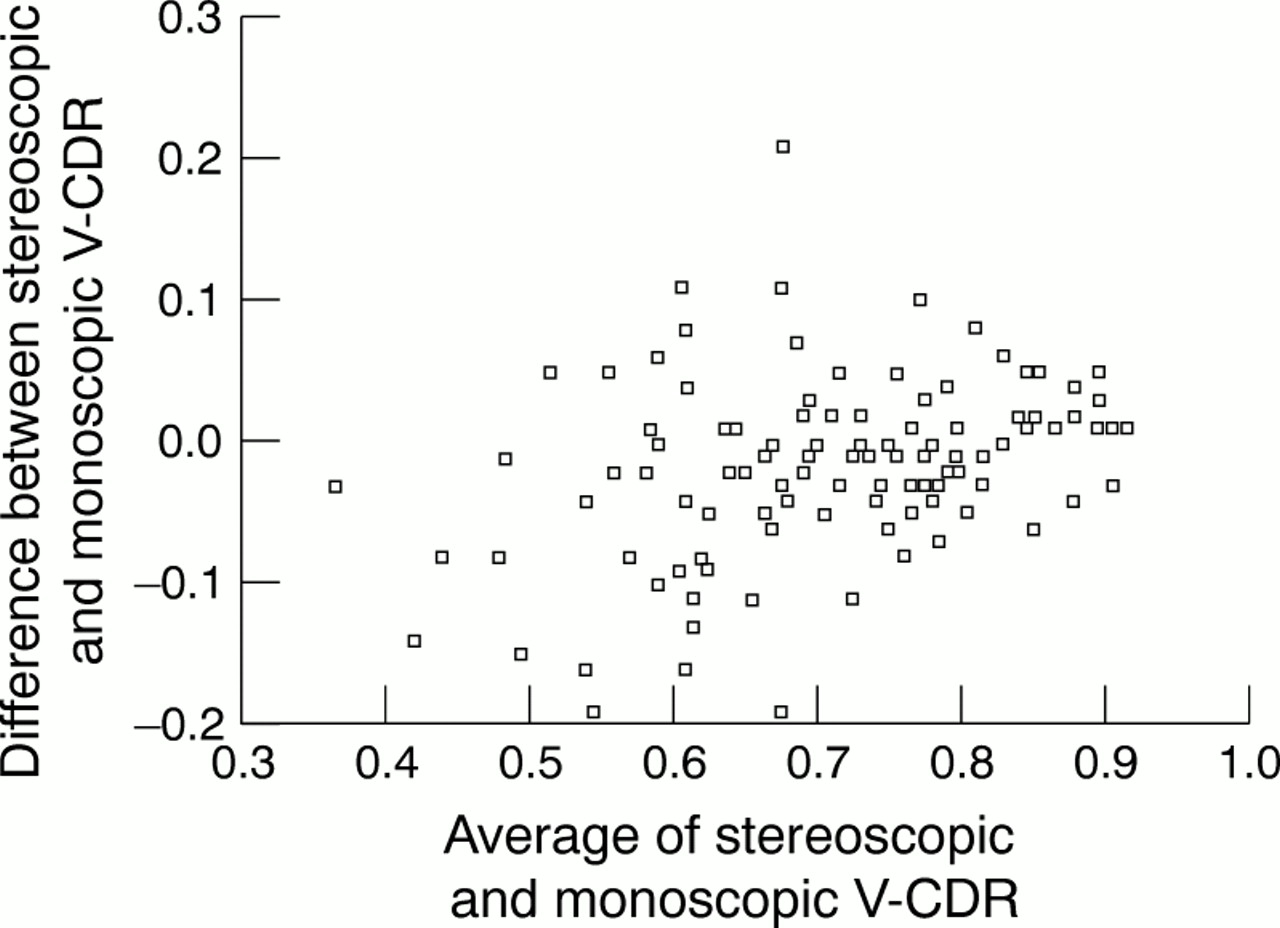
Observer 2 stereoscopic versus monoscopic assessment for left eyes, vertical cup:disc ratios (V-CDR).
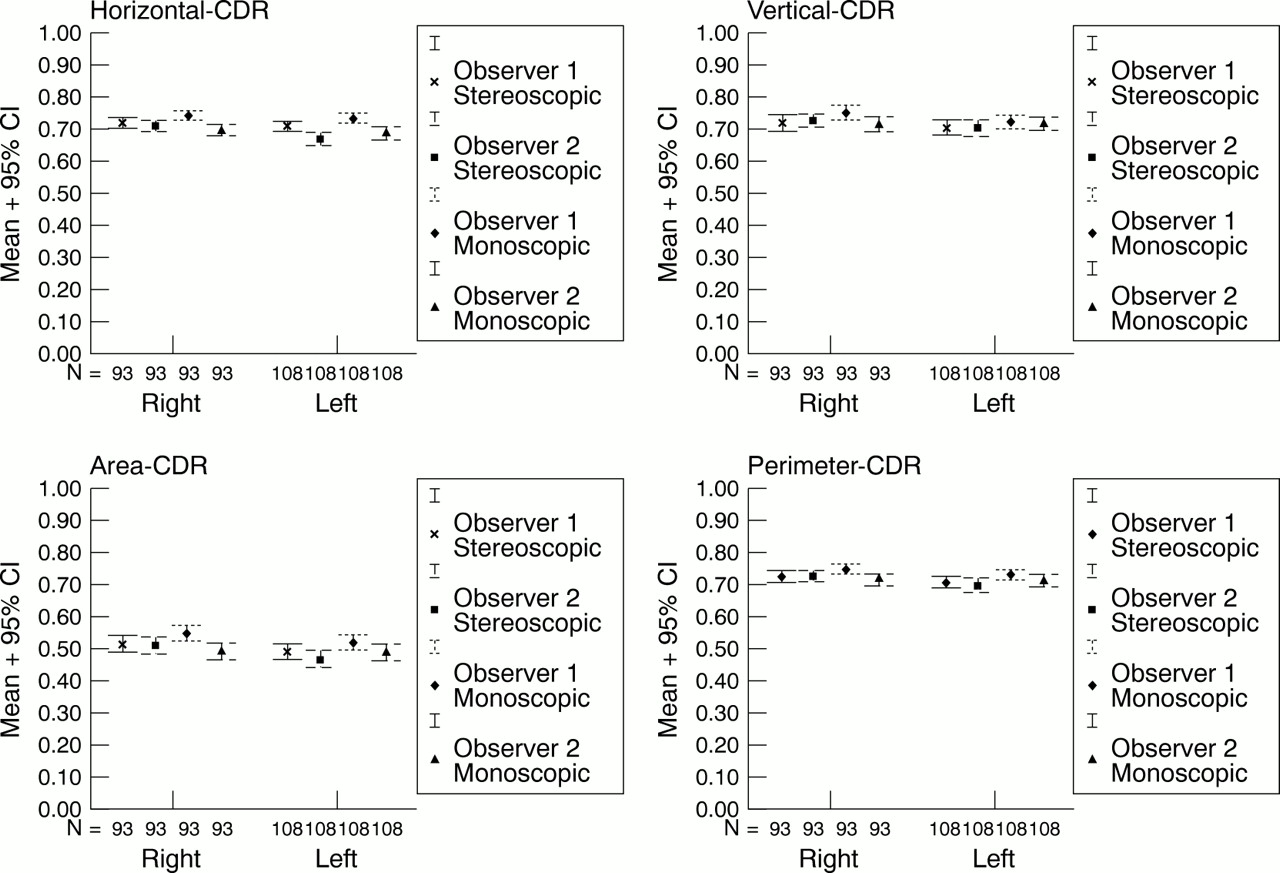
Mean monoscopic assessments made by observer 1 were slightly larger than the corresponding stereoscopic assessments, reaching statistical significance for all measurement parameters (H-CDR, V-CDR, A-CDR, and P-CDR) for both right and left eyes. Observer 2 also made slightly larger mean monoscopic assessments of all measurement parameters for left eyes, which again reached statistical significance, but for right eyes observer 2 made slightly smaller mean monoscopic assessments. However, overall the systematic errors were very small and best illustrated graphically (Fig 2).

Mean and 95% confidence intervals for each of the optic disc variables measured, with right and left eyes analysed separately.
For both H-CDR and V-CDR, agreements between monoscopic and stereoscopic assessments were within 0.2 CDR units in at least 97% of eyes. ICC showed very significant agreements between all assessments but was lowest for H-CDR assessments. Tolerance limits for change, which take into account the range of measurements, varied from 20% to 34% and were generally smaller for left eyes. The smallest tolerance limits overall were for the V-CDR and the widest for H-CDR.
INTEROBSERVER ANALYSES
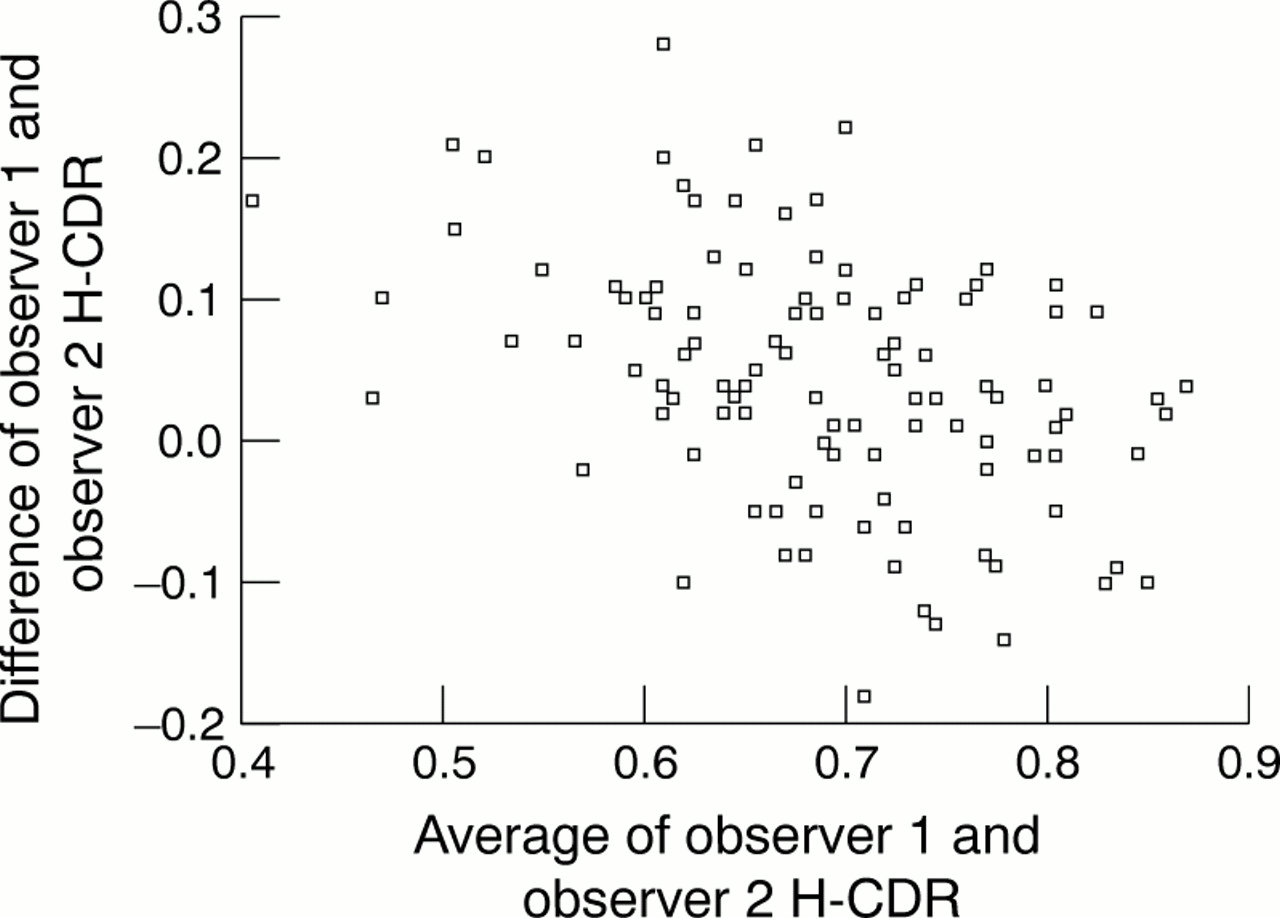
Bland-Altman scatter plots showed that the magnitude of interobserver differences was again essentially unrelated to the size of the measurement. However, for observer 1 the H-CDR monoscopic assessments were generally larger than those made by observer 2 (that is, calculated differences tended to be greater than zero as shown in Fig 3). In addition, observer 1 H-CDR stereoscopic assessments were generally larger than those made by observer 2, particularly in the less severely cupped discs (indicated by a downward slope to the scatter plot in Fig 4).

Observer 1 versus 2, monoscopic assessment, horizontal cup:disc ratios (H-CDR) for left eyes.

Observer 1 versus 2, stereoscopic assessment, horizontal cup:disc ratios (H-CDR) for left eyes.
Mean stereoscopic assessment differences were generally smaller than the mean monoscopic assessment differences and also the mean intraobserver monoscopic/stereoscopic differences. However, the tolerance limits for change were broadly similar. The mean stereoscopic differences between observers only reached statistical significance for left eye H-CDR and A-CDR, whereas mean monoscopic differences reached statistical significance for all measurement parameters except left eye V-CDR. Overall, observer 1 mean assessments were larger than those of observer 2; however, these only reached statistical significance consistently for monoscopic assessments. Once again all of the systematic errors were very small (Fig 2).
For both H-CDR and V-CDR, agreements between monoscopic and stereoscopic assessments were within 0.2 CDR units in at least 95% of eyes. ICC showed very significant agreements between all assessments but was again generally lowest for H-CDR assessments. Tolerance limits for change varied from 19% to 32% and were similar for both right and left eyes. They were, however, generally wider than for the intraobserver monoscopic/stereoscopic comparisons. Overall the narrowest tolerance limits were again those of V-CDR and the widest those of H-CDR.
MULTIVARIATE ANALYSIS
The general linear model for repeated measures analysis revealed that for both right and left eyes, the effect of the observer on the measurements is statistically significant with the exception of V-CDR for left eyes (Table 5). The analysis also shows that for left but not right eyes, the effect of method of assessment on repeatability (stereoscopic v monoscopic) is statistically significant. It is not surprising therefore that observer/method interactions are not apparent in left eyes whereas they are significant for right eyes. This implies that for right eyes at least there is some inconsistency in the errors made by each observer when using the different methods.
Stereoscopic-monoscopic intermethod (intraobserver) variability statistics for right eyes
Interobserver variability statistics for right eyes
Stereoscopic-monoscopic intermethod (intraobserver) variability statistics for left eyes
Interobserver variability statistics for left eyes
General linear model for repeated measures analysis
Discussion
It is of paramount importance that any topographical measurement of the optic disc is highly repeatable in order to facilitate both the reliable detection of the abnormalities and the temporal changes that occur in chronic optic neuropathies such as glaucoma.
In a previous study the intraobserver and interobserver repeatability of stereoscopic optic disc assessments using the Discam optic disc camera was shown to be as reliable as conventional stereophotographic assessments11 and better than clinical optic disc assessment.10 For this reason, it was not felt necessary to include intraobserver repeatability measurements in this study. Although stereoscopic methods of photographic optic disc assessment are considered to be better than monoscopic methods3 the effect of stereoscopic verses monoscopic delineation of the optic disc and cup margins was not addressed by the investigators. Whereas stereoscopic assessments require a stereoviewer, careful alignment, stereopsis, and concentration the monoscopic assessments require only the latter. This study was therefore designed to determine the benefits, if any, of stereoscopic optic nerve head assessment using the Discam camera.
The results of the study reveal a tendency for monoscopic assessments to yield slightly larger optic disc parameters than stereoscopic assessments. This effect was more marked for observer 1 whose monoscopic assessments were also slightly larger than those made by observer 2. Intraobserver versus interobserver repeatability comparisons usually show that the former is more reliable than the latter and a similar trend appeared in this study. Although any comparison is not be strictly valid, as methods of image assessment were compared with interobserver variation the results suggest that the effect of the observer may be more important than the effect of the method. Interestingly, and as expected, stereoscopic interobserver differences appeared smaller than the corresponding monoscopic interobserver differences. However, the effects were very small.
Agreements were generally extremely good but analyses revealed that the V-CDR was consistently more repeatable than H-CDR having narrow tolerance limits for change, larger ICCs and fewer CDR differences > 0.2 units. However, ICCs were slightly but consistently lower than those previous published even for the directly comparable interobserver stereoscopic assessment.11 Tolerance limits for change were similarly slightly wider; however, the standard deviations of the differences were of very similar magnitude. These wider tolerance limits for change (which is a function of the measurement interval) may in part be attributed to the narrower range of CDR parameters in the current study and serves to highlight a potential weakness of expressing data in this way, as outliers have disproportionate influence. The tendency for V-CDR measurement differences to be greater towards the lower end of the measurement range as reported in the previous Discam paper11 was not evident in this study possibly because none of the optic discs imaged had very small optic cups.
Overall, the variations observed were very small as illustrated clearly in Figure 2. Although the assessment of the edge of the optic cup was subjectively facilitated by a stereoscopic view, it is doubtful whether the statistical systematic errors detected, which may reflect the large sample size, will be of clinical significance, particularly when they are compared to the tolerance limits for change. Given that the findings of this study relate to a group of selected optic disc images of good stereoquality, it is probable that both intermethod (intraobserver) and interobserver differences would be less marked or not apparent in unselected cases. It is not possible to extrapolate the findings to a “normal” population of optic discs outside the glaucoma clinic. However, the Discam is most likely to be used clinically for the assessment of the optic discs of a similar population to that examined in this study.
It would, therefore, appear that the Discam images can be analysed on a high resolution screen nearly as effectively monoscopically as stereoscopically which would run contrary to intuition. There are clearly practical advantages to monophotographic Discam image analysis, which relate to the speed and convenience of assessment (nothing more than a standard computer and mouse are required). We stress however that our data are derived from assessment and analysis of screen images and cannot be extrapolated to other media —for example, printed Discam images.
In conclusion, the analysis of intermethod (intraobserver) and interobserver variability revealed systematic biases between observers, between the methods used to determine the margins of the optic disc and cup and also demonstrated an observer/method inconsistencies. However the effects were very small and are probably not clinically significant. Although there may be a subjective benefit in the use of stereoscopic rather than monoscopic images in the measurement of cup to disc ratios, the study did not demonstrate a clinically significant benefit.