Article Text

Abstract
Objectives: To describe the hallucinations occurring as a result of a macular hole in each eye and to investigate the neural basis.
Methods: Psychophysical observations including sketches of the hallucinations calibrated for size.
Results: All the hallucinations were of the geometric (patterned) type and lasted for only a few days.
Conclusions: The observations can be explained on the basis of a “deafferentation” model, which is described in some detail. It is proposed that the hallucinations result from activation of the “blobs” of area V1 and the “stripes” of area V2 in the visual cortex. A theory is proposed to account for the disappearance of the hallucinations by a “filling in” mechanism.
- hallucinations
- macular hole
- deafferentation syndrome
- paroxysmal discharges
Statistics from Altmetric.com
Injury to the visual system can result in a type of hallucination, sometimes referred to as the Charles Bonnet syndrome. There is dispute about whether this syndrome is the result of visual disease or is simply a feature of old age (when visual disturbances are common). This topic has been reviewed by ffytche and Howard1 and I will follow their opinion that there is a close connection between the syndrome and visual disease, although this may be affected by age related changes in the brain. Usually the injury must be such as to cause severe visual loss. This can be a result of direct injury to the cerebral cortex or to more peripheral visual structures. The commonest condition leading to the syndrome is age related macular degeneration, with glaucoma and cataract playing lesser roles.1
In recent years hallucinations have been reported in a variety of other conditions, for example enucleation of the eye,2 optic neuritis, retinitis pigmentosa, and diabetes mellitus,3 macular photocoagulation,4 optic neuritis and Leber's hereditary optic neuropathy,5 and macular translocation.6 The hallucinations can extend from simple flashes, through repetitive patterns, to the appearance of people, animals, or scenes. According to conditions visual hallucinations can be mild, fleeting and almost unnoticed or they can be strong, persistent and disturbing. It is possible that extensive visual loss is associated with complex hallucinations, and minor visual loss with simpler patterned geometrical imagery, but there is no hard evidence in favour of this proposition at present. Quite often these hallucinations disappear after weeks or months. They are clearly not associated with any psychiatric condition but perhaps the fear that they may be so interpreted has caused them to be underreported.7 Understanding the neural basis of these hallucinations would assist in diagnosis and possibly in treatment of the condition.
EXPERIMENTAL SUBJECT, METHODS, AND RESULTS
I recently experienced fairly simple hallucinations of the Charles Bonnet type, resulting from the conjunction of a macular hole in each eye. The macular hole in my right eye is a stage 3 hole (retraction of the foveolar receptors to produce a hole > 400 μm diameter8) and had been there for about four years. The left eye developed a stage 2 macular hole (vitreofoveal separation and formation of a hole < 400 μm diameter8) over recent months. Before this the left eye had a very small foveal scotoma (about 0.15° diameter), but corrected acuity was reasonably good (better than 6/12). The hallucinations started about 11 weeks after the acuity in the left eye had begun to deteriorate, at a time when acuity was between 6/12 and 6/18.
When I had a macular hole in my right eye but my left eye was fairly normal, the only “hallucination” I had consisted of flashes. These occurred when I was viewing a bright screen—the television screen or the monitor screen of the computer. They would happen when I blinked or looked away from the screen and therefore could be regarded as “evoked.” Each flash lasted much less than a second. The shape was irregular but the edges were fairly sharp. The dimension was 1–2°, similar to the scotoma in the right eye. These have continued to the present.
The hallucinations appearing with deterioration in the left eye were more complex. At first they were of the sort shown in fig 1A. The commonest was the type resembling a brick wall. The pattern consists of a small number of horizontal lines (four, five, or more) with a larger number of less well defined vertical lines, the whole covering an area of rather less than 1° but with the outer parts quite indistinct. This structure resembles a brick wall seen at a distance of about 50 metres. If we take the vertical distance between courses of bricks as 85 cm, then the vertical separation of the horizontal lines is about 0.1°. Taking the magnification factor of area V1 at the fovea as 10 mm/degree,9 the lines are about 1 mm apart on the cortex. An illustration of this “brickwork” hallucination is shown in fig 3A of the paper of ffytche and Howard,1 but this is not scaled. This “brickwork” can appear in various forms, as shown in fig 1Aa, b, and c. I noticed another type also at this time, that shown in fig 1Ad . This consists of a jumble of bright arches, usually at an angle of about 45°, sometimes angled to the left, sometimes to the right. This type is so faint and evanescent that it is possible it was occurring even before deterioration of the left eye (but see later).
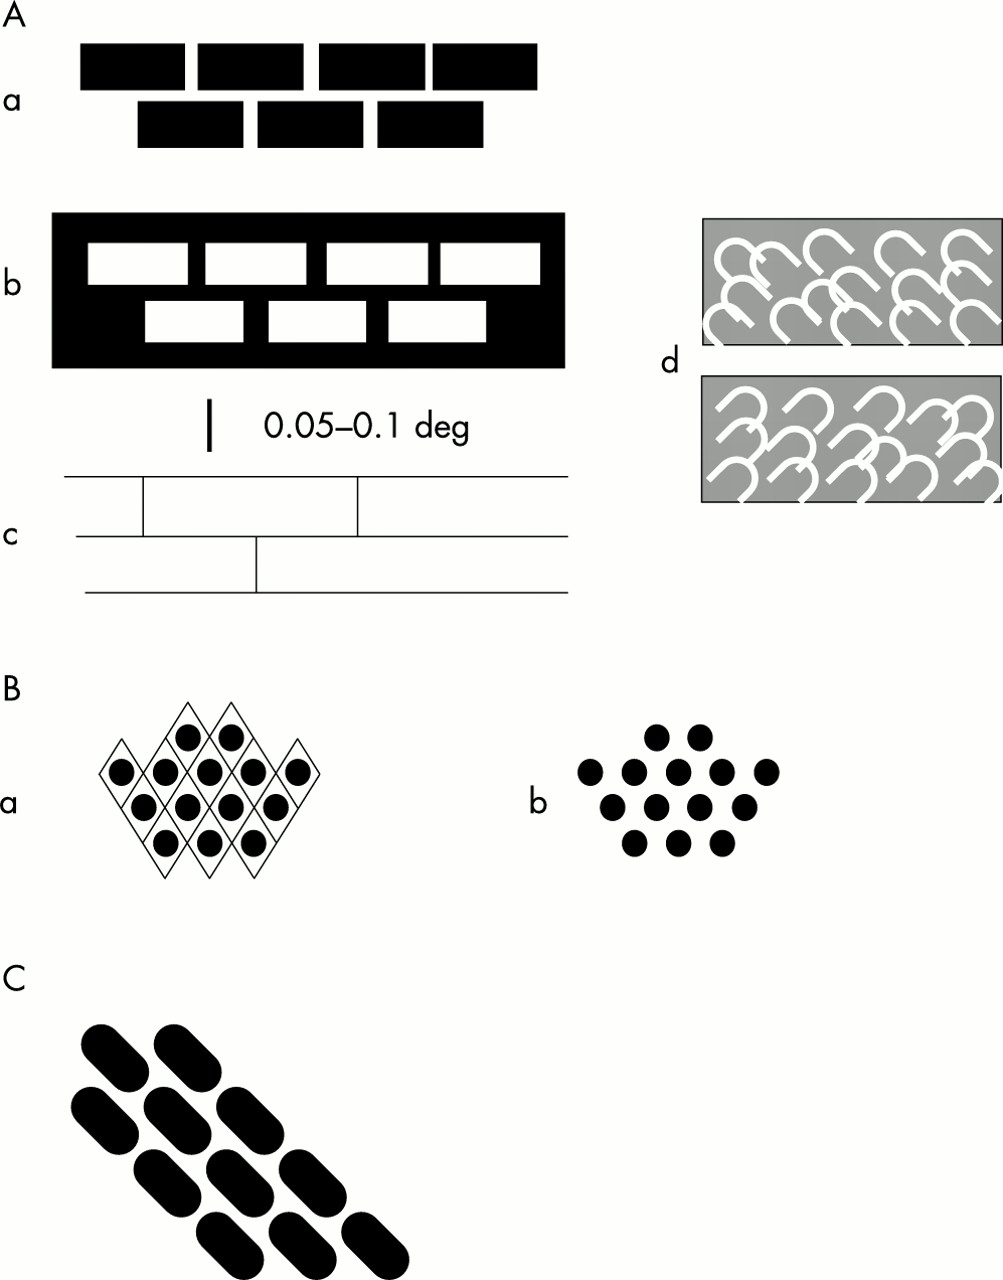
Sketches of portions of the hallucinations seen by the author. Further description in the text. The hallucinations consisted of small regions much less than 1° in diameter and were usually faint and fleeting. The scale bar applies to all parts.
About a week after these complex hallucinations started, I began to have a different sort (fig 1B). This new type seemed to replace the hallucinations of fig 1A, but for a time both types occurred together. The new hallucinations consisted of rows of small round objects (“spots”) arranged in a fairly regular way. On some occasions, rather infrequent, the arrangement resembled an “egg crate” with a diamond shaped pattern, very similar to the hallucinations shown in fig 2, panels A and D, of the paper of ffytche and Howard.1 The hallucinations of fig 1B persisted for several days.

Cytochrome oxidase (CO) patches in monkey and human. (A) Flat mounted section from the visual cortex of squirrel monkey. Area V1, at the right, contains rows of “blobs.” To the left of area V1 is area V2 containing CO “stripes.” Scale bar 5 mm. (From Tootell et al (1983),52 with permission.) (B) Tangential section from human visual cortex to show “blobs” in area V1. There is some indication of lighter material connecting the denser blobs. Scale bar 5 mm. (From Horton and Hedley-Whyte (1984),44 with permission).
Very soon after this I started to see the hallucinations shown in fig 1C and the other hallucinations faded. This hallucination was quite frequent and fairly sharp but, as in the case of the brickwork hallucination, I am unsure of the spacing of the “bricks.” However, the angle of the courses was very close to 45°. Finally, all hallucinations, except the “flashes” and the type shown in fig 1Ad , disappeared at about 10 to 12 days after the first hallucinations. All these hallucinations would be classified as “tesselopsia” according to the definition of ffytche and Howard,1 a term referring to the appearance of tiles. Although I usually saw these hallucinations when I was reading or viewing the monitor screen of the computer, they were not “evoked” but could be seen when looking at a neutral background. Nevertheless, they were more frequent in the first situation. It is also relevant that the apparent size did not alter with change of focus of the eyes, indicating that they were not after-images (compare Emmert's Law). I did not see colour in any of these images. The hallucinations were present during the time the macular hole in my left eye was developing; at the time the hallucinations disappeared the acuity was worse than 6/24 and there was marked distortion of perception. It is important to stress that the scotoma in my left eye was a circle of about 0.4° diameter and the hallucinations were of similar magnitude.
Hallucinations, mainly of the brickwork type, reappeared about 38 days after their first appearance and persisted for about 10 days. However, the images were very faint and I might not have noticed them at all had I not previously had the experience with the stronger sort. Since then I have occasionally experienced type A hallucinations in an extremely faint form, particularly if awakening during the night. The left eye was successfully operated on (pars plana vitrectomy) but about four months after the operation I developed macular cystoid oedema and for four days near the peak of this disturbance I again experienced the brickwork hallucinations.
DISCUSSION
Proposal about the origins of these hallucinations
An important concept has recently been developed by ffytche and colleagues.3,8,10 This is that particular types of hallucination are associated with particular areas of the brain. I have extended this concept to include simple patterned hallucinations. In addition I suggest that the hallucinations result from a deafferentation of certain visual structures in the brain, chiefly the cortex, or from the effective silencing of the principal afferents to these structures. The concept of deafferentation leading to an excessive response has previously been applied to other parts of the nervous system—for example, the deafferentation pain syndrome.11 Indeed, the concept has also been applied to the Charles Bonnet syndrome but has usually been interpreted as a release phenomenon (that is, disinhibition) or not elaborated in detail (reviewed in Schultz and Melzack12 and Manford and Andermann13). My purpose in this paper is to put flesh on these bare bones. I suggest that deafferentation leads to an increase in excitability of the deafferented neurones because of biochemical and molecular changes, and is associated with an increase in spontaneous activity (compare Lance14). This spontaneous activity, which may be of a special nature, is then the basis of the hallucination. I will now elaborate these points.
Deafferentation and disuse
It seems to be an unvarying feature of the nervous system that when a region becomes denervated or deafferented the cells therein become more excitable. Such hyperexcitability occurs in the visual system,15–17 in the auditory system,18,19 in the vestibular system,20 (reviewed by Møller18), and in the motor system (also reviewed by Møller18). There are many examples; thus there is a large literature dealing with the phenomenon of “denervation hypersensitivity.”21,22 Deafferentation of a neurone may have several consequences. The neurone may atrophy and die, especially if all its input is removed. It may survive if has sufficient input from other sources. Usually there is sprouting of other axons in its vicinity. Existing inputs that are normally ineffective through inhibition may be disinhibited. There are changes at the synapses both presynaptically and postsynaptically. Two sets of changes seem to be particularly important.
First, presynaptically there are increases in the size of the bouton, in the total number of vesicles, in the number of docked vesicles, in the size of the release zone, in the size of the readily releasable pool, and in the release probability.23 When synapses are “disused” a greater number of receptors in the (postsynaptic) membrane of the disused neurone appear on the surface,24,25 and the postsynaptic membrane shows a greater response to applied current.17 Conversely, when synapses are strongly stimulated the receptors become internalised.26,27 In the cells of isolated cortex there is an increase of membrane resistance and of membrane time constant, which could partly account for the increased excitability of these cells,28 but this may reflect the fact that the isolation procedure causes axotomy of the cells: this would be a factor in some but not all cases of the Charles Bonnet syndrome.
Second, there are significant biochemical changes in the vicinity of the deafferented synapses. There is an increase in the glutamatergic NMDA (n-methyl-d-aspartate) response and a decrease in the GABAA (γ-aminobutyric acid) and GABAB responses in the region surrounding the deafferented cells,29 and there are other, probably less important, factors. Altogether, these changes will account for the hyperexcitability of the deafferented neurones.
Spontaneous activity
There are several reports of increased spontaneous activity following deafferentation. The most clear cut occur when a region of cerebral cortex is neurally isolated.30 The pattern of activity so generated consists of periods of relative inactivity interspersed with slow waves in the electroencephalogram on which ride high frequency (20 to 30 a second) “bursts” of action spikes, a pattern described as “paroxysmal hypersynchronous,” resembling the discharges associated with seizures.30 This pattern persists in the chronic state and even in cortical slices in vitro.28 At a single cell level the most dramatic example is provided by 2-neurone microcultures of rat hippocampal neurones grown for weeks in blockers of synaptic activity.31 When the synaptic blockers are removed the neurones quickly develop epileptiform activity. In the spinal cord of both human and cat deafferentation leads to increased spontaneous activity, at times becoming epileptiform.32,33
In other cases spontaneous activities may or may not be increased. Thus a retinal lesion in the cat is followed by increased spontaneous activity in visual cortex adjacent to the deafferentation zone but not within it.29 Records from somatosensory cortex deafferented by loss of a forelimb apparently do not show increased spontaneous activity.34 Deafferented cells in the gracile nuclei of cats may show increased spontaneous activity or decreased activity.35 The reasons for these conflicting results may be that the deafferented neurones were not completely deafferented, that the conditions were not stationary, or that the neurones became reactivated.
A critical feature of the spontaneous activity may be not so much the absolute level of activity but whether there are high frequency bursts of activity. It has been shown that bursts in thalamic neurones can lead to exceptionally strong discharges in cortical cells.36 This is particularly true if the burst is preceded by a relatively long silent period (short term “disuse”). This hyperexcitability applies even to the first spike in the burst. Such bursts may be needed to reach a threshold for an effect (such as a hallucinatory event), which would not occur as a result of a “tonic” discharge.
Comparison with paroxysms and dreams
There are similarities between hallucinations and local seizures. Indeed, they often occur together.14,37 Seizures appear to be caused by bursts of activity originating in a group of neurones that have been isolated either by deafferentation or by trauma or tumour. Seizures can result from episodes of hypoxia (for example, a stroke38) and other types of trauma39 which almost certainly involve a deafferentation. Almost any region of cortex can be made hyperexcitable by isolation.30 Drugs that are used to control epilepsy, such as phenytoin or carbamazepine, may also be effective in abolishing hallucinations.14 I suggest that hallucinations of the Charles Bonnet type are similarly caused by deafferentation resulting in bursts of activity in the deafferented structures. In each case of deafferentation the activity gives rise to sensory or motor effects characteristic of the hyperexcitable area. Thus hallucinations can be regarded as local paroxysms in the sensory system. An essential feature of seizures, and probably also of hallucinations, is the occurrence of synchronisation of nerve discharges.
Hallucinations also resemble dreams in several respects (see Kahn et al 40). Dreams occur primarily in rapid eye movement (REM) sleep and in this phase of sleep there is increased excitability of the neurones of the dorsal lateral geniculate nucleus (dLGN).41 This leads to spontaneous discharges in the dLGN neurones and in many other neurones, associated with a strong synchronising force owing to the ponto-geniculo-occipital (PGO) waves.42,43 PGO waves are probably indirectly responsible for much of the visual imagery of dreams. The first episode of REM sleep occurs only after 90 minutes or so of slow wave sleep. The hyperexcitability in dLGN neurones may reflect this long period of relative disuse, but there could also be a deafferentation hypersensitivity created in the neurones of the parabrachial nucleus (reticular formation) where the PGO waves originate. Finally, dreams also have a relation with seizures. The dLGN discharges in REM sleep can be described as epileptiform, and body movements—both eye movements and the small movements of paws and vibrissae seen in cats and dogs—have a myoclonic quality.42
Regional distribution of visual hallucinations
Santhouse and colleagues,10 using functional magnetic resonance imaging (fMRI), have shown that different types of hallucination are localised in different regions of visual cortex. For example, faces were found to be localised in the superior temporal sulcus; objects and extended scenes in the ventral occipito-temporal cortex; and eye centred reference frames (perseveration images, palinopsia) in the parietal lobe. These are all non-visuotopic areas. Do hallucinations occur in (lower order) visuotopic areas? I suggest that they do. If there is hyperactivity in any area it will evoke the imagery that is coded by that area. If the superior temporal sulcus codes for faces then increased activity therein will produce a percept of faces. Therefore, hyperactivity in the visuotopic areas would be expected to produce percepts reflecting the spatial pattern created by the discharges.
Specific proposal regarding geometric hallucinations
The hallucinations depicted in fig 1 bear a striking resemblance to the patterns created in areas V1 and V2 by staining for cytochrome oxidase or by fMRI imaging. In the human the “blobs” in area V1 are about 400 × 250 μm, at a density of one blob per 0.6 to 0.8 mm2, and are organised into rows spaced about 1 mm apart (fig 2B).44 These rows abut the V1/V2 border at right angles. Assuming this border represents the vertical meridian, as it does in other primates, if the cells therein were selectively activated they would convey a perception of horizontal features. However, because of the regular arrangement of the blobs it is also possible to trace rows at 45° to the V1/V2 border. The geometrical patterns shown in fig 1B may correspond to the “blobs” of area V1. The “spots” are about 0.025–0.05° diameter, corresponding to about 250–500 μm in the foveal region of area V1. They are separated (centre to centre) by about 0.05–0.1°, equivalent to about 0.5–1.0 mm in foveal area V1. As the blobs are associated with colour vision it may be asked why I did not see my patterned hallucinations in colour. Each neurone within the stripes of the macaque is sensitive to a different range of wavelengths45 and this is probably true also for the blobs46,47 (but see Roe & Ts'o's paper48). Therefore if all the neurones were active one would predict a perception of white light (and an afterimage of blackness).
I suggest that the “brickwork” shown in fig 1A corresponds to the “stripes” that are a feature of area V2 (fig 2A). “Stripes” in human area V2 have been reported by Horton and Hedley-Whyte44 but not illustrated or quantified. However, they have been illustrated by Wong-Riley et al,49 Burkhalter and Bernardo,50 and Clarke.51 Unfortunately their measurements of stripe width and spacing do not agree. They agree that there is only one type of dark stripe. But Clarke finds these 0.5–0.7 mm wide and 1.0–1.4 mm apart, whereas Burkhalter and Bernardo50 found the width of the dark stripes to be 1.0–2.75 mm while that of the pale stripes was 1.5–2.75 mm. Wong-Riley et al found the dark stripes to be 0.58–1.4 mm wide and 1.5–2.3 mm apart.49 The reasons for these differences are not clear but may be associated with variable amounts of shrinkage resulting from the long periods between death and fixation. In the macaque and squirrel monkeys there are thick and thin dark stripes and pale stripes. In the squirrel monkey the stripes are 0.4–0.7 mm wide with a centre to centre spacing of 1.0–1.5 mm; in the macaque the stripes are less well defined but are slightly wider and 1.5–2.5 mm apart.52 Thus these values overlap the estimates for human V2. As described earlier, the rows of “bricks” are about 1 mm apart in my hallucinations (fig 1A). Like the blobs in area V1, the stripes are oriented perpendicular to the V1/V2 border. The stripes, as revealed by cytochrome oxidase staining, are not uniformly stained along their length (fig 2A). Furthermore, Ts'o and colleagues45 have shown that the stripes can be subdivided into subcompartments 0.7–1.5 mm diameter, both by optical imaging and physiologically. I am unable to give precise values for the horizontal separation of my “bricks” but it is possible that the bricks correspond to the subcompartments although they seem to be rather longer.
There is a serious discrepancy between this suggestion and the fMRI results on hallucinating subjects. ffytche and colleagues3 found in one subject that hallucinations of textures produced increased activity around the collateral sulcus, not near areas V1 or V2. fMRI is an evolving technique. The signal is derived by subtracting the response obtained under control conditions from the response obtained under test conditions. These same investigators found that hallucinators failed to show an increased signal in the fusiform and lingual gyri during hallucinations and realised that this was due to a large increase in response in the controls, making the difference between controls and tests insignificant. They found activation in the frontal lobe in one patient but not in all experiments. Conversely, it is theoretically possible for a small signal in one area to go undetected but to produce a much wider disturbance (and therefore signal) in the area to which it projects.
Thus, although there are difficulties, a case can be made out for equating the “egg crates” (fig 1Ba ) and “spots” (fig 1Bb ) with the blobs of area V1 and the brickwork (fig 1A) with the stripes of area V2, but the case is not cast iron and we should do everything possible to get additional evidence for or against the idea. I distinguish the brickwork hallucinations from the fortification illusions of migraine aura53,54 which progress across the cortex as if in cortical spreading depression and which seem to be a different phenomenon.
It might be thought that the spots and the courses of brickwork should not be straight but curved, as a line orthogonal to the V1/V2 boundary will follow the isoeccentricity curves (see Horton and Hoyt55 and Allman and Kaas56). However, my hallucinations cover a very small area, in sharp detail only about 0.4°, that could easily be part of a much larger curve. It is impossible to say whether there is a discrepancy with other brickwork hallucinations since there are no details published as to their size or spacing.
Clarke51 also reports that a patient who had had age related macular degeneration and had lost very many ganglion cells in the central retina had V2 stripes that were twice as far apart as in the normal case. This condition is thought to be associated with a loss in the parvocellular system, with the magnocellular system relatively untouched. If this is the case, the surviving dark stripes might be magnocellular stripes, although they are now much wider (∼2 mm). It is unlikely that this case can be compared with my case because I have experienced very little loss of acuity following the operation.
It is more difficult to suggest a locus for the images in fig 1C. However, the 45° orientation of the “bars” appears also in the images of fig 1B and in those of fig 1Ad. It must also be noted that none of these images is stable—there is a constant rearrangement of the elements. Therefore I suggest that the blobs of area V1 (the “spots” of fig 1B) can amalgamate at a 45° angle to form the “bars” of fig 1C. The images of fig 1Ad may, because they are the most persistent, belong to a lower visual area. As mentioned earlier, the “flashes” may be evoked—that is, generated in the retina.
Special features of blobs and stripes
The regions of dense cytochrome oxidase staining are areas of high metabolic activity, as evidenced by the corresponding patterns in the fMRI records. It would be expected that the spontaneous activity resulting from deafferentation would find expression primarily in these areas. Although there are strong cross linkages between neurones with similar orientation sensitivity, the neurones in the blobs do not respond well to oriented contours. However, there are probably horizontal connections of other sorts sufficient to provoke a synchrony between cells that are already hyperexcitable.
Reactivation of deafferented neurones
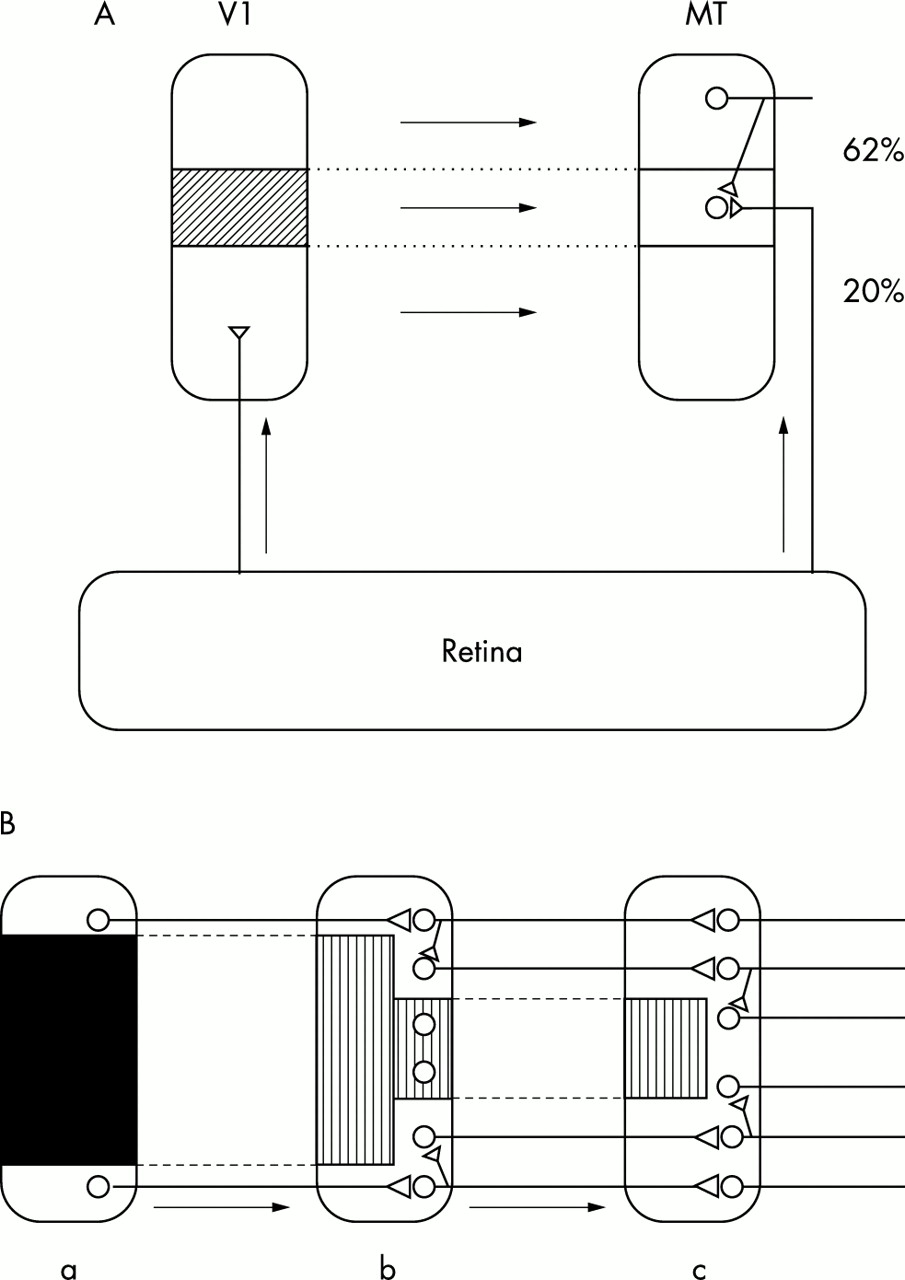
Deafferented neurones in the visual cortex following a retinal lesion become resensitised to photic stimuli after a short time, but their new receptive fields are now displaced to a region of normal retina adjacent to the lesion57,58 (reviewed by Dreher et al 59). It is believed that this reactivation is mediated by the long horizontal axon collaterals of cortical pyramidal cells,58 although there are other possibilities. A similar phenomenon has been demonstrated in area MT (V5) of the marmoset cortex following a lesion in area V1.60 There is a topographic projection from area V1 to area MT.61 In the deafferented zone of area MT a large proportion of cells developed new ectopic receptive fields (fig 3A).
Reactivation of deafferented neurones. (A) Effect of lesion in area V1 on neural circuitry in area MT. A subtotal lesion (shaded area) was made in area V1, which has a topographical projection to area MT. In the lesion projection zone of area MT, 20% of neurones have receptive fields in normal positions; these neurones are thought to be innervated by an extrastriate pathway. However, 62% have ectopic receptive fields and are probably activated via axon collaterals of neurones that receive a normal input from area V1. (Diagram based on data from Rosa et al, 200060). (B) Cascade model for the reactivation of deafferented neurones. A lesion (dark area) in cortical area a causes deafferentation of certain neurones in area b (hatched area) but some of these may be reactivated by axon collaterals of non-deafferented neurones. This process may be repeated in area c. In this way the deafferentation may be progressively reduced but with the loss of precision of representation. If hallucinations arise in deafferented neurones, reactivation should abolish their occurrence.
Long axon collaterals exist in visual cortex, motor cortex, and frontal cortex and probably occur in all parts of the cerebral cortex. Therefore it is very likely that a lesion in any part of the cortex will have effects in the cortex to which the lesioned area projects, similar to those just described in areas V1 and MT—that is, the cells in the lesion projection zone will become activated by inputs from the adjacent cortex. Thus if these areas are arranged topographically there will be, first, a deafferentation and later, a reactivation through ectopic receptive fields. I suggest that the disappearance of hallucinations over time is caused by this reactivation. It is also possible that there will be effects in higher areas in the feedforward chain, more remote from the lesion—a “cascade” effect. A simplified view of what might happen is shown in fig 3B. There is a large lesion in area a, and therefore a large region of deafferentation in area b, to which area a projects topographically. As a result of the neural rearrangement here some of the deafferented neurones now respond to inputs from intact regions of area a, adjacent to the lesion. If area b projects topographically to area c, the deafferented region of c will be relatively smaller than in b because the reactivated neurones in b are now able to reactivate the deafferented neurones in c. If this occurs there will be a progressive shrinkage in the size of the “silenced” region but this will be achieved only at the cost of veridicality of the representation of the environment.
In theory, all cells in a higher area can become responsive, however large the lesion in a lower area, provided first, that the lesion is not total; second, that there are enough stages; and third, that the reactivated neurones respond strongly. Obviously, complete lesioning of an area would not permit the creation of ectopic receptive fields that depend on the survival of part of that area. There is also a limit to the extent to which cells in a lesion projection zone can become reactivated, a limit probably set by the length of the horizontal collaterals or whatever structures are responsible for the reactivation. Finally, the reactivated neurones may not respond strongly enough. For example, following a retinal lesion in an adult cat, neurones in the lesion projection zone of area V1 respond weakly (unless the visuotopically corresponding input from the normal eye is removed) and the input from the lesioned eye almost never becomes the dominant input.62 These limitations will restrict the extent to which the cascade may operate. The result may depend on the degree of convergence of inputs onto the neurones in question. Nevertheless, it is likely that deafferented neurones in a higher area will become reactivated in one way or another and so hallucinations caused by hyperactivity in those areas will cease. When this does not happen it is probably because there has been extensive injury to the input neurones.
Deafferented neurones in the dorsal lateral geniculate nucleus (dLGN) are likely to remain deafferented because the opportunity for reactivation from adjacent neurones is much more limited than it is in the cortex.63–66 For this reason I incline to think that the hallucinations shown in fig 1Ad may be occurring in the dLGN but I am unable to relate them to any structure in that nucleus. In some respects they resemble the “honeycomb” structures described in the superior colliculus67,68 but the translation of patterns in the superior colliculus into consciousness presents a difficulty.
To summarise, if this analysis is correct, we may conclude first, that the more extensive the visual loss the more complex the hallucinations; second, the more extensive the visual loss the longer the hallucinations persist; and third, that in the disappearance of hallucinations the more complex hallucinations should disappear first, followed by other simpler images, progressing back to very simple images that may originate in the thalamus. It would be very desirable to obtain clinical evidence for or against these propositions.
Short period during which hallucinations occurred
Brief periods of occurrence of hallucinations have been described previously. In a report of hallucinations in two patients following macular translocation in one eye,6 the hallucinations appeared within 24 hours and ceased seven and three days postoperatively, respectively.
My interpretation of the short period of occurrence of the hallucinations in my own case is that they first occurred when the foveal projection zone in area V1 was deafferented as a result of an event in the retina, probably the foveal retinal detachment. This, combined with the deafferentation caused by the macular hole in the right eye (albeit attenuated by some “filling in” process), led to an increase in excitability of the cells in this region and to an increase in spontaneous activity—and this is the basis for the hallucinations. As time progressed these cells became reactivated through ectopic receptive fields situated in normal retina outside the retinal lesion. This produced distortions of perception such as bending of lines in the Amsler chart.69 The hallucinations decreased as the distortions increased and disappeared when the reactivation of the cortical cells was well established.
The reappearance of hallucinations, especially of the type shown in fig 1A, in very faint form and particularly during the night, may be related to the observation that simple blindfolding can result in visual hallucinations if certain non-visual tasks have to be performed (reviewed by Pascual-Leone and Hamilton70).
As far as I know, hallucinations of the Charles Bonnet type have not previously been reported following macular holes. This may be because they are faint and transitory and restricted to a small area (1–2°); they could easily be ignored or not noticed.
Acknowledgments
I thank the departments of anatomy/histology and physiology of the University of Sydney for providing me with office space and other facilities. I am grateful to B Dreher, A P Hunyor, J W Lance, and W R Levick for reading a previous draft of this paper and for making valuable comments. I am particularly grateful to one referee for helpful remarks and suggestions.
REFERENCES
Footnotes
-
Competing interests: none declared
-
See editorial commentary, page 472
Linked Articles
- Editorial commentary