Article Text

Abstract
Background/aims To assess the effect of partial posterior vitreous detachment (pPVD) on spectral-domain optical coherence tomography (OCT) peripapillary retinal nerve fibre layer thickness (RNFL) measurements.
Methods Spectral-domain OCT RNFL thickness measurements were obtained from 684 consecutive patients who were seen in the Massachusetts Eye and Ear Glaucoma Service. Of these patients, we compared RNFL thickness measurements between 101 eyes of 101 glaucoma suspects who met inclusion criteria (55 eyes with and 46 eyes without pPVD).
Results Among all 684 patients, 253 (37%) had pPVD in at least one eye. Among a subset of 101 eyes of 101 glaucoma suspects, average RNFL thickness was greater in eyes with compared to eyes without pPVD (p=0.02). Measurements were significantly greater in the inferior (p=0.004) and superior quadrants (p=0.008), but not in the nasal (p=0.10) and temporal quadrants (p=0.25). The difference in average RNFL thickness remained significant (p=0.05) even when corrected for expected age-related decline in RNFL thickness.
Conclusion Over a third of patients were found on peripapillary spectral-domain OCT to have a pPVD, which was associated with greater RNFL thickness measurements. Judicious clinical interpretation of this finding on spectral-domain OCT RNFL thickness scans should be factored into the assessment of glaucoma suspects.
- glaucoma
- imaging
- vitreous
This is an open access article distributed in accordance with the Creative Commons Attribution Non Commercial (CC BY-NC 4.0) license, which permits others to distribute, remix, adapt, build upon this work non-commercially, and license their derivative works on different terms, provided the original work is properly cited, appropriate credit is given, any changes made indicated, and the use is non-commercial. See: http://creativecommons.org/licenses/by-nc/4.0/.
Statistics from Altmetric.com
Introduction
Quantitative evaluation of the retinal nerve fibre layer (RNFL) has become an integral part of a comprehensive glaucoma evaluation. Retinal ganglion cell axons form the RNFL, and progressive thinning of the RNFL has been shown to correspond with worsening of visual field defects in patients with glaucoma.1 2 Thinning of the RNFL may be quite substantial (up to 50%) prior to any detectable defects on visual field testing.3 Therefore, the accurate evaluation of RNFL thickness plays an important role in detecting the earliest signs of glaucoma.4 5
Optical coherence tomography (OCT) quantitative imaging analysis of the peripapillary RNFL has become a widely used method for identifying RNFL thinning in vivo in patients with suspected or early-to-moderate stage glaucoma.6–8 Older time-domain OCT technology (Stratus OCT; Carl Zeiss Meditec, Inc, Dublin, California, USA) directly measures RNFL thickness with axial resolutions of approximately 10 um and scan speeds of 400 A-lines per second.9–11 Spectral-domain OCT technology has allowed for even higher-resolution images (eg, near 2 um with experimental machines) and shorter acquisition times (eg, 20 000 to 50 000 A-scans per second in commercial systems and up to 1 million A-scans per second in experimental systems).12–14 Although time-domain and spectral-domain OCT use the same underlying principles for image acquisition, several studies have shown that RNFL thickness values from different machines are not interchangeable.12 13
Spectral-domain OCT enhances our ability to measure the RNFL and assess the vitreoretinal interface15 due to its higher axial resolution, and has provided valuable information regarding vitreomacular traction, epiretinal membranes, and the natural history of posterior vitreous detachments (PVDs).5 15 16 Previously, time-domain OCT studies have shown that peripapillary RNFL thickness measurements are greater in eyes of glaucoma suspects with partial posterior vitreous detachment (pPVD) compared with those without pPVD.17 In this study, we tested the hypothesis that spectral-domain OCT RNFL thickness measurements demonstrate the same phenomenon of greater peripapillary RNFL thickness measurements among eyes in glaucoma suspects with pPVD compared with those without pPVD.
Materials and methods
We performed a retrospective, cross-sectional, case-control study using spectral-domain OCT RNFL thickness scans (software V.4.0, Spectralis OCT, Heidelberg Engineering, Heidelberg, Germany) among 684 consecutive patients seen in the Glaucoma Service at the Massachusetts Eye and Ear (MEE) between February 2009 and November 2010. All study subjects were fully clinically-evaluated by a glaucoma specialist (TCC) and were participants in the prospective Spectral-Domain OCT in Glaucoma (SIG) study. The clinical exam included a thorough history, visual acuity testing, refraction, Goldmann applanation tonometry, slit-lamp biomicroscopy, gonioscopy, ultrasonic pachymetry, dilated ophthalmoscopy, stereo disc photography (Visucam Pro NM; Carl Zeiss Meditec, Inc, Dublin, California, USA), and visual field testing (Swedish Interactive Threshold Algorithm 24–2 test of the Humphrey visual field analyser 750i; Carl Zeiss Meditec, Inc, Dublin, California, USA).
All OCT images were taken by trained ophthalmic photographers after pupillary dilation. Inclusion criteria required a scan demonstrating a clear view of the fundus sufficient to assess for the presence or absence of a partial posterior vitreous detachment within the peripapillary RNFL OCT scan (figure 1), signal strength of 20 or higher (in the case-control portion of the study only), accurate automated detection of RNFL borders by the spectral-domain OCT software algorithm (without manual correction), a continuous scan pattern without missing or blank areas and appropriate centration of the scan circle around the optic disc. Exclusion criteria included patients with congenital anomalies of the anterior chamber, corneal scarring or opacities, high myopia (−6 diopters or more), visual field loss attributable to a non-glaucoma condition or a dilated pupil diameter of less than 2 mm.

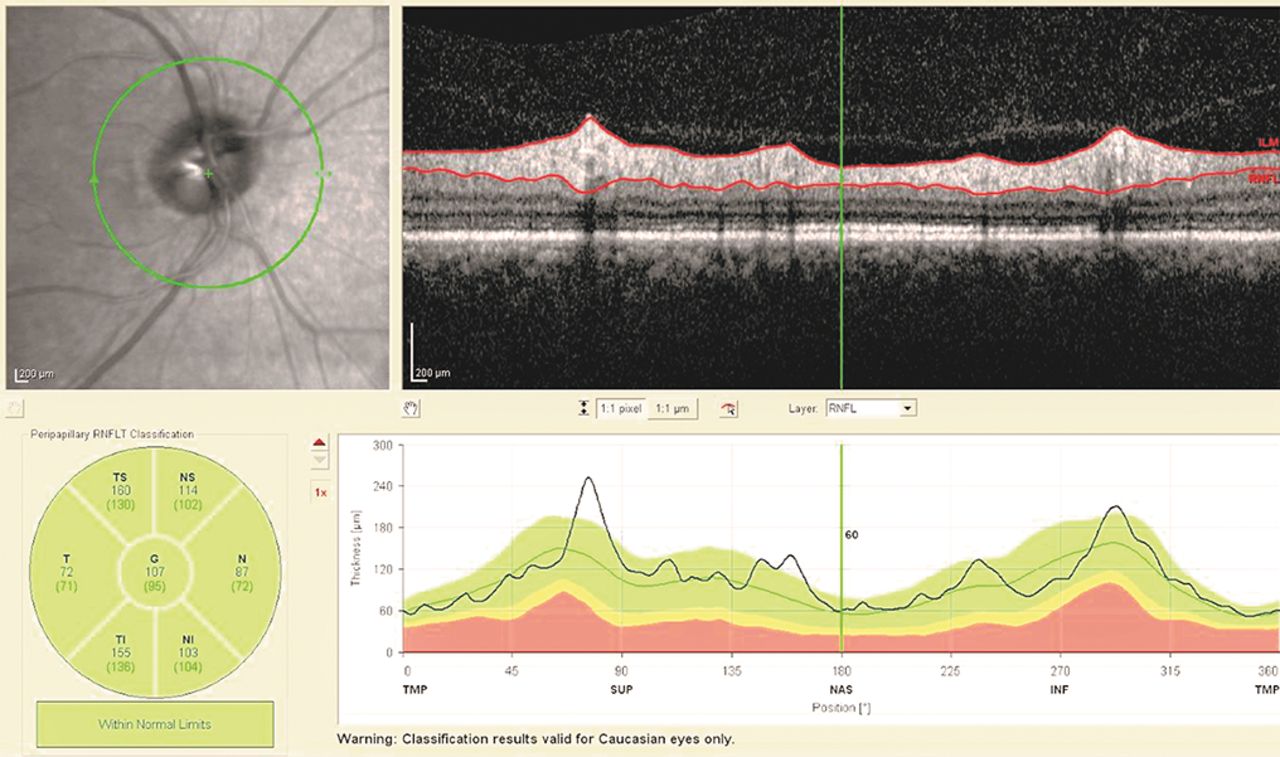
Appearance of partial posterior vitreous detachment on a spectral-domain optical coherence tomography retinal nerve fibre layer thickness scan.
In the case-control portion of our study, we investigated a subset of glaucoma suspects18 (eg, having cup-to-disc asymmetry 0.2 or greater, cup-to-disc ratios of 0.5 or greater, ocular hypertension or a family history of glaucoma). Partial PVD was defined as a visible posterior vitreous face with focal attachments to the retinal surface anywhere along the RNFL scan circle. The control group of patients without pPVD included both those with a completely-attached posterior vitreous face and those with a complete posterior vitreous detachment because current OCT technology does not allow us to clearly distinguish between these two entities.16 19 This is due in part to the anterior shift of the posterior hyaloid face outside the viewable range of the OCT scan, which can commonly occur in cases of complete PVD.
Patients were excluded from the study if they had a clinical history of any form of glaucoma or if they had characteristic glaucomatous optic nerve changes with corresponding abnormal visual field defects. Patients were also excluded if they had retinal vascular occlusive disease, active macular oedema or advanced retinal degeneration. The visual field was considered abnormal if three or more contiguous test locations in the pattern deviation plot were depressed significantly at the p<0.05 level with at least one point at the p<0.01 level on the same side of the horizontal meridian and if the visual field defect corresponded to the optic nerve appearance. If both eyes were eligible for the study, only the right eye was included in the analysis since data from the right and left eyes of the same patient are correlated and our statistical tests assumed independent observations.20
All statistical analyses were performed using a two-tailed Student's t-test using Microsoft Excel statistical software (Microsoft Corporation, Redmond, Washington).
Results
Among all 684 consecutive patients imaged at the MEE Glaucoma Service between February 2009 and November 2010, 253 patients (37%) were found to have pPVD on spectral-domain OCT. Among glaucoma suspects, 67 were initially identified from each of two groups: (1) those with pPVD in one or both eyes and (2) those without pPVD. Twelve patients from the pPVD group and 16 patients from the without pPVD group were excluded due to inadequate signal strength (less than 20). In addition, five patients from the control group were excluded due to myopia of −6 diopters or more. There were 35 patients in the pPVD group in whom both eyes were eligible for inclusion. In these cases, only the right eye was included in the statistical analysis. Among glaucoma suspects who met all study inclusion criteria, we found no significant differences in the demographics of those with pPVD (n=55) and those without pPVD (controls, n=46) (table 1).
Demographics of glaucoma suspects with and without partial posterior vitreous detachments
Average peripapillary RNFL thickness was significantly thicker in eyes with pPVD compared with those without pPVD using spectral-domain OCT (p=0.02) (table 2).
Retinal nerve fibre layer measurements in glaucoma suspects with and without partial posterior vitreous detachments
The inferior and superior quadrants of the RNFL were each also significantly thicker in eyes with pPVD compared with those without pPVD (p=0.004 and p=0.008, respectively). There were no significant differences between the groups with respect to the nasal and temporal quadrants of the RNFL (p=0.10 and p=0.25, respectively). While the group with pPVD was slightly, but not significantly, younger than controls (53.6±11.3 vs 58.6±21.5 years, p=0.16), the difference in average RNFL thickness remained significant (p=0.05) when corrected for using previously-published data for expected average RNFL thinning due to normal ageing (ie, 2 um per decade).21
Discussion
Our study found that over a third of patients in an academic glaucoma clinic have a pPVD in at least one eye on spectral-domain OCT RNFL thickness scans, and that thicker RNFL thickness measurements were associated with eyes in glaucoma suspects with pPVD compared with those without pPVD (table 2). Therefore, when evaluating glaucoma suspects, clinicians should identify whether pPVDs are present on spectral-domain OCT RNFL thickness scans, which are the most commonly used OCT scans for evaluating glaucoma.22 Our findings using peripapillary spectral-domain OCT agree with prior studies that found pPVD to be a common clinical finding on spectral-domain OCT imaging of the macula.16 23 In addition, we found a similar frequency of pPVD (37%) compared with that found in a study by Batta et al (40%) of peripapillary RNFL thickness measurements among glaucoma suspects using time-domain OCT.17 Although pPVD is believed to be a common feature on peripapillary spectral-domain OCT RNFL thickness scans, its exact frequency in spectral-domain OCT scans has not been previously quantified until this study.24 In both our study and the prior time-domain OCT study by Batta et al, the superior and inferior RNFL measurements were found to be significantly thicker in eyes with pPVD compared with those without pPVD, while the nasal and temporal RNFL measurements demonstrated no difference in thickness.17
The most likely mechanism for the increased RNFL thickness found in eyes with pPVD is the transmission of vitreous tractional forces on the internal limiting membrane.24 The characteristic elevation or ‘tenting’ of the RNFL seen with OCT at points of posterior vitreous attachments to the retina makes vitreoretinal traction a likely explanation. Such traction is thought to be the mechanism for the foveal thickening seen on OCT imaging of patients with vitreomacular traction.15 In addition, vitreopapillary traction syndrome, in which tractional forces from vitreous attachments to the optic disc are believed to cause disc swelling and gaze-evoked amaurosis, may represent another example of the considerable forces that can be exerted on the retina by vitreous traction.25 26 While incorrect automated segmentation of the RNFL may also result in software erroneously overestimating the RNFL thickness,24 we carefully reviewed all scans to ensure that only those with correct segmentation were included in the analysis, and we did not include participants with peripapillary retinoschisis, a rare finding that has been found to be associated with vitreous traction in some studies, but not others.27 28
It may be that there are increased tractional forces applied to the superior and inferior aspects of the peripapillary region relative to the temporal and nasal aspects. A study of the stages of posterior vitreous detachment by Uchino et al showed that there is a predilection for persistent attachment of the vitreous to the superior quadrant of the retina.16 It is also notable that the peripapillary region represents one of the last remaining points of vitreous attachment in pPVD.16 29 A recent study examined the change in peripapillary RNFL thickness before and after vitrectomy for epiretinal membrane and found a decline in average RNFL thickness and a decline in more quadrants of the RNFL following surgery in the group with an attached vitreous (requiring surgical induction of PVD) compared with the group with a complete preoperative PVD.30 In addition, Asrani et al reported a case describing artefactual ‘thinning’ of the peripapillary special-domain OCT RNFL measurement following the progression from partial to complete PVD, which was attributed to the release of tractional forces.24 These reports provide further evidence that vitreous traction is the likely cause of greater peripapillary RNFL OCT measurements in glaucoma suspects with pPVD.
It would be of interest to follow the glaucoma suspects in our study over time to ascertain whether the RNFL thickness decreases following progression of the pPVD to a complete PVD. If observed, this would be an important confounding factor for clinicians to be aware of in order to avoid incorrectly interpreting the decrease in RNFL thickness following the progression from pPVD to complete PVD as a sign of glaucomatous changes to the optic nerve. However, the observed progression from pPVD to complete PVD occurs infrequently over many years (9.7%, average 30.0 months, range: 2 to 237 months in an observational case series).23 Thus, the low frequency and slow pace of pPVD progression to complete PVD would require a much larger longitudinal cohort followed for several years to quantify the decrease in RNFL thickness on spectral-domain OCT.
A limitation of the prior time-domain OCT study by Batta et al was that the pPVD group in their study was significantly younger than their control group without pPVD, and therefore the two groups may not have been directly comparable.17 A strength of our study was that there was no significant difference in demographics between our two comparator groups (table 1). Furthermore, when we adjusted for the non-significant age difference between our two groups based on the expected decline in RNFL thickness with normal ageing, we still found that eyes with pPVD had a significantly thicker RNFL compared with those without pPVD (p=0.05). In addition, while participants in the study by Batta et al were primarily black and Hispanic, the self-reported ethnic background of participants in our study was similar to that of the overall US population based on 2018 US Census Bureau estimates.31
Some limitations of our study include that it was a cross-sectional study examining the association, rather than causality, between pPVD and RNFL thickness measurements. All imaging was performed with the Spectralis OCT system, and it is possible that our results may not be generalisable to other spectral-domain OCT systems.32 In addition, the majority of patients in our study were women, which is consistent with epidemiological studies suggesting that glaucoma disproportionately affects women.33 Our reported prevalence of pPVDs among all consecutive patients who underwent spectral-domain OCT imaging may have been higher if we excluded patients with low signal strengths (as was done in the case-control portion of the study). Finally, some patients who had no pPVD on their peripapillary RNFL OCT scan may have had a pPVD on their macular scans. However, our study was not designed to evaluate the effect of pPVD versus no pPVD on macular measurements, but was instead focussed on peripapillary RNFL thickness scans where local tractional forces are most likely to account for the difference in the thickness measurement.
In summary, we found that pPVD was present in over a third of patients who obtained peripapillary spectral-domain OCT RNFL thickness scans in an academic glaucoma clinic. We also found that among glaucoma suspects, average, superior and inferior peripapillary RNFL measurements are significantly greater in eyes with pPVD compared with those without pPVD. Therefore, pPVD should be considered among the known limitations and artefacts of OCT RNFL imaging.34 Judicious clinical interpretation of this finding on spectral-domain OCT RNFL thickness scans should be factored into the assessment of glaucoma suspects.
References
Footnotes
Contributors Design and conduct of the study (YL, TCC); collection, management, analysis and interpretation of the data (YL, NB, KR, TCC) and preparation, review or approval of the manuscript (YL, NB, KR, TCC).
Funding This study was supported in part by institutional grants from Research to Prevent Blindness to the University of Wisconsin Department of Ophthalmology and Visual Sciences and the Massachusetts Eye and Ear. Dr Liu is also supported in part by NIH/NEI K23 EY026518. Dr Chen is also supported in part by National Institutes of Health UL1 RR 025758, Massachusetts Lions Eye Research Fund (New Bedford, Massachusetts), American Glaucoma Society Mid-Career Award (San Francisco, California), and Fidelity Charitable Fund (Harvard University), and Department of Defense Small Business Innovation Research DHP15-016.
Competing interests None declared.
Patient consent for publication Not required.
Ethics approval This research study was approved by the Massachusetts Eye and Ear Institutional Review Board and was in compliance with HIPAA regulations. All study activities were conducted in accordance with the Declaration of Helsinki and all federal or state laws.
Provenance and peer review Not commissioned; externally peer reviewed.
Data availability statement Data are available upon request. Deidentified participant data are available upon reasonable request from the corresponding author (yao.liu2@wisc.edu) to those who obtain approval from the Massachusetts Eye and Ear Institutional Review Board.