Article Text

Abstract
Background/Aim To assess visual acuity (VA) outcomes and antivascular endothelial growth factor (anti-VEGF) treatment intensity in diabetic macular oedema (DMO).
Methods Retrospective analysis was performed in treatment-naïve patients with DMO from 2013 to 2018 using a database of aggregated de-identified electronic medical records (Vestrum Health).
Results At 1 year, 28 658 patient eyes underwent a mean of 6.4 anti-VEGF injections, gaining a mean of +4.2 letters (95% confidence interval for mean gain: +4.0 to +4.5 letters, p<0.001). When stratified by anti-VEGF medication and by years 2013–2018, no clinically meaningful differences in injection frequency or 1-year VA change resulted. At 1 year, 50% of eyes received ≤6 injections, while <20% received 10–13 injections, representing monthly treatment. Mean letters gained at 1 year generally showed a linear relationship with mean number of anti-VEGF injections, beyond two injections. Eyes with good baseline VA (≥20/40) generally were at risk of VA loss at 1 year; those with moderately severe baseline impairment (20/70 to 20/200) who received ≥10 injections improved by a mean of +10.3 letters.
Conclusion In clinical practice, patients with DMO undergo fewer anti-VEGF injections and exhibit worse visual gains compared with patients in randomised clinical trials. Visual outcomes correlate with treatment intensity at 1 year, with ceiling effects related to baseline VA.
- treatment medical
- retina
- macula
This is an open access article distributed in accordance with the Creative Commons Attribution Non Commercial (CC BY-NC 4.0) license, which permits others to distribute, remix, adapt, build upon this work non-commercially, and license their derivative works on different terms, provided the original work is properly cited, appropriate credit is given, any changes made indicated, and the use is non-commercial. See: http://creativecommons.org/licenses/by-nc/4.0/.
Statistics from Altmetric.com
Diabetic retinopathy and diabetic macular oedema (DMO) assume the leading causes of blindness in working-age individuals in most developed countries.1 In the USA, 96% of retina specialists consider antivascular endothelial growth factor (anti-VEGF) medications as initial treatment of choice for new-onset DMO, with only 1.2% and 0.8% opting for focal laser or dexamethasone implant, respectively.2 In two registration trials for aflibercept (Eylea, Regeneron Pharmaceuticals), monthly loading followed by bimonthly dosing yielded a mean gain in best corrected visual acuity (BCVA) of +10.7 ETDRS letters at 1 year.3 In two registration trials for ranibizumab (Lucentis, Genentech), monthly dosing yielded mean BCVA gains of +12.5 and +10.9 ETDRS letters at 1 year.4 In the Diabetic Retinopathy Clinical Research Network (DRCR.net) comparative effectiveness trial (Protocol T), three anti-VEGF medications, dosed according to a protocol-specific algorithm, demonstrated clinically similar mean gains in BCVA at 1 and 2 years (+13.3, +9.7 and +11.2 ETDRS letters at 1 year, and +12.8, +10.0 and +12.3 ETDRS letters at 2 years, respectively, for aflibercept, off-label bevacizumab (Avastin, Genentech) and ranibizumab).5 6
Given the gradual evolution towards value-based medicine, real-world outcomes assume progressively greater importance. With DMO, for example, the Centers for Medicare and Medicaid Services already considers 1-year visual acuity (VA) loss among their quality measures within the Merit-Based Incentive Payment System. This quality measure assumes very specific real-world outcome parameters, assessing the percentage of patients with DMO with 1-year loss of <0.3 Snellen lines,7 and could portend increasing accountability for even more stringent outcome measures.
Previous small real-world studies have demonstrated that patients with DMO receive as few as three to seven treatments in the first year, with consistently suboptimal visual outcomes.8–13 In our prior study with a 1-year cohort of 5840 DMO patient eyes, the mean VA change measured +5.2 letters after a mean of 7.8 anti-VEGF injections, 0.2 focal laser treatments and 0.1 corticosteroid injections.14 In addition, this prior study assessed loss to follow-up, with mutually exclusive cohorts who did not show in the electronic medical record after 6 or 12 months, and noted similar visual outcomes compared with patients treated for 24 months.14 In the present study, using the same database, we sought to explicitly assess treatment intensity and its relationship with visual outcomes, by eliminating the inclusion criterion of three initial anti-VEGF ‘loading’ injections and meaningfully increasing sample size (beyond, but not exclusive of, the prior study population) to facilitate stratification by injection frequency.
Methods
Database
The database and its utilisation in prior studies have been described previously.14–16 Briefly, it includes de-identified information from nearly 1.5 million unique patients and over 11 million encounters, from a panel of 350 US retina specialists, with 65%, 32% and 3% located in urban, suburban and rural settings, respectively (Vestrum Health Retina Database, Naperville, Illinois). They are geographically diversified in the Mid-Atlantic (24%), Southeast (24%), West (20%), Southwest (12%), Northeast (8%), Great Lakes (7%) and North Central (4%) regions. Aggregated data include inoffice and outpatient medications, examination findings, diagnostic test interpretations, ocular and systemic diagnoses, treatments, outcomes, and adverse events. A proprietary de-identification process replaces patient identifiers with an alphanumeric code. The system refreshes the database on a weekly basis. An ETDRS approximation formula from Gregori et al,17 85+50×log (Snellen fraction), calculates the VA score.
Study design and dates, inclusion and exclusion criteria
This study retrospectively analysed 1-year VA outcomes and relationships with anti-VEGF treatment intensity in treatment-naïve US patients with DMO between 2013 and 2018. This study included treatment-naïve patients with DMO who received anti-VEGF injections between January 2013 and July 2018, if they underwent at least one anti-VEGF injection and had follow-up data through 1 year (within months 11–12). This study excluded patients with other retinal diagnoses. Gender, age, VA and anti-VEGF medications were extracted from the database.
Analysis
Analysis methodology was similar to that in prior studies.14–16 Outcome measures were assessed at the patient eye level. As a sensitivity analysis, the main outcome measure was also analysed excluding patients with DMO who received bilateral treatment during the study period. The study assessed baseline features with descriptive statistics, including mean values for age, baseline VA (letters) and number of injections. These baseline features were also stratified by initial anti-VEGF medication.
As a main outcome measure, the study assessed mean 1-year VA change from baseline with 95% confidence intervals (CIs) and nominal p values, using paired t-tests. Mean 1-year VA change was calculated for all eligible patients and stratified by initial anti-VEGF medication. As a sensitivity analysis, these data were also assessed excluding those patients who switched from initial therapy.
As additional outcome measures, the study assessed relationships between 1-year injection frequency and baseline features. Injection frequency over 1 year was plotted on a histogram to assess distribution, between 1 and 13. A small number of eyes (32 or 0.11%) of the total 28 658 underwent >13 injections in 1 year, but were not assigned their own injection cohort due to the small subsample size, and were not included in further subgroup analyses. The study assessed for baseline VA and age relationships with 1-year injection frequency, through stratification by injection frequency.
The study also assessed visual outcomes stratified by injection frequency and baseline VA. Specifically, mean 1-year VA change from baseline, with 95% CIs and nominal p values using paired t-tests, was stratified by injection frequency and baseline VA.
The study assessed yearly trends in baseline VA, mean number of injections and mean 1-year VA change, stratified by initial anti-VEGF medication. Trends in utilisation among aflibercept, bevacizumab and ranibizumab from 2013 to 2018 were also assessed.
Results
Patient demographics
Based on eligibility criteria, this study included 28 658 patient eyes. Table 1 summarises the baseline demographics. At initial presentation, the mean age measured 62.1 years and the mean baseline VA measured 59.2 letters (20/60 Snellen equivalent). Initial anti-VEGF medications were distributed as follows: 23% aflibercept (6459 eyes), 24% ranibizumab (6926 eyes) and 53% bevacizumab (15 273 eyes); mean age, gender and mean baseline VA were balanced within these groups.
Baseline features and results
Mean 1-year change in VA
Table 1 also summarises the mean 1-year VA change. For the entire group, patients presented with a mean baseline VA of 59.2 letters (20/60 Snellen equivalent), underwent a mean of 6.4 anti-VEGF injections and improved by +4.2 letters at 1 year (95% CI for mean VA change: +4.0 to +4.5 letters, p<0.001). Sensitivity analysis, excluding patients with DMO who received bilateral treatment during the 6-year study period, yielded very similar 1-year outcomes. Specifically, 15 200 unilaterally treated patients presented with a mean baseline VA of 59.1 letters (20/60 Snellen equivalent), underwent a mean of 6.0 injections and improved by a mean of +3.9 letters at 1 year.
Stratified by anti-VEGF medication, there were no clinically meaningful differences in the mean number of injections or mean VA changes at 1 year, as summarised in table 1. Of 6459 patient eyes initially treated with aflibercept, VA improved by +4.3 letters (95% CI for mean VA change: +3.9 to +4.8 letters, p<0.001), with similar outcomes for bevacizumab (15 273 eyes, +4.5 letters, 95% CI for mean VA change: +4.2 to +4.9 letters, p<0.001) and for ranibizumab (6926 eyes, +3.4 letters, 95% CI for mean VA change: +3.0 to +3.9 letters, p<0.001). The ranibizumab group showed slightly better mean baseline VA (61.0 letters) compared with the aflibercept and bevacizumab groups (60.3 and 57.9 letters, respectively), which could have potentially confounded visual change outcomes in favour of the latter medications. Sensitivity analysis, excluding those patients who switched from initial therapy, yielded nearly identical mean 1-year VA change. Specifically, of 5467 patient eyes treated with a mean of 6.1 aflibercept-only injections, VA improved by a mean of +4.2 letters, with similar outcomes for bevacizumab only (10 181 eyes, 5.4 injections, +4.4 letters) and for ranibizumab only (5130 eyes, 6.3 injections, +3.4 letters). In this cohort, as noted in the initial overall cohort, the ranibizumab-only group showed slightly greater mean baseline VA (61.5 letters) compared with the aflibercept-only and bevacizumab-only groups (60.9 and 57.5 letters, respectively), which could have potentially confounded visual change outcomes in favour of the latter medications.
One-year anti-VEGF injection frequency and baseline features
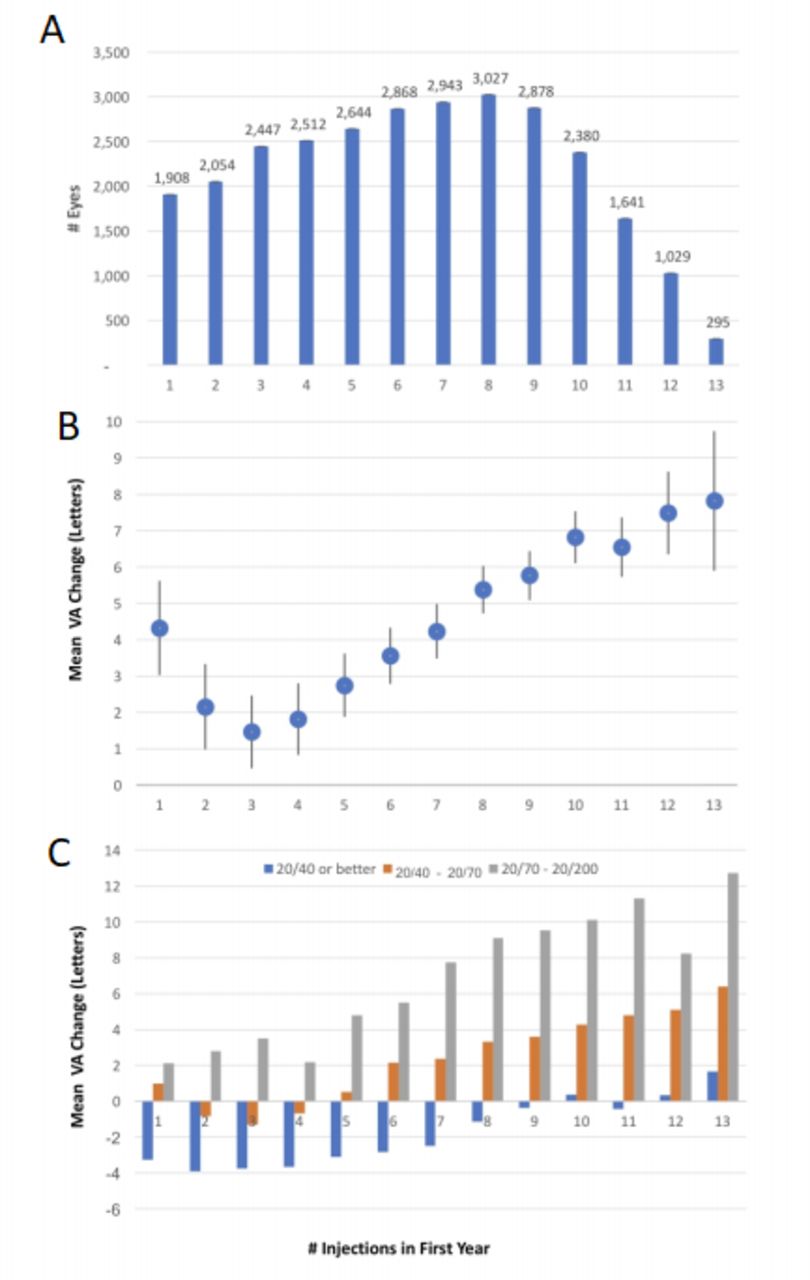
Overall, patient eyes underwent a mean of 6.4 and a median of 6.0 injections over 1 year. The histogram in figure 1A shows the distribution of eyes stratified by the number of injections in 1 year, between 1 and 13. The distribution of injections/eye in the first year of treatment skewed towards the lower range. For example, 50% of patient eyes received ≤6 injections, while <20% of patient eyes received 10–13 injections, representing monthly treatment.
(A) Histogram showing the distribution of diabetic macular oedema (DMO) patient eyes stratified by number of antivascular endothelial growth factor (anti-VEGF) injections received in the first year of treatment. The median number of injections/eye in the first year of treatment was 6. The distribution is skewed towards the lower range, with 50% of patient eyes receiving ≤6 injections and <20% of patient eyes receiving 10–13 injections, representing monthly treatment. (B) Graph showing change in visual acuity (VA) versus anti-VEGF injections administered to all DMO patient eyes in the first year of treatment. The 95% CIs are included. At 1 year, mean letters gained showed a linear relationship with number of anti-VEGF injections, beyond 2 injections. (C) Graph showing the mean VA change over 1 year, stratified by both anti-VEGF injection frequency and baseline VA. Mean 1-year VA change tended to increase in patient eyes with both increased anti-VEGF injection frequency and decreased baseline VA. There were ceiling effects related to baseline VA. Patient eyes with baseline VA of 20/40 or better generally were at risk of VA loss at 1 year, except for those who received ≥10 injections. However, these patient eyes also showed better final VA compared with those starting with worse baseline VA.
The mean number of anti-VEGF injections over 1 year did not correlate with baseline VA or baseline age. Table 2 depicts these baseline features stratified by the number of anti-VEGF injections over 1 year, from 1 to 13 injections. The mean baseline VA was similar among these injection groups, between 58.7 and 59.9 letters (20/60 Snellen equivalent), except for those patient eyes that received one injection over 1 year (56.1 letters, 20/70 Snellen equivalent). Likewise, the mean baseline age was similar among these groups, between 61.0 and 62.9 years.
Mean 1-year changes in VA, stratified by antivascular endothelial growth factor injection frequency
Visual outcomes stratified by anti-VEGF injection frequency and baseline VA
When stratified by anti-VEGF injection frequency, final VA at 1 year increased with increasing injection frequency on average, as noted in table 2. In addition, the mean 1-year VA change generally showed a linear relationship with the number of anti-VEGF injections, beyond two injections, as shown in table 2 and figure 1B. For example, in 2447, 2868, 2878 and 1029 patient eyes which underwent a mean of 3, 6, 9 and 12 injections, the mean VA improved at 1 year by +1.5, +3.6, +5.8 and +7.5 letters, respectively. At the lower range, those patient eyes that underwent ≤5 injections in 1 year generally improved minimally, gaining <3 letters at 1 year. The one exception to this generalisation were those patient eyes that received one injection in the first year of treatment, as they improved by +4.3 letters, but showed the worse mean baseline VA (56.1 letters, 20/70 Snellen equivalent) compared with all others (between 58.7 and 59.9 letters, 20/60 Snellen equivalent), which could potentially confound relative assessment of visual outcomes.
When stratified by baseline VA, visual outcomes demonstrated ceiling effects, as shown in table 1. Specifically, when stratified by baseline VA of 20/200 or worse (2469 eyes), 20/70 to 20/200 (5939 eyes), 20/40 to 20/70 (9633 eyes), and 20/40 or better (10 585 eyes), the VA changed at 1 year by +34.2, +6.7, +2.0 and −2.2 letters, respectively, despite similar mean number of injections. Table 1 also demonstrates that, despite greater 1-year improvement with worse baseline VA, the final 1-year VA remained in the same strata as the baseline VA. For example, although patient eyes with baseline VA of 20/40 or better generally were at risk of VA loss at 1 year, they also showed better VA at 1 year compared with those with worse baseline VA.
When stratified by both anti-VEGF injection frequency and baseline VA, these trends persisted, as shown in figure 1C. In general, the mean 1-year VA change increased with both increased anti-VEGF injection frequency and decreased baseline VA. For example, those patient eyes with baseline VA of 20/40 or better were at risk of VA loss at 1 year as noted above, except for those 1786 patient eyes who received ≥10 injections, yielding a small mean improvement of +0.2 letters (from a mean baseline VA of 75.0 letters). In contrast, those 1190 patient eyes with moderately severe VA loss at presentation (baseline VA between 20/70 and 20/200) who received ≥10 injections improved by a mean of +10.3 letters (from a mean baseline VA of 47.2 letters).
Yearly trends over 6 years: baseline VA, mean number of 1-year anti-VEGF injections, mean 1-year change in VA and anti-VEGF utilisation
Yearly trends were assessed overall and stratified by initial anti-VEGF medication. Over the 6-year period, for all three anti-VEGF medications, baseline VA generally measured between 58 and 62 letters (20/60 Snellen equivalent), the mean number of first-year injections generally remained between 6 and 7, and VA generally improved between +3 and +5 letters.
Trends in utilisation among aflibercept, bevacizumab and ranibizumab were also assessed. Aflibercept received approval for the treatment of DMO in 2014, after which its utilisation rose rapidly, ultimately to 22% in 2018, while ranibizumab use declined over the study period from 54% in 2013 to 22% in 2018. Bevacizumab use held steady from 2013 to 2018, approximating half of all anti-VEGF utilisation each year throughout the study period.
Discussion
The limitations of this real-world study include its retrospective design, non-standardised VA assessment and non-standardised diagnostic criteria for DMO. These limitations could partially account for differences between real-world studies and randomised controlled trials (RCTs), which include rigorous standards for BCVA testing and strict diagnostic eligibility criteria. The strengths of this study include its large cohort size which facilitated stratification to further assess injection frequency and baseline VA . Importantly, this study corroborates and expands on prior smaller real-world studies,8–14 all of which yield relevant insights on unmet need, as the healthcare system shifts to value-based approaches with increasing accountability for clinical practice outcomes. Specifically, in clinical practice, patients with DMO in the USA undergo fewer anti-VEGF injections and exhibit worse 1-year visual gains compared with patients in RCTs. In addition, visual outcomes correlate with treatment intensity at 1 year, with ceiling effects related to baseline VA. For example, DMO patient eyes with relatively good baseline VA (better than 20/40) generally are at risk of VA loss at 1 year, except those which received ≥10 injections. In contrast, DMO patient eyes with moderately severe baseline impairment (20/70 to 20/200) who receive 10–13 anti-VEGF injections in 1 year reassuringly show VA improvements that somewhat compare with RCTs. Finally, when stratified by anti-VEGF medication and by years 2013–2018, no clinically meaningful differences in injection frequency or 1-year VA change result.
Real-world patients with DMO undergo fewer anti-VEGF injections and exhibit worse 1-year VA gains compared with RCTs, regardless of anti-VEGF medication
In clinical practice, patients with DMO undergo fewer anti-VEGF injections on average, compared with patients in RCTs, as demonstrated in the present study and in prior smaller real-world studies.8–14 This observation may highlight unmet needs with respect to treatment burden associated with current medications. Specifically, ranibizumab registration trials employed monthly treatment,4 aflibercept registration trials employed bimonthly treatment after 5 monthly treatments,3 and DRCR.net Protocol T employed a protocol-specific algorithm, with 9.2, 9.7 and 9.4 injections of aflibercept, bevacizumab and ranibizumab, respectively, at 1 year.6 In this real-world analysis, the comparatively lower treatment intensity of 6.3, 6.3 and 6.7 injections of aflibercept, bevacizumab and ranibizumab, respectively, at 1 year suggests that physicians are employing as-needed or treat-and-extend dosing regimens that aim to decrease treatment burden for patients with DMO. The overall distribution of injections/eye, as shown in figure 1A, further supports this supposition, as it is skewed towards the lower range, with 50% of patient eyes receiving ≤6 injections and <20% of patient eyes receiving 10–13 injections, representing monthly treatment. Importantly, age or baseline VA did not affect treatment frequency decisions, as those who underwent ≤6 injections at 1 year generally did not differ from the overall group with respect to these features. Consequently, undertreatment likely partially accounts for worse visual outcomes in real-world patients with DMO, in addition to more diverse patient presentations and advanced disease states not typically eligible for RCTs.
Furthermore, the real-world DMO treatment outcomes are meaningfully worse than those from RCTs in general. In this real-world analysis, VA improved by a mean of +4.3, +4.5 and +3.4 letters at 1 year for eyes initiated on aflibercept, bevacizumab and ranibizumab, respectively. In contrast, in the DRCR.net Protocol T trial, VA improved by a mean of +13.3, +9.7 and+11.2 at 1 year for eyes treated with aflibercept, bevacizumab and ranibizumab, respectively.6 Although cross-study comparisons are flawed, VA gains in DRCR.net Protocol T differ from the present real-world analysis by greater than one line of vision at 1 year. Prior smaller real-world studies yielded similar results, with patients with DMO receiving as few as three to seven injections in 1 year8–12 and experiencing mean 1-year VA gains of approximately +5 letters.8 10 14 For example, in one real-world study using Geisinger Health System data, 121 treatment-naïve DMO patient eyes underwent 3.1 anti-VEGF injections, gaining +4.7 letters on average at 1 year.10 In another real-world study from 10 sites, 156 treatment-naïve DMO patient eyes underwent 5.8 anti-VEGF injections at 1 year, gaining +5.5 letters on average.8 In one particularly relevant ‘real world’ study using the database of the American Academy of Ophthalmology IRIS Registry (Intelligent Research in Sight), 2086 patients who first received anti-VEGF therapy within 28 days of diagnosis underwent a median number of four injections in the first year.13 As noted previously, in a 1-year cohort of 5840 treatment-naïve DMO patient eyes, our prior study showed a mean improvement of +5.2 letters,14 slightly better than the current study, which showed lower treatment intensity after eliminating three ‘loading’ injections for eligibility.
Visual outcomes correlate with treatment intensity at 1 year, with ceiling effects related to baseline VA
Stratification by injection frequency and baseline VA, facilitated by the present study’s larger size, also enabled further assessment of treatment intensity and its relationship with visual outcomes. With increasing injection frequency, final VA at 1 year increased on average. In addition, at 1 year, mean letters gained generally showed a linear relationship with mean number of anti-VEGF injections, beyond two injections. Patient eyes that received ≤5 injections in 1 year (40% of the entire sample) improved minimally, generally gaining <3 letters at 1 year. Similarly, the previously described ‘real world’ IRIS registry study noted that, among those patients who received anti-VEGF therapy within 28 days of diagnosis, increased treatment intensity was associated with greater visual gain at 1 year; 664 patient eyes receiving ≤5 injections gained +3 letters on average, while 389 patient eyes receiving ≥6 injections gained +5.5 letters on average.13 Given the ≤9 day half-life of current anti-VEGF medications,18–22 these results are not unexpected, as fewer treatments would only intermittently suppress VEGF, which may be chronically upregulated in DMO. In addition, these results highlight the need for longer acting DMO therapies to address treatment burden associated with current anti-VEGF medications.
In this study, patient eyes with relatively good baseline VA tended to be vulnerable to vision loss. As expected, a ceiling effect can limit improvement in eyes with relatively good baseline VA; these same eyes have a relatively higher chance of vision loss. Specifically, those with baseline VA of 20/40 or better generally were at risk of VA loss (−2.2 letters) at 1 year, except those who received ≥10 injections and improved slightly. In contrast, when DMO patient eyes with moderately severe baseline impairment (20/70 to 20/200) receive 10–13 anti-VEGF injections in 1 year, the mean VA improved by +10.3 letters. While this result highlights treatment burden, it also reassuringly compares somewhat with RCTs, demonstrating meaningful improvement in this subgroup with moderately severe baseline impairment, using current anti-VEGF medications. As expected, DMO patient eyes with worse baseline VA showed even greater mean 1-year VA gain.
No clinically meaningful differences in yearly injections or VA change over the years 2013–2018
Overall and stratified by anti-VEGF medication, there were no clinically meaningful differences in first-year injections or VA change over the years 2013–2018. Over the 6-year study period, for all three anti-VEGF medications, presenting VA generally measured between 58 and 62 letters (20/60 Snellen equivalent), the mean number of first-year injections generally remained between 6 and 7, and VA generally improved between +3 and +5 letters. Bevacizumab approximated half of all anti-VEGF utilisations each year from 2013 to 2018, possibly due to socioeconomic factors, given its lower cost.
Conclusion
In summary, patients with DMO in the USA undergo fewer anti-VEGF injections and exhibit worse 1-year VA gains compared with patients in RCTs. When stratified by anti-VEGF medication and years 2013–2018, no clinically meaningful differences in injections or 1-year VA change resulted. Fewer than 20% of patient eyes received 10–13 injections, representing monthly treatment, while 50% received ≤6 injections at 1 year. The mean 1-year VA change tended to increase in patient eyes with both increased anti-VEGF injection frequency and decreased baseline VA, although there were ceiling effects related to baseline VA. Also, this study demonstrates that real-world DMO patient eyes with relatively good baseline VA (better than 20/40) generally are at risk of VA loss at 1 year, except those which received ≥10 injections. In contrast, DMO patient eyes with moderately severe baseline impairment (20/70 to 20/200) who receive 10–13 anti-VEGF injections in 1 year show VA improvements that somewhat compare with RCTs. As the healthcare system shifts to value-based approaches, real-world outcomes assume greater importance; these results highlight the necessity for patient counselling on treatment frequency with current anti-VEGF therapy and also highlight the unmet need for longer duration therapies that can address treatment burden.
References
Footnotes
Twitter @ThomasCiullaMD
Funding The authors have not declared a specific grant for this research from any funding agency in the public, commercial or not-for-profit sectors.
Competing interests JFP and DFW are co-founders of Vestrum Health.
Patient consent for publication Not required.
Ethics approval The Indiana University Institutional Review Board exempted this study from review because it only involved assessment of existing de-identified data.
Provenance and peer review Not commissioned; externally peer reviewed.
Data availability statement Data are available upon reasonable request.
Linked Articles
- At a glance