Article Text

Abstract
Background/aims To determine the changes in the incidence of diabetic retinopathy (DR), diabetic macular oedema (DMO) and their risk factors in a population-based study of patients with diabetes mellitus (DM) referred to our 16 Primary Health Care Areas (HCAs).
Methods Prospective population-based study of a total of 15 396 Caucasian patients with DM, who represent 86.53% of the total patients with DM in our HCAs, were studied over an 8-year follow-up period. All patients were screened with a mean follow-up of 3.18±1.11 times for each patient over the 8 years.
Results The yearly mean value of any DR was 8.37±2.19% (8.09%–8.99%); of advanced DR yearly mean value of 0.46±0.22% (0.03–0.78); and of DMO a yearly mean value of 2.19±0.18% (2%–2.49%). A clear increase was observed in the last 3 years, any DR increased from 8.09% in 2007 to 8.99% in 2014, and DMO from 2% in 2007 to 2.49% in 2014. These increases were more evident in some age groups. For patients with any DR aged 41–50 and 51–60 and for patients with advanced DR aged 41–50, 51–60 and 61–70, the increase was more marked, related to an increase in HbA1c values or to patients treated with insulin.
Conclusions An increase in the incidence of DR and DMO was observed, especially in the younger patients aged between 31 and 70 years. This is linked to bad metabolic control of DM. Our results suggest a greater number of ocular complications in the near future, such as neovascular glaucoma, if these current findings are not addressed.
- Epidemiology
- Retina
- Telemedicine
- Macula
- Public health
This is an Open Access article distributed in accordance with the Creative Commons Attribution Non Commercial (CC BY-NC 4.0) license, which permits others to distribute, remix, adapt, build upon this work non-commercially, and license their derivative works on different terms, provided the original work is properly cited and the use is non-commercial. See: http://creativecommons.org/licenses/by-nc/4.0/
Statistics from Altmetric.com
Introduction
Currently, more than 200 million patients are estimated to have diabetes, and the number is predicted to rise by over 120% worldwide by 2025,1 and in Spain by 11.1% by 2030, to as many as 3.886 million inhabitants.2 Diabetes mellitus (DM) has become a chronic disease with several complications.3 The most important ocular complication is diabetic retinopathy (DR), a common cause of blindness in Europe.4 The DR screening uses the non-mydriatic fundus camera, a cost-effective way of screening the DM population5; we have progressively rolled out this screening programme since 2000.6 ,7 In 2007, we extended a screening programme for all our diabetic population. We conducted a study of our population many years ago, which we reported in 2008, regarding the prevalence of DR, the impact of DR screening and its control and an amelioration of the pathophysiology status of patients affected.8 However, since 2011, we noticed important increase in the incidence of any DR, and severe forms of DR and in diabetic macular oedema (DMO), especially in younger patients. The present study aims to explain these findings and to evaluate the changes in DR risk factors through a population-based study of Caucasian patients with DM referred to our Health Care Areas (HCAs).
Materials and methods
Setting
The population of reference is 247 174 inhabitants who visit the general practitioners (GP) in our 16 HCAs. GPs are those who treat patients with DM in our area. The total number of patients with DM registered in our HCAs is 17 792.
Design
A prospective, population-based study, conducted from 1 January 2007 to 31 December 2014. A total of 15 396 patients with DM were screened, and all were registered in our HCAs as patients with DM.
Power of the study
Our epidemiologist estimates the detection of a 95% increase in risk with an accuracy interval of 3%.
Method
Screening for DR was carried out with one 45° field retinography, centred on the fovea. If DR was suspected, a minimum of three retinographies of 45° were taken, according to previous studies.9 ,10 Patients with DR were classified according to international classification.11 In the incidence analysis, we classified the patients as patients with any DR and patients with advanced DR (that include moderate, severe and proliferative DR). Any patient with microaneurysms or exudates in macular area was referred to the hospital and examined by retina specialist to diagnose possible DMO.12 In all patients with DMO, we performed a fluorescein angiography, and we also performed an optical coherence tomography.
Inclusion criteria
Patients with type 1 and 2 DM censused in our HCAs.
Exclusion criteria
Patients with other specific types of diabetes, and patients with gestational DM.
Ethical adherence
The study was carried out in keeping with local ethics committee, approval no. 13-01-31/proj6, and in accordance with revised guidelines of the Declaration of Helsinki. The study was approved and supported by Instituto de Investigaciones Carlos III (IISCIII), Spain, numbers FI12/01535, June 2013, and FI15/01150 July 2015, and Fondo Europeo de Desarrollo Regional (FEDER) fundus.
Statistical methods
The epidemiological risk factors included in the study were age and gender, type of DM and its treatment, duration of DM, arterial hypertension, levels of glycosylated haemoglobin (HbA1c) and body mass index (BMI) measured in kg/m2 with a cut-off of 30 kg/m, and dyslipidaemia, all data were obtained from family physicians’ records.
Incidence was measured for each year of the study using the following formula:
Patients with DR/All patients screened.
The 8-year total incidence was calculated as:
Number of patients with DR over 8 years/Subjects at risk (15 396 patients).
Data evaluation and analysis was carried out using the SPSS V.21.0 statistical software package, and p<0.05 was considered to indicate statistical significance.
Descriptive statistical analysis of quantitative data was made by the determination of mean, SD, minimum value, maximum value and the 95% CI. For qualitative data, we used the analysis of frequency and percentage in each category. Differences between those included in analyses were examined using the two samples Student's t tests to compare two variables or a one-way analysis of variance (ANOVA) if we were comparing more than two variables. Inferential analysis for qualitative data was made by χ2 table, and the determination of the Fisher test; and for quantitative data, we used Pearson correlation test for parametric variables. For multivariate statistical analysis of incidence of any DR, advanced DR, DMO and their risk factors, we used the Cox regression model.
Results
In the 8-year period (01 January 2007 to 31 December 2014), a total of 15 396 patients were screened from a total of 17 792 patients with DM. Each patient has been reviewed 3.18±1.11 times over the 8-year follow-up. The year percentage of screened patients is described in table 1. According to the retinography technique, 29.5% needed pupil dilation and 1.9% had blurred images and thus required referral to hospital for diagnoses.
Descriptive values of the sample
Demographic variables of the patients
The sample included more men, which reflects the prevalence of diabetes in the population as a whole. There were no significant differences in the mean age or in age groups. The mean duration of diabetes, link to arterial hypertension and dyslipidaemia, and the presence of higher than 30 kg/m BMI were similar over the 8 years, and differences were not significant in the statistical analysis (table 1). According to DM treatment, we observed a change in patients treated by oral hypoglycaemics+insulin, with an increase in this group of patients from 7.7% in 2007 to 8.9% in 2014. Inversely, the patients treated only with insulin decreased from 8.8% in 2007 to 7.7% in 2014; due to the new development of oral hypoglycaemic agents, the observed differences in their use linked to insulin are significant in the statistical analysis with p values <0.001.
Study of incidence of any DR
The yearly mean incidence value of 8.37±2.19% (8.09%–8.99%), with an 8-year total incidence of 24.05%. Table 2 and figure 1 show a clear change with an increase from 8.09% in 2007 to 8.99% in 2014. These differences were significant when applied to one-way ANOVA, p<0.001, 95% CI 8.02 to 8.74. The multivariate survival analysis of any DR, using the Cox regression, shows that independent risk factors are male gender (p<0.001, aHR: 0.67, 95% CI 0.54 to 0.84), high HbA1c levels (p<0.001, aHR: 1.32, 95% CI 1.25 to 1.41), insulin treatment (p<0.001, aHR: 2.55, 95% CI 1.96 to 3.32), duration of DM (p<0.001, aHR: 1.03, 95% CI 1.01 to 1.05) and arterial hypertension (p=0.006, aHR: 0.59, 95% CI 0.44 to 0.73).
Total of patients screened each year and incidence of diabetic retinopathy (DR) and each type

Incidence of diabetic retinopathy and macular oedema, from 2007 to 2014 in our Health Care Areas. DR, diabetic retinopathy; DMO, diabetic macular oedema.
Study of advanced DR
The yearly mean value of 2.64±0.15% (2.48%–2.88%), with an 8-year total incidence of 4.17%. The survival analysis shows that the independent risk factors include male gender (p=0.018, aHR: 0.52, 95% CI 0.30 to 0.89), high HbA1c levels (p<0.001, aHR: 1.42, 95% CI 1.25 to 1.62), insulin treatment (p<0.001, aHR: 5.62, 95% CI 3.27 to 9.65) and arterial hypertension (p=0.032, aHR: 0.51, 95% CI 0.28 to 0.94).
Incidence of DMO
The yearly mean incidence value of 2.19±0.18% (2%–2.49%), with an 8-year total incidence of 6.36%. The incidence increased from 2% in 2007 to 2.49% in 2014, (table 2). These differences were significant when applying one-way ANOVA, p<0.001 95% CI 2.03 to 2.35.
In survival analysis for total DMO using the Cox regression analysis, independent risk factors include male gender (p<0.001, aHR: 0.84, 95% CI 0.78 to 1.12), high HbA1c levels (p<0.001, aHR: 1.09, 95% CI 1.06 to 1.12), the insulin treatment (p=0.007, aHR: 1.21, 95% CI 1.05 to 1.41), arterial hypertension (p<0.001, aHR: 0.62, 95% CI 0.56 to 0.69), DM duration (p<0.001, aHR: 0.96, 95% CI 0.95 to 0.97) and dyslipidaemia (p<0.001, aHR: 1.16, 95% CI 1.97 to 1.26).
Analysis of DR changes according to age of patient
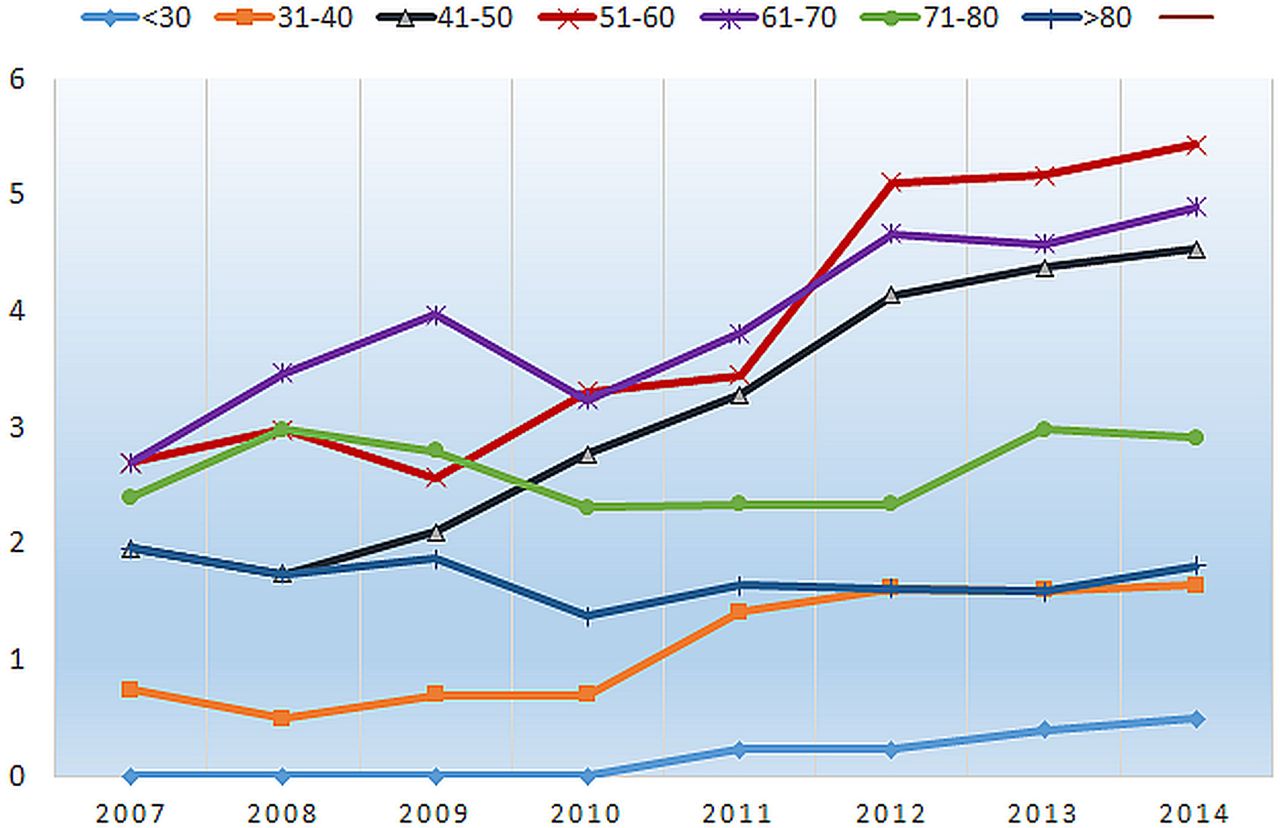
In order to explain the changes observed, we examined the patients’ age classified according to 10-year groups. Figure 2 shows the changes in the mild-DR group, in which the increase in the 41–50 and 51–60 10-year groups is evident. Next, we analysed the changes in the group of patients with advanced DR, and figure 3 shows the changes over the 8 years of the study. It is clear that 41–50, 51–60 and 61–70 age groups increased.

Changes in the incidence of any DR, according to 10-year age groups. Data obtained for yearly ratio: number of any DR/number of total DR. There is an evident increase in the 41–50 and 51–60 groups. DR, diabetic retinopathy.

Changes in the incidence of the advance DR, according to age group. Data obtained for yearly ratio: number of advanced DR each decade/ number of total DR. There is an evident increase in 31–40, 41–50, 51–60 and 61–70 groups. DR, diabetic retinopathy.
The study of risk factors of any DR adjusted by age groups, was statistically significant for high HbA1c levels (p=0.001, aHR: 3.01, 95% CI 1.59 to 5.71) and insulin treatment (p=0.006, aHR: 1.28, 95% CI 1.07 to 1.54). For advanced DR by age group, only the high HbA1c levels (p=0.006, aHR: 1.12, 95% CI 1.03 to 1.21) were significant. And finally for DMO, adjusted by age group, only the high HbA1c levels (p=0.002, aHR: 1.75, 95% CI 1.23 to 2.48) were significant.
Discussion
We have conducted a population-based study with a total of 15 396 Caucasian patients with DM, screened with a mean of 3.18±1.11 visits during an 8-year follow-up. The sample represents 86.53% of a total of 17 792 patients with DM in our HCAs. Our results demonstrate that the mean yearly incidence of any DR was of 8.37±2.19% (8.09%–8.99%). We observed that incidence remained stable between 2007 (8.09%) and 2011 (8.11%), and the most important change was observed before 2011, with an incidence of 8.77% in 2012, 8.92% in 2013 and 8.99% in 2014. These changes are similar in advanced DR and DMO.
Considering the risk factors for developing DR, our results corroborate: male gender, long duration of DM, arterial hypertension and bad metabolic glycaemia control evaluated by HbA1c levels, and insulin treatment.13 It is difficult to compare the present study with other studies because the methods and the follow-up times vary.14 Screening by non-mydriatic fundus camera is the same as that used by the National Health Service in the UK. The results obtained in England,15 Wales16 and Scotland17 showed a high initial prevalence of DR (20.5%, 30.8% and 37.3%, respectively). In England, the yearly incidence of any DR was 8.14% and 2.4% for DMO, similar to our study, 8.37% and 2.19%, respectively. In Wales, the yearly incidence of any DR was 6.659%, which was lower, but in that study the authors included the referable DR, with a cumulative incidence of 1.164% after 4 years. We do not have that data in our study, but if we calculate the incidence of similar referable-DR patients at 4 years since 2007, our data is similar, at 1.11%. In Scotland, we can compare the incidence of DMO. Macualopathy was present in 2.58% of patients in 2006, increasing to 3.13% in 2010. Our results are similar, with a mean yearly incidence of 2.19±0.18% (2%–2.49%).
The increase in incidence of DR over the last 3 years of our study is surprising. We attended more patients with severe forms of DR for treatment in our hospital, and the treated patients were younger before. These increases in incidence of any DR, advanced DR and DMO disagree with previously published studies by our research group, in which we reported stabilisation in the numbers of DR sufferers in our country. In 2007,6 we published a cross-sectional study, in which we reported a decrease in the prevalence of DR in type 2 DM, from 39.41% in 1993 to 26.11% in 2007. This value was according to observed data in Spain,18 ,19 and also to the Wisconsin study published in 2013, a study that compared the results of prevalence over the 2007–2011 period, against the 1980–1996 period. In that study, LeCaire et al,20 ,21 demonstrated a decrease in any DR, and severe DR in a type 1 diabetes cohort, a decrease that corresponded to a better control of DM and lower HbA1c levels in the most recent cohort with 8.0±1.5% against the initial 9.3±1.7% levels. In our country, the prevalence values of DR were stable throughout the first decade of this century with a small decrease in the incidence of DR. In other parts of Spain, the prevalence of DR remained stable, with lower levels than in other countries,22 but since 2010 the DR incidence has increased, especially in the DR forms that cause a loss of sight. We therefore decided to analyse our data more accurately and found that any DR increased selectively in some age groups, surprisingly, in the 41–50 and 51–60 age groups (figure 2). Furthermore, patients aged 31–40 also have small but evident increase in DR. We also analysed the incidence of advanced DR, and it showed an increase in the 31–40, 41–50, 51–60 and 61–70 age groups (figure 3). On that evidence, we decided to analyse the DR risk factors according to age, and the results were surprising. The high levels of HbA1c are evident in some age groups since 2011 (table 1), these age groups are also the groups with higher uses of insulin treatment. For us, it was evident that the patients become more relaxed in their metabolic control of diabetes in these age groups, with a corresponding high percentage of ocular complications. Currently, we do not know why that happens. It is worrying that the increases are affecting the youngest patients, and in the most advanced forms that causes a loss of sight through DMO, the most important cause of sight loss in patients with diabetes.
The limitations in our study included that the statistical analysis of 8-year total incidence was not the same as cumulative incidence because at baseline and at final study, not all DM were screened; only at 2.5 years, we can include all the subjects at risk. Weaknesses include the use of only one retinography in a screening programme can reduce the number of patients diagnosed with DR. Also the severity scale could vary if we use wide-field image techniques, and the number of patients with advanced DR can increase. The number of patients who developed proliferative DR is small and can bias the statistical analysis and finally in DMO diagnoses, screening with retinographies means that case of DMO can be underdiagnosed. The DMO study demonstrated that the high levels of HbA1c, arterial hypertension, dyslipidaemia and DM duration, which are well-known risk factors in its development.23 We are aware that renal status is another important risk factor, such as the presence of microalbuminuria or renal flow rate.24 ,25 We did not include this in the present study because we did not have a sufficient number of patients with that data. Also, the term dyslipidaemia is a generalisation of lipid status and the levels of different cholesterol can give us more information about which fraction might be implicated in the development of DMO, but we have few patients with that data.
In conclusion, the present study is highly representative of our DM population, the strengths of the present study are the sample size and the number of visits that each patient attended (3.18±1.11), and incidence values of DR and DMO obtained are certainly representative, so the increase in these ocular diseases can be true and perhaps extrapolated to other populations in our country. The increase in younger patients is an important consideration, related to bad metabolic control of DM. As a reflection on the results, we can say that if our results are confirmed by other studies in different populations, we can expect in future that we will have to treat a lot of complications related to DR, such as tractional retinal detachment or neovascular glaucoma, and we can expect a new wave of patients with blindness and low vision.
Acknowledgments
We thank all the general practitioners in our area who helped us to implement the new screening system using the non-mydriatic fundus camera and our camera technicians for their work and interest in the diabetes screening.
References
Footnotes
Contributors PRA contributed to study conception and design, collected research data carried out the statistical revision, elaborated the Discussion and wrote and edited the manuscript. SRF contributed to study conception and design, contributed to ophthalmological data collection, diagnosed diabetic macular oedema, carried out the laboratory procedures, elaborated the Discussion and made a critical review. AVM contributed to study design, and to the statistical analysis, interpreted the research data, made a critical review and reviewed the translation. RSA contributed to study conception and design, contributed to diabetes mellitus data collection, realised retinographies and interpreted the research data and aids to write the manuscript. AMR contributed to study design, and the statistical analysis, research data interpretation and contributed to the interpretation of the study findings. NS contributed to ophthalmological data collection, realised ophthalmic retinographies and OCT procedures and interpreted the research data. All authors contributed to final approval of the version to be published.
Funding The study was approved and supported by Instituto de Investigaciones Carlos III (IISCIII), Spain, numbers FI12/01535, June 2013, and FI15/01150 July 2015.
Competing interests None declared.
Ethics approval Local ethics committee of Hospital Universitari Sant Joan de Reus, approval no. 13-01-31/proj6.
Provenance and peer review Not commissioned; externally peer reviewed.
Linked Articles
- At a glance