Article Text

Abstract
Purpose To quantitatively evaluate retinal layer thickness changes in acute macular neuroretinopathy (AMN).
Methods AMN areas were identified using near-infrared reflectance (NIR) images. Intraretinal layer segmentation using Heidelberg software was performed. The inbuilt ETDRS -grid was moved onto the AMN lesion and the mean retinal layer thicknesses of the central grid were recorded and compared with the corresponding area of the fellow eye at initial presentation and during follow-up.
Results Eleven patients were included (mean age 26±6 years). AMN lesions at baseline had a significantly thinner outer nuclear layer (ONL) (51±21 µm vs 73±17 µm, p=0.002). The other layers, including inner nuclear layer (37±8 µm vs 38±6 µm, p=0.9) and outer plexiform layer (OPL) (45±19 µm vs 33±16 µm, p=0.1) did not show significant differences between the study eyes and fellow eyes. Adjacent to NIR image lesions, areas of OPL thickening were identified (study eye: 50±14 µm vs fellow eye: 39±16 µm, p=0.005) with corresponding thinning of ONL (study eye: 52±16 µm vs fellow eye: 69±16 µm, p=0.002).
Conclusions AMN presents with characteristic quantitative retinal changes and the extent of the lesion may be more extensive than initially presumed from NIR image lesions.
- Imaging
- Macula
This is an Open Access article distributed in accordance with the Creative Commons Attribution Non Commercial (CC BY-NC 4.0) license, which permits others to distribute, remix, adapt, build upon this work non-commercially, and license their derivative works on different terms, provided the original work is properly cited and the use is non-commercial. See: http://creativecommons.org/licenses/by-nc/4.0/
Statistics from Altmetric.com
Introduction
Acute macular neuroretinopathy (AMN) is a rare disease initially described in otherwise healthy young women.1 The underlying cause is still unknown, but a vascular aetiology seems likely.2 In general, patients report acute onset of paracentral scotomas, which correspond initially to localised hyper-reflectivity of the outer plexiform layer (OPL), Henle’s layer and outer nuclear layer (ONL), which is followed by localised disruption of the interdigitation zone (IZ), the ellipsoid zone (EZ) and the external limiting membrane (ELM).2 ,3 Over time scotomas may fade and subsequent thinning of ONL ensues.2 ,4 Beside spectral domain optical coherence tomography (SD-OCT), near-infrared reflectance (NIR) imaging best identifies the typical AMN lesions, which manifest as characteristic parafoveal hyporeflective areas.2 ,4 Although the morphological course of AMN has been described in detail, a quantitative approach to evaluate morphological changes is still lacking. The aim of this multicentre study was therefore to quantify the changes of retinal layer thickness in patients with classic AMN over time.
Methods
Patient selection and setting
This retrospective study included 11 patients from three tertiary referring institutions: Department of Ophthalmology, Inselspital, Bern University Hospital, University of Bern, Switzerland; Hospital St Gallen, St Gallen, Switzerland and Rigshospitalet—Glostrup, University of Copenhagen, Copenhagen, Denmark. The study adhered to the tenets of the Declaration of Helsinki and was approved by the local review board.
Retrospectively, patients diagnosed with AMN were included in this study. Diagnosis was based on the following clinical criteria: (1) Characteristic clinical presentation including sudden onset of paracentral scotomas reported by the patients. (2) Parafoveal hyporeflective wedge-shaped lesions on NIR imaging, (3) Localised hyper-reflectivity of the OPL layer and ONL with associated attenuation of the underlying EZ and IZ on SD-OCT. Medical records were reviewed for demographic data and best corrected visual acuity (BCVA) (given in Snellen acuity decimals), age, sex, refraction, medications and medical history.
Image acquisition and analyses
Heidelberg Spectralis SD-OCT (Spectralis HRA OCT; Heidelberg Engineering, Heidelberg, Germany) was used for image acquisition. The OCT volume scans (20×20, 49 scans, 120 µm distance between scans, 9 scans averaged) of both eyes at baseline and at last follow-up visit were evaluated. Only horizontal volume scans with straight entry position of the SD-OCT beam were chosen for analyses in order to minimise the possible bias of changes of the reflectivity of the Henle's layer due to a temporal beam entry position.5 In order to quantitatively analyse retinal layer thickness, the in-built Spectralis segmentation software, Heidelberg Eye Explorer 1.9.10.0 (Heidelberg Engineering, Germany) was used to obtain individual retinal layer thickness measurements of the inner nuclear layer (INL), OPL, ONL and the photoreceptor (PR) complex. This software program allows the automatic alignment of each individual layer. Based on this segmentation algorithm the area between the inner plexiform layer and the INL segmentation line displaying the mean INL thickness, the area between the INL and the OPL segmentation line displaying the mean OPL thickness, the area between the OPL and the ELM displaying the mean ONL thickness, and the area between the ELM and the basal membrane segmentation line displaying the mean PR complex thickness were calculated (figure 1). The automatic segmentation was verified by three experienced graders (MB, MSZ, MRM) and, when necessary, that is, if automated segmentation alignment was incorrect, the layer boundaries were manually corrected by one of the coauthors (MB) and again verified by the other two graders (MSZ, MRM). For further layer thickness analyses the inbuilt ETDRS grid of the Heidelberg software was initially moved over the most hyporeflective area seen on NIR imaging, so that the central subfield of the ETDRS grid now displayed the individual layer thickness values of respective areas of interest (figure 2). The ETDRS grid of the fellow eye was moved to exactly the same region in order to allow individual layer thickness comparison between the study and the fellow eye. In order to evaluate layer thicknesses of the AMN lesions over time, the ETDRS grid was placed over the same region at the last follow-up visit. If a patient had bilateral AMN manifestation (6 out of 11 patients), the eye with the more severe AMN manifestation was chosen to serve as the study eye. In patients with bilateral AMN the analysed lesion in the study eye had to correspond to a healthy area in the fellow eye to enable an accurate comparison between the impaired AMN area of the study eye and the corresponding healthy area of the fellow eye. Previous reports have demonstrated that perturbations of retinal sensitivity and integrity may be more extensive than the lesions detected on SD-OCT and NIR imaging,6 ,7 therefore the corresponding healthy area of the fellow eye had to be at least 1 mm away from the AMN lesion. In a next step the ONL and the OPL maps displaying the colour-coded thicknesses of the ETDRS subfield were generated and the location of the thickest OPL area were identified and compared with the location of the hyporeflective lesion. Similarly as for the hyporeflective lesion on the NIR image, the inbuilt ETDRS grid was moved over the thickest OPL area seen on the colour-coded thickness map and the ETDRS grid of the fellow eye and for the follow-up visit was moved to exactly the same region in order to allow individual layer thickness comparison between the study eye and the fellow eye.
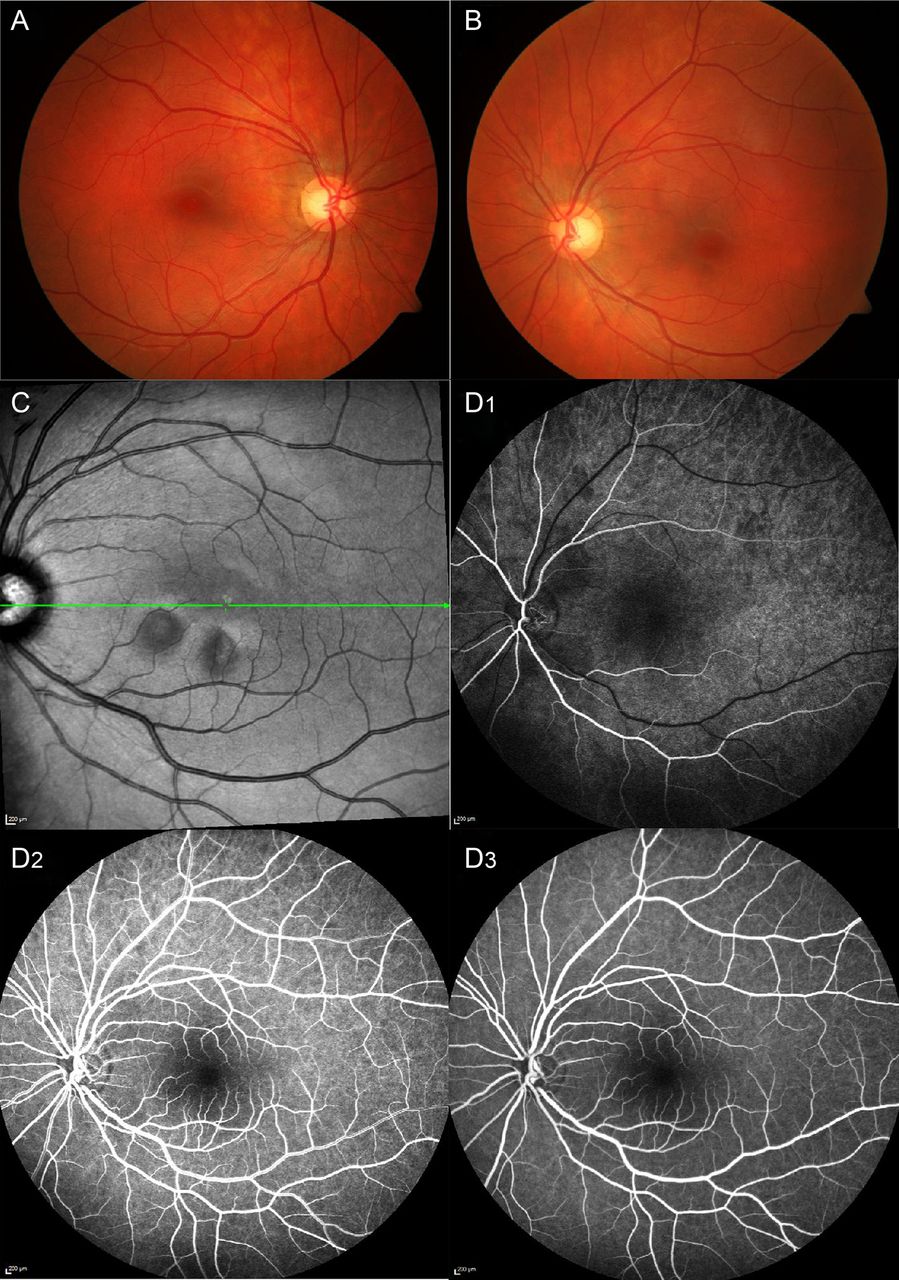
Multimodal imaging of acute macular neuroretinopathy. (A) Colour photography of the right eye. (B) Colour photography of the left eye. (C) Near-infrared images with characteristic hyporeflective lesions. (D) Fluorescein angiography with early (D1), arteriovenous (D2) and late (D3) phases of the left eye.

Retinal layer analysis of acute macular neuroretinopathy (AMN) lesions seen in near-infrared reflectance (NIR) imaging with spectral domain optical coherence tomography (SD-OCT). (A) Representative NIR image with characteristic hyporeflective lesions and the orientation of the scan (green line). (B) SD-OCT through the AMN lesion and (B2) retinal layer segmentation where the yellow line represents the boundary between the inner nuclear layer and the outer plexiform layer (OPL), the white line represents the boundary between the OPL and the outer nuclear layer (ONL) and the blue line represent the boundary between the ONL and the photoreceptor (PR) outer segment layer complex. (C) Box and whisker plots of the OPL (left) and the ONL (right) of the fellow eye (FE) and the AMN lesion (AMN) at baseline (n=11, paired t test, ns=not significant).
Statistics
Statistics were performed using GraphPad Prism (Version 6 GraphPad Software Inc., La Jolla, CA) and SPSS (IBM, SPSS statistics, Version 21, SPSS Inc., Chicago, USA). Differences of layer thicknesses between the study and fellow eyes as well as between baseline and follow-up visits were analysed using Wilcoxon rank sum test. A p value ≤0.05 was deemed statistically significant. Values are given as mean and SD (mean±SD).
Results
Demographic characteristics
Eleven eyes of 11 patients were included (mean age 26±6 years) of which 55% showed bilateral lesions. The majority of the 91% affected patients were female. Mean distance BCVA of the study eye at initial presentation was 0.86±0.39 Snellen acuity decimals (range 0.1–1.25) and at the last follow-up visit 1.04±0.16 Snellen acuity decimals (range 0.7–1.25, p=0.04). The mean distance BCVA of the fellow eyes was 1±0.2 Snellen acuity decimals and 1.1±0.2 Snellen acuity decimals at baseline and at last follow-up visit, respectively. The mean follow-up time was 1.1±1 years. Demographic characteristics, Snellen acuity, and suspected or known underlying aetiologies are shown in table 1.
Demographics and clinical characteristics of patients with classic acute macular neuroretinopathy (AMN)
Qualitative evaluation and comparison of individual layer thickness maps
In 82% (nine eyes) the thickest OPL area did not match with the hyporeflective area visible on the NIR image (figure 3A, B). Only in 18% the hyporeflective lesion on NIR image corresponded to the thickest OPL area. In 36% (four eyes) the thickest OPL area was found temporal, in 18% (two eyes) superior, in 18% (two eyes) inferior and in 9% (one eye) nasal to the hyporeflective NIR image lesion. In 64% (seven eyes) the thinnest ONL area did not correspond with the hyporeflective NIR image lesion but corresponded with the location of the thickest OPL area. The NIR image hyporeflectivity corresponded best with the thinning of the PR layer complex and the loss of IZ on SD-OCT. In all eyes but one there was fading of the NIR image hyporeflectivity over time corresponding with a partial increase of the EZ and IZ reflectivity. In the one respective eye there was an increase in lesion size over time (figure 3A, B).

Retinal layer analysis of acute macular neuroretinopathy (AMN) lesions outside the near-infrared reflectance (NIR) imaging lesions with spectral domain optical coherence tomography (SD-OCT). (A1) NIR images with superimposed colour-coded outer plexiform layer (OPL) thickness maps where the black dotted lines represent hyporeflective NIR lesions (top left), NIR images with corresponding hyporeflective lesions (white dotted lines) and area of OPL thickening (red dotted line) (top right), and the corresponding SD-OCT image with enhanced OPL (between blue and yellow line) (bottom). (A2) Box and whisker plots of the OPL (left) and the outer nuclear layer (ONL) (right) of the fellow eye (FE) and the AMN lesion (AMN) at baseline (n=11, paired t test). (B) Near-infrared images of AMN at initial presentation (BL) and after 2 months (BL+2 months) with corresponding SD-OCT images (bottom). There is marked thickening of the OPL (asterisk) in the area of AMN progression.
Layer segmentation on hyporeflective NIR image lesion
There was no difference in terms of INL (37±8 µm vs 38±6 µm, p=0.9) and OPL (45±19 µm vs 33±16 µm, p=0.1) thickness between the study eyes and the fellow eyes at baseline. However the ONL at the respective area was significantly thinner in the study eyes compared with the fellow eyes (51±21 µm vs 73±17 µm, p=0.002) and the PR layer complex at baseline was borderline thinner (study eye: 77±8 µm vs fellow eye: 80±4 µm, p=0.055). The total retinal thickness was also significantly thinner at the respective area (316±28 µm vs 337±21 µm, p=0.002).
During follow-up, none of the intraretinal layer thicknesses changed significantly (INL: 37±7 µm to 37±3 µm, p=0.3, OPL: 45±19 µm to 42±18 µm, p=0.8, ONL: 51±21 µm to 58±14 µm, p=0.6, total retinal thickness: 316±28 µm to 313±24 µm, p=0.09). However, the PR layer complex thickness increase over time was borderline significant (77±8 µm to 83±6 µm, p=0.06) and at the follow-up visit no more difference was found between the fellow eye and the study eye. Although the ONL did not significantly increase in thickness over time, there was no more significant difference between the study eye and the fellow eye after follow-up (details see table 2). The differences between the study eye and the fellow eye in terms of total retinal thickness however remained statistically significant after follow-up (313±24 µm vs 339±23 µm, p=0.004).
Mean thickness values and comparison between the study eye and the fellow eye (given in mean±SD) of individual retinal layers at the hyporeflective NIR image AMN lesion and at the area of maximal OPL thickening at baseline and after last follow-up
Layer segmentation at the area of maximal OPL thickening
At the area of maximal OPL thickening, the OPL was significantly thicker compared with the corresponding area of the fellow eye (figure 3, details see table 2). Correspondingly, at this location the ONL was also significantly thinner in the study eye compared with the fellow eye (figure 3, table 2). The INL and the PR complex thickness did not differ (table 2). The total retinal thickness at the respective location was significantly thinner in the study eye compared with the fellow eye (details in table 2). During follow-up, there was a numerical increase of the ONL thickness (52±16 µm to 57±14 µm, p=0.2) and a numerical decrease of the OPL thickness (50±14 µm to 48±14 µm, p=0.2), respectively. At the last follow-up visit no more statistically significant differences were found between the study eye and the fellow eye in any layer (table 2).
Discussion
In this large longitudinal multicentre case series, retinal layer changes occurring in AMN were quantified.
Classic AMN was described to start with hyper-reflectivity of the OPL in OCT followed by ONL thinning and PR disruption.2 ,3 ,8 Accordingly, functional examinations using multifocal electroretinogram indicate involvement of the bipolar cells and PRs.2 ,9 ,10 Based on the presumed vascular-occlusive aetiology of the deep capillary network (DCN) one may assume that the hyper-reflectivity of the OPL is due to ischaemic swelling and may be followed by a consecutive thinning over time. This study demonstrates that within the NIR image identified AMN lesions, the hyper-reflectivity of the OPL is not associated with significant swelling. However, in most eyes the area of maximal OPL thickening was found to be adjacent to hyporeflective NIR image lesions. The thickening of the OPL in these areas was associated with significant thinning of the ONL, without any quantitative changes of the PR layer complex. Interestingly, despite the OPL thickness increase at baseline we did not find any signs of atrophy at later stages. This finding implicates that the extent of the lesion may be more widespread and greater than initially presumed from the hyporeflective NIR image lesion, which corresponds mainly to the thinning and the hyporeflectivity of the PR complex (figure 3). This also implicates that respective layers may be differently affected in different areas. A previous study found a reduced mfERG which was not limited to the hyporeflective lesions, and microperimetry identified a generally reduced central retinal sensitivity most pronounced at the location of the hyporeflective AMN lesion on the NIR image but not limited to this area.6 This previous finding reiterates our observation and reinforces the assumption that the affected area may be more widespread than initially assumed from the hyporeflective NIR image lesion. The underlying reason of this phenomenon may be found in the blood supply and the different oxygen demand of the retinal tissue. The PR axon terminals filled with mitochondria are located in the OPL and may be more dependent on the blood supply of the DCN than the PR inner and outer segments, which receive 90% of their blood supply from the choriocapillaris.11 Furthermore, the OPL and ONL are located in the watershed zone between two sources of blood supply and are rather vulnerable for ischaemic events.12 ,13 Thus, the PR complex may be a ‘penumbra’, that is, an area surrounding the ischaemic event and may be only temporarily affected in the ‘centre’ of the lesion. Another explanation may be that some lesion may enlarge over time into previous unaffected areas, as formerly described by Fawzi et al.2
That the respective layers seem differently affected in different areas and that maximal OPL thickening was found adjacent to the hyporeflectivity on NIR image may also be a result of the natural development of the lesion. AMN starts with hyper-reflectivity of OPL followed by ONL thinning and PR disruption.2 ,3 ,8 While the reactive swelling of OPL in the centre of the lesion may have already resolved at the time point of ONL thinning and PR complex damage, adjacent OPL thickening may be caused by the ongoing expansion of the lesion due to active ischaemic induced injury and inflammation and reperfusion damage. However, all these assumptions are speculative at this time point.
In our case series, only the PR complex showed borderline significant improvement and reached a similar thickness as the fellow eye over the course of a mean of 1.1 years of follow-up, which is in accordance with a recent case report.2 The OPL and ONL revealed only some numerical improvement without statistical significance and the total retinal thickness at the area of maximal OPL thickening as well as at the location of NIR image hyporeflectivity remained significantly thinner compared with the corresponding area of the fellow eye. These findings may resemble (partial) recovery of the PR inner and outer segments, despite some permanent loss of the PR cell bodies and terminal axons. The partial recovery of the PR layer complex in contrast to the other layers may again be explained by the fact that the PR layer is mainly nourished by the choroid.2 ,14
The partial recovery of the PR complex goes along with the fading of the paracentral scotomas.1 ,2 ,6 ,15 ,16 Despite the improvement and the increase of the retinal sensitivity in the AMN areas, permanent morphological damage and functional impairment remain.2 ,17 ,18 Concordantly, incomplete recovery of the cone PR mosaic was found in adaptive optics scanning laser ophthalmoscopy (AO-SLO), long after the resolution of the hyporeflective lesions on infrared imaging.7 Other reports using AO-SLO could not demonstrate any recovery of the cone mosaic 6 months and 12 months after initial onset of AMN, respectively.19 ,20 The relative hyporeflectivity of IZ and EZ in SD-OCT may also reflect the decreased cone PR density visible on AO-SLO and may be a potential quantitative parameter to follow AMN.14 ,21 These findings are in line with the quantitative changes observed in our patients. Numerical but no significant changes were found over time, resembling incomplete recovery along with some functional and morphological improvements. Unfortunately, AO-SLO was not performed in our cases, which would have been a suitable tool to demonstrate and verify the reconstruction and incomplete recovery of the cone PRs at a cellular level.
The prevalence of AMN is highest in young women.1 Here too, 91% of the included cases were women. The only man who was included showed AMN after a car accident, probably due to a trauma-induced catecholamine release leading to vasoconstriction of the capillary network.14 ,22 ,23 As AMN mainly affects women, this condition has been linked to an immune-based aetiology.1 ,15 ,24
However, quantitative changes in SD-OCT have to be analysed with caution as reflectivity changes may interfere with the accurate ONL and OPL measurements. The AMN lesions may alter the direction of the OCT beam leading to reflectivity changes at the level of the Henle's layer, which may obscure the true ONL and OPL thickness.2 ,5 ,25 To overcome this potential bias in future studies, directional OCT is warranted.25 In this study fellow eyes were taken as controls, which may be a potential bias as a previous study showed that even unaffected partner eyes in patients with unilateral AMN may reveal retinal sensitivity changes and reduced mfERG responses.6
In summary, in this study we describe quantitative changes of retinal layers in a large series of patients with AMN and demonstrate that this condition presents with a characteristic longitudinal footprint. These changes may indicate some permanent loss of the PR cells bodies and terminal axons while the inner and outer segments of the PR seem to partially recover. The extent of the lesion may be more widespread than initially presumed from the hyporeflective NIR image lesion.
References
Footnotes
Contributors All authors contributed substantially to this manuscript and approved the current version. Concept and design: MSZ and MRM. Data acquisition: MRM, MSZ, MB, SK, SH, ML and CV. Writing the manuscript: MRM. Statistical analyses: MB, MRM and MSZ. Correction and approval of the manuscript: MRM, MB, SK, ML, SH, CV and MSZ.
Competing interests None declared.
Ethics approval Kantonale Ethikkommission Bern.
Provenance and peer review Not commissioned; externally peer reviewed.
Linked Articles
- At a glance