Article Text

Abstract
Aims Clinically, picture acuity tests are thought to overestimate visual acuity (VA) compared with letter tests, but this has not been systematically investigated in children with amblyopia. This study compared VA measurements with the LogMAR Crowded Kay Picture test to the LogMAR Crowded Keeler Letter acuity test in a group of young children with amblyopia.
Methods 58 children (34 male) with amblyopia (22 anisometropic, 18 strabismic and 18 with both strabismic/anisometropic amblyopia) aged 4–6 years (mean=68.7, range=48–83 months) underwent VA measurements. VA chart testing order was randomised, but the amblyopic eye was tested before the fellow eye. All participants wore up-to-date refractive correction.
Results The Kay Picture test significantly overestimated VA by 0.098 logMAR (95% limits of agreement (LOA), 0.13) in the amblyopic eye and 0.088 logMAR (95% LOA, 0.13) in the fellow eye, respectively (p<0.001). No interactions were found from occlusion therapy, refractive correction or type of amblyopia on VA results (p>0.23). For both the amblyopic and fellow eyes, Bland-Altman plots demonstrated a systematic and predictable difference between Kay Picture and Keeler Letter charts across the range of acuities tested (Keeler acuity: amblyopic eye 0.75 to −0.05 logMAR; fellow eye 0.45 to −0.15 logMAR). Linear regression analysis (p<0.00001) and also slope values close to one (amblyopic 0.98, fellow 0.86) demonstrate that there is no proportional bias.
Conclusions The Kay Picture test consistently overestimated VA by approximately 0.10 logMAR when compared with the Keeler Letter test in young children with amblyopia. Due to the predictable difference found between both crowded logMAR acuity tests, it is reasonable to adjust Kay Picture acuity thresholds by +0.10 logMAR to compute expected Keeler Letter acuity scores.
- Vision
This is an Open Access article distributed in accordance with the Creative Commons Attribution Non Commercial (CC BY-NC 4.0) license, which permits others to distribute, remix, adapt, build upon this work non-commercially, and license their derivative works on different terms, provided the original work is properly cited and the use is non-commercial. See: http://creativecommons.org/licenses/by-nc/4.0/
Statistics from Altmetric.com
Introduction
Amblyopia is the most common cause of monocular visual impairment in children and young adults, affecting 1–5% of the general population.1–4 Children with amblyopia are most often asymptomatic1 and untreated amblyopia can result in irreversible visual impairment that may have a negative impact in later life.1 ,5–7 Comparison of inter-ocular visual acuity (VA) throughout the rapidly improving profile of childhood development is necessary to diagnose and monitor amblyopia. It is vital therefore that VA tests are accurate and interchangeable for children of different ages.8 In terms of spatial acuity, amblyopia is diagnosed when a significant residual inter-ocular VA difference persists despite correcting for refractive error.5 ,9–11 ,12 So as to be clinically meaningful, this difference must overcome the test–retest variability of the acuity chart being used. Since the successful treatment of amblyopia rests on early diagnosis and treatment, it is essential to obtain reliable VA thresholds as soon as the child is able to cooperate.13
The Crowded Kay Picture test (Kay Pictures, UK)14 and the Keeler LogMAR Crowded acuity test (Keeler Limited, UK)15 are two popular tests used to measure VA of children in clinical practice. Despite their equivalence in crowded and logMAR format, many studies have reported a systematic and meaningful difference between letter and picture optotype designs.16–18 It would seem preferable therefore to use only letter optotype acuity tests but this would necessarily push the age of amblyopia detection upwards, that is towards older ages of screening and then of course commencement of treatment.16 In some cases, provided the child is letter proficient, the Keeler Letter test can be used to assess VA in children as young as 3–4 years of age.13 However, in the UK, the Kay Picture test is the most commonly used test to measure VA in children aged between 2 and 4 years.13 This test is available in a crowded logMAR format; however, research has shown that the Kay picture optotypes can overestimate VA,16–18 ,19 are less affected by induced astigmatic blur20 and the optotypes are not equally discriminable.19 A limited number of studies have compared crowded Kay Pictures and a variety of crowded letter logMAR acuity tests.16–18 Jones et al16 and Elliott and Firth17 compared the crowded Kay Picture and Keeler Letter tests with a broad age range of participants. Jones et al16 participants' ranged in age from 2.5 to 16 years; while Elliott and Firth17 compared both paediatric acuity tests on a sample aged between 5 and 45 years. The results from each study, while useful to compare crowded acuity tests on older children and adults, may not give a true reflection of their accuracy in detecting amblyopia in young children. The importance of choosing the correct age cohort in the present study was highlighted by a study by Shah et al18 when it was recognised that the wide age range of paediatric participants (4–15 years) was a study limitation. These previous works16–18 provide essential preliminary data, but to our knowledge no published data exists on the use and comparison of these VA tests in amblyopic children of appropriate age.
This study compares VA results using two crowded, 4-optotype, logMAR acuity tests, the Keeler Letter test and the Kay Picture test in children undergoing amblyopia treatment, across a narrow age range (age 4–6 years). This is an important age-group to investigate as they represent the stage of visual development when amblyopia treatment is known to be most successful.1 ,2 ,21 As children get older, their VA will be measured using picture tests followed by letter tests. It is therefore of great importance for eye care clinicians to understand how comparable the results obtained from the picture and letter tests are in order to identify and manage amblyopia seamlessly.
This study additionally considered the scenario of whether a clinically meaningful difference between the two acuity tests was predictable and consistent, and also analysed whether there was a difference in the inter-ocular acuity difference (IOD) between the two acuity tests.
Materials and methods
Ethical approval was obtained from the Ulster University Research Ethics Committee. Participants were 58 children (34 male) aged between 4.0 and 6.9 years (mean 5.7±0.81 years) with a diagnosis of amblyopia and wearing spectacles producing best-corrected VA. A priori sample size was calculated using data from Shah et al.18 A sample size of 54 was required to detect a difference of 0.08±0.11 logMAR for 85% power at 5% significance. Children with a current diagnosis of amblyopia, recruited via local ophthalmologists or the researcher's optometric database, were invited to participate.
Inclusion criteria were determined by age and an ophthalmological diagnosis of amblyopia. Children who had a diagnosis of strabismic amblyopia, anisometropic amblyopia or a combination of both were included. Children were excluded if they were on atropine therapy or optical penalisation and if additional ocular pathology such as nystagmus, albinism, retinopathy of prematurity or congenital cataract was present.
The Kay Picture and the Keeler Letter acuity tests were chosen for comparison specifically because their designs are more equally comparable than using the ETDRS chart.18 This is important because for interpolated scoring of acuity thresholds the 5-optotype line (ETDRS design) values each optotype as 0.020 logMAR whereas the 4-optotype line (both Kay Picture and Keeler Letter designs), equally value each optotype at 0.025 logMAR. To our knowledge, this study is the first of acuity comparison studies to purposely eliminate this source of systematic design bias.
The Keeler Letter test design includes: the use of optotypes of similar legibility, an equal number of optotypes per line, geometric progression of 0.10 logMAR units and proportional spacing between optotypes and rows of optotypes on each line.22 The Keeler Letter test has two crowded charts, and a matching card is available. The two crowded chart versions have different presentations of letters to ensure randomisation of testing and that practice effects can be avoided. Six letters are used in the chart: Y, U, X, O, V and H. Each test line presents four randomly selected letters with no repeats. A crowding bar surrounds the four-letter presentations. The range of VA measured is from 0.80 logMAR units to −0.30 logMAR units when the chart is used at 3 m.
The Kay Picture test consists of one booklet printed on both sides to contain two versions of the test. Again, this ensures randomisation of presentation of pictures as each eye can be shown a different version of the chart. Eight different symbols are included in the chart: a boot, cup, clock, house, apple, duck, fish and a car. Four randomised Kay Pictures are presented in each line with no repeats. The four pictures are surrounded by a crowding bar. The chart is designed to be performed at 3 m and at this distance the range of VA measured is from 1.0 logMAR units to −0.10 logMAR units. For both charts, each line of letters is equal to 0.10 logMAR units and each optotype has a value of 0.025 logMAR.
All data were collected in the same clinical testing room with constant bright room illumination (500 lx). Written informed consent from the children's parent/caregiver and verbal assent from the child was obtained before data collection. All participants wore their up-to-date spectacle correction and their fellow eye was then occluded. Measurement of vision was carried out at 3 m, by one examiner to eliminate potential interobserver variability. Participants were familiarised with the optotypes (both pictures and letters) and asked to point to the matching card if necessary. The order of chart test was randomised for each participant. VA was measured monocularly and always first in the amblyopic eye.
VA measurement and results achieved with each chart were performed and recorded according to the manufacturer's instructions. VA was determined using a descending staircase method with thresholding after one reversal,17 that is progression occurred as long as two or more optotypes were correctly identified and when this criteria failed the previous line was represented and the number of optotypes correctly identified at this time was scored as the threshold and an interpolated score recorded. In some cases with the Kay Pictures, the standard test distance was increased to 4 m when participants were able to recognise and name all pictures correctly on the lowest line of the chart (−0.1 logMAR at 3 m). In such cases, participants were shown the other version of the pictures to avoid potential memorisation effects. The logMAR score was then rescaled to account for this difference in test distance.
All participants were given consistent instructions and were encouraged to guess what the optotypes were if they were hesitant. The researcher carefully monitored the participant to ensure occlusion was maintained during testing. Finger pointing by the researcher was avoided, in order not to compromise the crowding effect.
Results
All of the participants (100% compliance) successfully completed VA testing using both the Keeler and Kay acuity tests. Of the 58 participants, 22 had anisometropic amblyopia, 18 had strabismic amblyopia and 18 had a combination of both strabismic and anisometropic amblyopia. Refractive correction of ametropia was calculated as the mean spherical equivalent (MSE, ie, spherical component+1/2 cylindrical component). Table 1 presents summary statistics of the range of refractive correction of ametropia for the amblyopic and fellow eye. MSE was not normally distributed for the amblyopic eye (Shapiro-Wilk, p=0.0005), so median data are presented.
The median, IQR and range of refractive correction of ametropia for the amblyopic and fellow eye
Table 2 presents median VA for both acuity tests for the amblyopic and fellow eyes. VA data were not normally distributed (Shapiro-Wilk, p<0.001), though the individual difference between the two tests for each eye was normally distributed (p>0.58). Note that a range of acuities were captured as some children were commencing amblyopia treatment while others were responding to amblyopia treatment and gaining better VA. VA with the Keeler Letter test was significantly worse in the amblyopic eye, compared with the Kay Picture test (Wilcoxon signed rank sum test, z=−6.42, p<0.00001). This was also true for the fellow eye data (z=−6.37, p<0.00001).
Descriptive statistics of VA results and examination of differences between the two tests
Bland-Altman scatter plots were used to determine the level of agreement between the Kay Picture test and the Keeler Letter test (figure 1A, B; amblyopic and fellow eyes, respectively) and investigate whether the magnitude of bias/difference was proportional to the severity of visual deficit. The scatter plots were constructed to graphically represent the spread of VA scores between the two tests for each participant. The upper and lower 95% limits of agreement (LOA) were calculated as follows: mean difference between VA scores ±1.96×SD. Linear regression analysis was conducted on the ‘Mean’ and the ‘Difference’ values for the two acuity test results. This was performed separately for amblyopic and fellow eye data (figure 1A, B) and did not indicate any relationship between the mean difference values (p>0.60).

(A) Bland-Altman plot of the logMAR crowded Kay Picture and logMAR crowded Keeler Letter VA results for the amblyopic eye. Mean difference indicated by black dashed line (0.098 logMAR), and upper and lower 95% limits of agreement indicated by grey dotted lines. (B)Bland-Altman plot of the logMAR crowded Kay Picture and logMAR crowded Keeler Letter VA results for the fellow eye. Mean difference indicated by black dashed line (0.088 logMAR), and upper and lower 95% limits of agreement indicated by grey dotted lines. VA, visual acuity.
To further investigate the possibility of bias between the VA tests, table 3 provides Pearson's correlation coefficients and linear regression information for test comparison for the amblyopic and non-amblyopic VA measurements. High correlation values, close to one, were observed for both the amblyopic eye (r=0.94) and the fellow eye (r=0.88). The slope of the lines was also close to one, and on inspection appeared parallel to the line of equity; supporting the assertion that there is no proportionality in the magnitude of bias between the measurements (ie, no proportional bias).
Correlation and linear regression statistical analysis of the comparison between Keeler Letter acuity and Kay Picture acuity tests
A one-away analysis of variance model factoring in MSE refractive error, age, history of occlusion and type of amblyopia with the difference in VA measures did not reveal any significant interactions (VA amblyopic eye F(5,57)=1.42, p=0.23; VA fellow eye F(5,57)=1.09, p=0.38). This demonstrates that there was no influence on the difference in VA measures between tests due to age, amblyopia type, refractive error or occlusion treatment. Repeating this analysis for the mean VA measure only demonstrated a significant relation with age, indicating that VA improved for the amblyopic and fellow eye for older children.
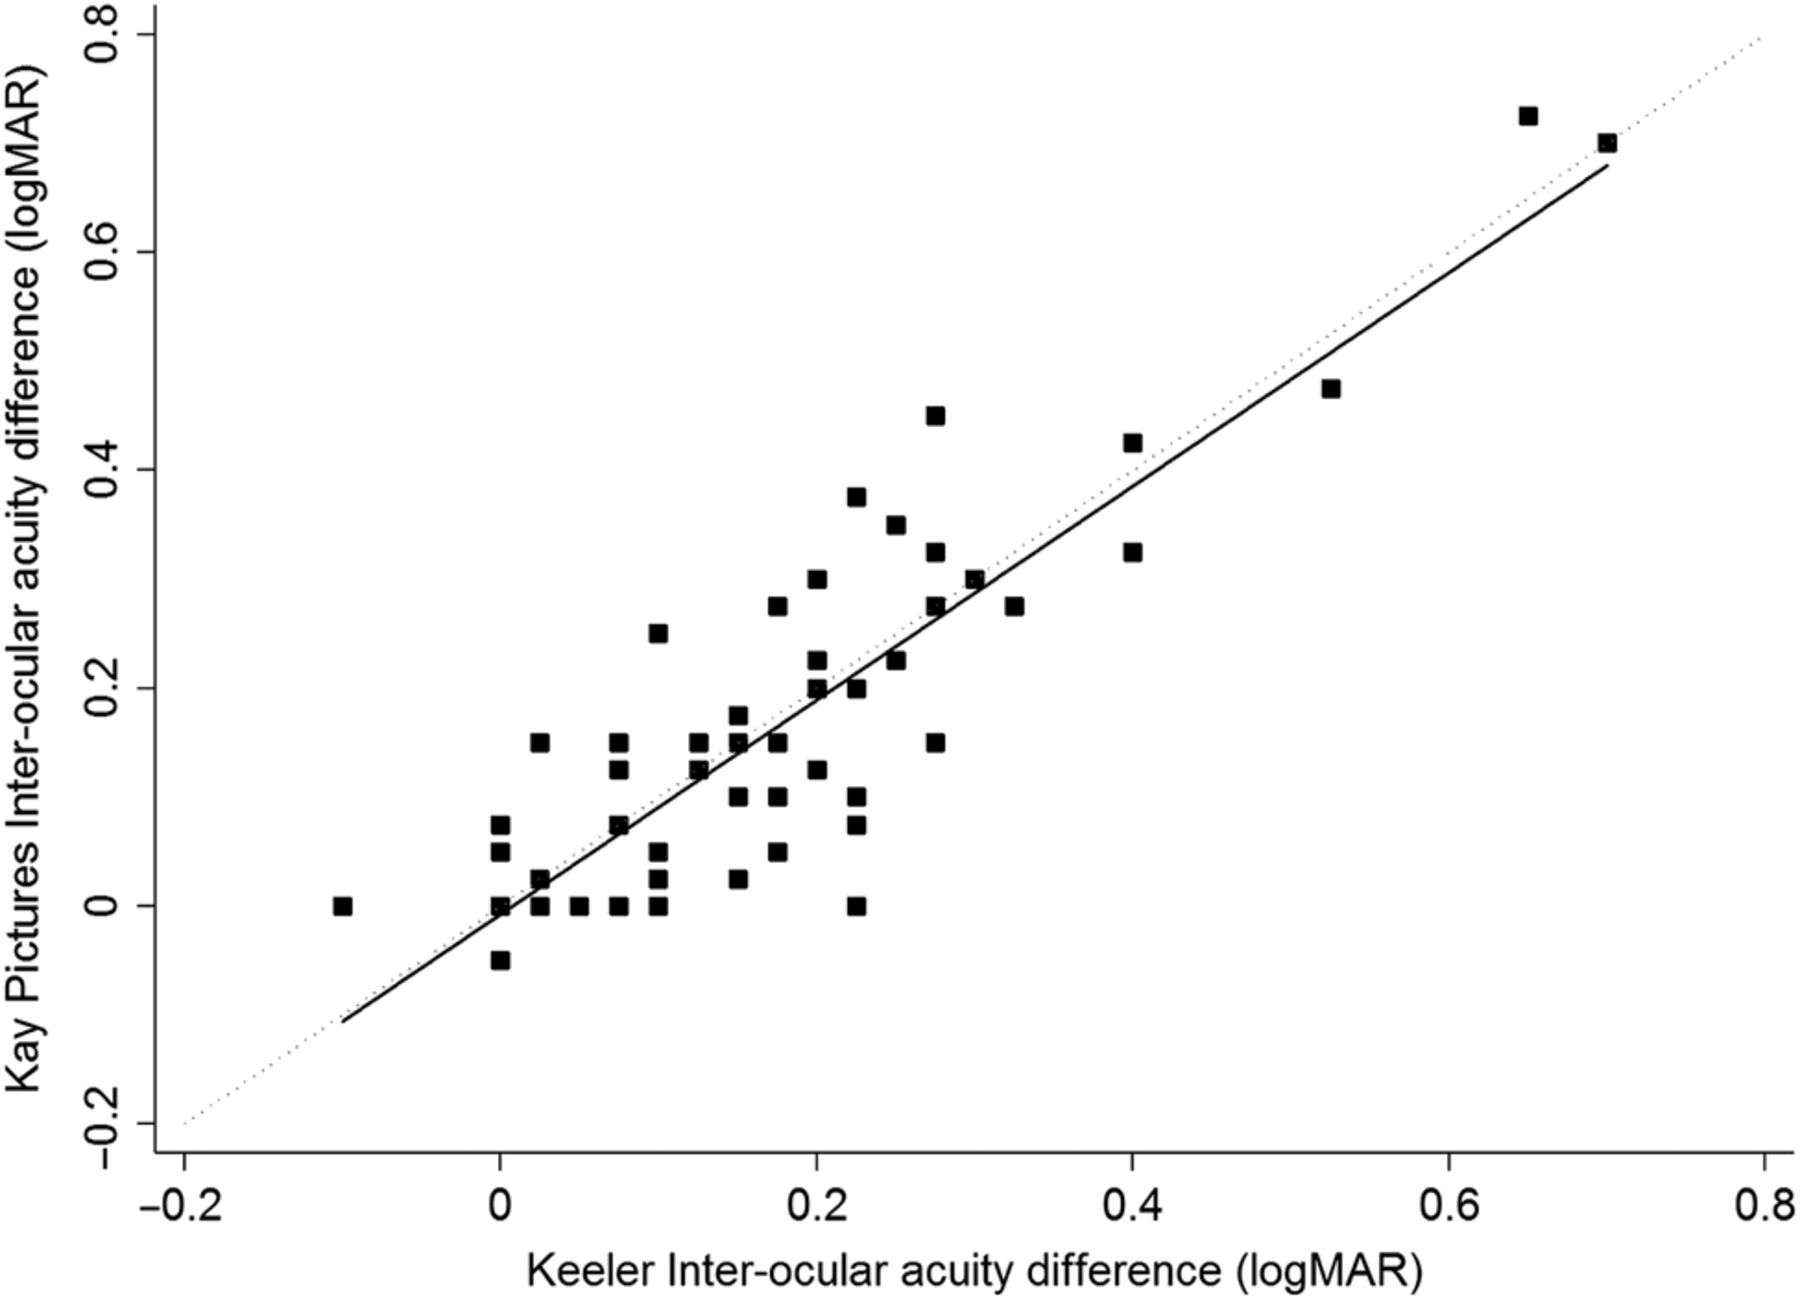
Finally, an analysis of the relationship between the inter-ocular acuity differences between the two tests was undertaken. The IOD for Kay Picture and Keeler Letter tests were calculated for each individual and are presented in figure 2. This scatter plot shows a strong correlation and a similar mean IOD for each of the tests: Kay Picture test IOD 0.16±0.17 and Keeler Letter test IOD 0.17±0.15. Furthermore, a paired t test indicated that no significant difference existed between IOD for each test (p=0.34).
Scatter plot demonstrating correlation between the inter-ocular acuity difference (IOD) of the logMAR crowded Kay Picture and logMAR crowded Keeler Letter visual acuity (VA) measurements. Black solid line is linear regression line (y=0.98x−0.007, Pearson's r=0.87). The grey dotted line is the line of equality.
Discussion
This study demonstrates for the first time, in a clinical population of children with amblyopia, that the logMAR crowded Kay Picture test consistently and predictably overestimates acuity compared with a similarly designed letter optotype test (logMAR, crowded Keeler Letter test). This overestimation (superior acuity Kay Pictures) is approximately +0.10 logMAR and occurs irrespective of the severity of the amblyopia, at least in the range of acuities tested here. This study recruited amblyopic children between 4 and 6 years of age. Both tests are comparable in their 4-optotype line layout. This is an important distinction from other reports where 4-optotype and 5-optotype line charts were compared and found significant differences.18 ,22 The mean difference between acuity tests for the amblyopic (0.098 logMAR) and fellow eyes (0.088 logMAR) is equivalent to one acuity line. Based on the findings of many previous studies,2 ,6 ,12 ,13 ,23 this difference in VA is deemed clinically significant. Consequently, this study demonstrates it is reasonable to modify the test results obtained by the Kay Picture test by +0.10 logMAR (±0.13, 95% LOA) to compare with the Keeler Letter test. In other words, if a child achieves 0.10 logMAR on the Kay Picture test, this result would be equivalent to 0.20 logMAR for the Keeler Letter test.
When examining children in clinical practice, current literature highlights the importance of using a crowded logMAR letter test as soon as the child is letter proficient.13 However, the Kay Picture test is a useful tool in practice, particularly for measuring VA in very young children or children who are unfamiliar with their letters.16 ,17 Our analysis also found that the Kay Picture test identified IODs just as well as the Keeler Letter test, demonstrating a similar capacity to identify amblyopia. Considering the high (100% completion) test success rates for both chart designs, the children involved in this study found the picture optotypes more engaging and preferentially enjoyed having their vision measured using the Kay Pictures. These pictures are familiar and interesting for young children, and the test is a cost-effective paediatric VA chart that is useful in many eye care clinics.13 ,16 By making the +0.10 logMAR average adjustment to the results as suggested in this study, eye care clinicians can compare the VA results obtained using the picture chart with a clinically robust crowded letter test with confidence. As a result, the findings of this study are particularly helpful in providing eye care professionals with information about the natural development of fellow eye acuity thresholds with age (each of the two test charts) and the expected difference in acuity when either of the two charts are interchanged. This is a basis for sound clinical decision-making.
The explanation for the overestimated VA results obtained using the Kay Picture test could be related to the number (eight) of differently shaped optotypes used in this test.19 Candy et al24 investigated discrimination performance for a range of paediatric acuity tests (though not the Kay Pictures test) in adults, and reported that differences in optotype shape and the combination of optotypes used on each line are likely to influence performance while measuring VA. This is in agreement with Little et al20 who suggested that the reliability and robustness of the crowded Kay Pictures could be improved by carefully selecting a few simple pictures of a consistent shape for use as optotypes. It may be speculated that such modifications to future versions of the Kay Picture test could improve the reliability of this test.
One limitation of the study is that there were relatively fewer children with moderate-to-severe amblyopia. Due to the nature of the study design necessitating the ability to perform letter acuity, recruitment was limited to those over 4 years of age and up to 6 years of age. Children were recruited through ophthalmologists and those attending for spectacle dispensing, so some children already had responded to treatment from spectacle wear and had reduced amblyopic status. However, previous work has demonstrated that the repeatability of VA measurements for untreated amblyopes is the same as fellow eyes and also for children without amblyopia.25
Conclusions
Crowded picture tests are necessary in clinical practice to measure VA in younger children. As children mature, their acuity can be assessed using a clinically robust letter test such as the logMAR crowded Keeler acuity test, and preference should still be given to this letter test if possible. However, by making the average adjustment of +0.10 logMAR to the logMAR crowded Kay Picture acuity test results as suggested here, VA test scores can be interchanged should the need arise in clinical practice.
Acknowledgments
Thanks to the following ophthalmologists in Galway who kindly helped with recruitment; Mr Richard Comer, Dr Fiona Harney and Mr Eamon O'Donoghue. We would also like to especially thank all the children and parents who participated in this study.
References
Footnotes
Contributors The work presented in the manuscript formed part of a recently completed MSc thesis by the corresponding author, CO. This manuscript's content was equally planned, computed and agreed upon by all contributing authors, namely, CO, SIC and J-AL.
Competing interests None declared.
Ethics approval Ulster University Research Ethics Committee.
Provenance and peer review Not commissioned; externally peer reviewed.
Linked Articles
- At a glance