Article Text

Abstract
Objective The aim of this study was to map out the developmental curve of the orbital volume of Chinese children aged 1–15 years.
Methods CT scanning was performed on 109 children and the orbital volume, interlateral orbital rim distance (IORD), and extent of exophthalmos were measured on the CT images and plotted against age.
Results The development of the orbit structure followed a biphasic pattern. The first growth phase was before 3 years and the second growth phase was between 7 years and 12 years of age. The growth speed in the first phase was about 3 times that of the second one (first vs second phase: 2.28 cm3/year vs 0.67 cm3/year for orbital volume, 5.01 mm/year vs 1.57 mm/year for IORD, 1.29 mm/year vs 0.42 mm/year for the exophthalmos). During development, there was no significant difference between the left and right orbits. There was no significant difference between boys and girls before 12 years of age. However, after 12 years of age, boys had significantly larger orbital volumes (22.16±2.28 cm3/year vs 18.57±1.16 cm3/year, p<0.001) and a greater IORD (96.29±3.18 mm/year vs 91.00±4.54 mm/year, p<0.001) than girls.
Conclusions In Chinese children, the development of orbital volume follows a biphasic pattern and a sex difference becomes significant after the age of 12 years.
- Anatomy
- Orbit
- Child health (paediatrics)
- Imaging
This is an Open Access article distributed in accordance with the Creative Commons Attribution Non Commercial (CC BY-NC 4.0) license, which permits others to distribute, remix, adapt, build upon this work non-commercially, and license their derivative works on different terms, provided the original work is properly cited and the use is non-commercial. See: http://creativecommons.org/licenses/by-nc/4.0/
Statistics from Altmetric.com
Introduction
The dynamic development of orbital volume during childhood creates several challenges for paediatric surgeons in clinical work.1 ,2 The surgeon needs to refer to the normal value at a specific age to provide a sufficient ocular implant after removing orbital content. By doing so, the orbital bones can be adequately stimulated and this can preserve partial or even full development, which will reduce the risk of craniofacial deformation in adulthood.3–5 In addition, it is important to select the optimal timing of the surgery.6–9 If the condition starts during a period of fast development, it is preferable to perform the surgery as early as possible. However, if it happens during a period of slow development, it might be worth waiting for the child to become physically stronger before undergoing the risks of surgery. It is also important to know at which age separate standards should be used for boys and girls because of sex differences.1 ,2 ,10 ,11 Therefore, mapping out the normal developmental timing curve of the orbits during childhood is of great clinical significance.
Although several studies have been done in this field, some important controversies still exist. It is not clear if the orbital volume development follows a linear pattern with an even speed at any age, or if the developmental process has a certain phase with fast development and a certain phase with a slower speed. Although boys tend to have a larger orbital volume than girls, at which age the sex difference becomes significant is still debateable.1 ,2 ,10 ,11 Due to factors such as race, ethnicity and geographical locations, the normal developmental values collected from previous studies show large variations. There is relatively a lack of relevant data on the normal development of orbital volumes in Chinese children.10 ,12
Therefore, the aim of this study was to estimate the orbital volumes in Chinese children up to 15 years of age using a spiral CT scan that has high accuracy and good repeatbility. The collected data could help with answer to address the controversies in this field.
Methods
Subjects
The subjects, all of Han ethnicity, were children from many different parts of China who visited the Department of Ophthalmology at Tianjin Medical University for various ophthalmic diseases. CT scans were performed on each child. Children who had conditions that may disrupt the normal development of orbital structures, such as orbital lesions, craniofacial deformity or orbital fractures were excluded from the study. A total of 110 children were recruited, including 76 boys (69.1%) and 34 girls. The detailed breakdown of age and sex information is shown in table 1. All subjects and their guardians have been informed the details of the study and written consent forms were signed by their legal guardians.
Demographic information of the subjects
CT scan
The CT scans were performed on a double spiral CT (Prospeed, General Electronics, Chicago, USA). The voltage was set at 120 kV and the current was set at 150 mA. Each slice was 2 mm thick with a pitch distance of 1.5 mm to form a matrix of 512×512 pixels with a 200 mm field of view. Scanning was done in a horizontal orientation with the line connecting the external wall of the orbit and the external auditory canal was the baseline.13
Measurements
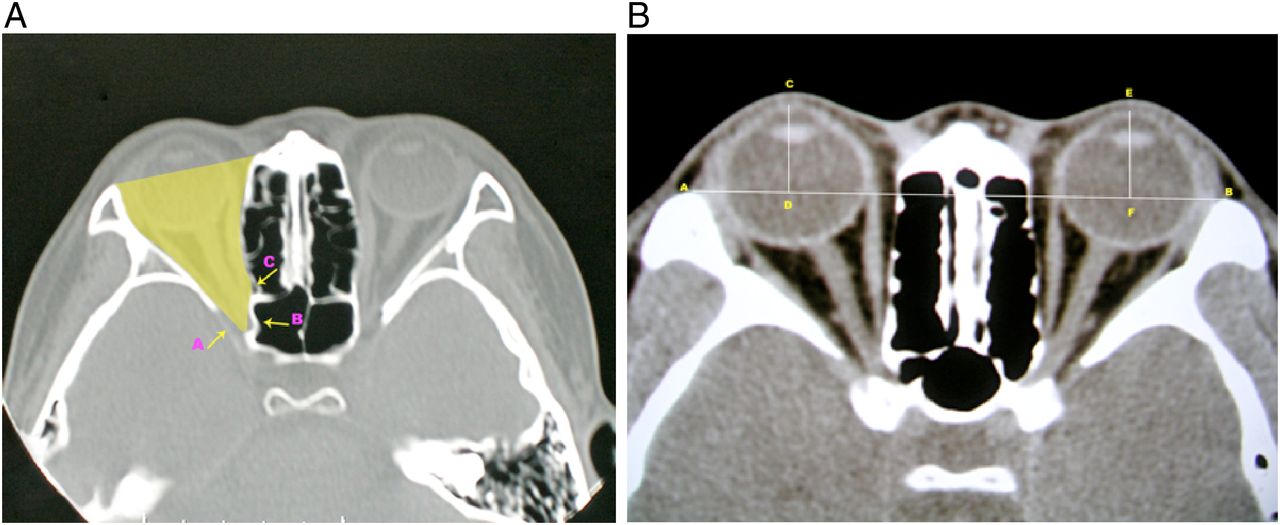
Orbital volume: For each slice of scanning, a viewing window was set at 2000×200 Hounsfield Units (HU) (width×height), and the graphic processing software that came with the CT machine was used to perform manual tracing of the orbital boundaries. The interface between the bone walls and soft tissue contents of the orbits was outlined. With the chosen setting, bone appeared as a high intensity signal, whereas orbital contents consisting of fat and muscle displayed a low signal, allowing clear identification of bone margins. Several areas of the orbit as appearing on the CT images required particular attention. The posterior limit of the orbit was defined by a line that connects the medial and lateral walls of the optic foramen within the orbit (arrow B in figure 1A). A transition line connecting the lateral wall to the orbital apex was drawn to outline the superior orbital fissure (arrow A in figure 1A), and a similar line was drawn to outline the lateral wall of the ethmoid sinus (arrow C in figure 1A). The anterior boundary of the orbit was defined by a line connecting the most anterior bone edges of the medial and lateral orbital walls. Once the boundaries were traced out, the graphic processing software could automatically compute the size of the enclosed area. Since the size of the enclosed area on each slice of the scan was already calculated and the thickness of each layer was also known, the orbital volume could be calculated with the following formula:14


CT images illustrating the method to estimate the orbital volume (A), interlateral orbital rim distance and the extent of exophthalmos (B).
The working window was set to 250×50 HU (width×height) to have high resolution. The level was set to the one having the largest diameter for both eyeballs, the centres of the crystal lens and the optic nerves showing the entire intraocular pathway, with the lateral orbital rim shown as the lowest points. All of the measurements were done on this level of scan. The interlateral orbital rim distance (IORD) is the distance between the orbital lateral edges. The distance can be measured as the line connecting the lateral side of the right orbit (point A in figure 1B) to the lateral side of the left orbit (point B in figure 1B). The extent of exophthalmos was calculated as the vertical distance from the corneal vertex to the line connecting the lateral sides of the two orbital rims. The distance from points C to D (figure 1B) is the extent of exophthalmos of the right eye, and the distance from point E to F is the left eye's exophthalmos.
Statistical analysis
In this study, SPSS V.12.0 statistical software was used to perform related statistical analysis. Least-square polynomial fitting and piecewise linear fitting was used to identify the different phases in development. An analysis of variance (ANOVA) test was applied to compare the values from different phases of development and post hoc comparisons were conducted with a Bonferroni correction. A t-test was used to compare the values obtained from boys and girls of the same age. A paired t-test was used to compare the values measured from the left and right orbits. A p value less than 0.05 was considered statistically significant.
Results
The developmental curve of orbits is not linear
The orbital volume was plotted against age to show the trend of development. Visual inspection suggested that the relationship between orbital volume and age is not a linear one. We fitted polynomial functions from the order of 1 (linear) all the way to the order of 12 and plotted the normalised sum of residual squares. The analysis indicated that a polynomial of fifth order was the best fit (figure 2B), having the smallest amount of fitting error. A polynomial function of fifth order was fitted and is shown in figure 2A. From the curve, it is clear that the development of orbital volume can be roughly divided into four different phases, a fast phase before age 3 years, a slow phase between ages 3 years and 6 years, a fast phase again between 7 years and 12 years, and another slow phase after 12 years of age.

Developmental trend of orbital volume. (A) Developmental data fitted into a polynomial function of the fifth order. (B) Fitting errors versus the order of polynomial functions.
To further quantify the growth speed of each phase, a piecewise linear fitting was established over the range of all ages. For all three measures (orbital volume (figure 3A), orbital width (figure 3B) and orbital protruding (figure 3C)), the development was fastest before the age of 3 years. Between 3 years and 6 years, the development of the orbit goes through a slow phase. At the age of 7 years, the developmental speed increased again up to 12 years of age. Afterwards (>12 years of age), it slowed down. Fittings to all three developmental measures were significant as indicated by the F values and p values in each panel of figure 3.

Piecewise linear fitting showing the developmental trend of orbital volumes (A), orbital width (B) and orbital protruding (C). In each panel, each circle represents a subject. Black lines represent the developmental trend and blue diamonds represent the mean value±SD of subjects in each of the developmental phases, outlined by the grey vertical lines.
Over the first 15 years of age, the orbit grew a lot, with a significant increase in orbital volume, IORD and the extent of exophthalmos (one-way ANOVA, p<0.001 in all three tests). The development of the orbital volume was fastest in the first phase (<3 years of age) with a slope of about 2.28. In the second phase (3–6 years of age), there was not much development at all with the slope close to zero. During the third phase (7–12 years of age), the development accelerated again with the slope increased to 0.67. In the last stage (>12 years of age), the development slowed down again with the slope reduced to 0.11 (table 2A and B). Similar patterns could be seen in the development of the IORD and exophthalmos, with the fastest development (steepest slopes) appearing before 3 years of age and the second fastest development appearing between 7 years and 12 years of age. The development in the other two phases was rather slow (table 2).
Statistics of orbital volume, interlateral orbital rim distance (IORD) and exophthalmos in the four developmental stages
The left eye and right eye have no differences during development
The values from the right and left orbits were highly correlated for both the mean orbital volume (r=0.98) and the extent of exophthalmos (r=0.96). In each developmental phase, a paired t-test revealed no statistically significant difference between the two sides (table 3).
Statistical comparison of orbits on the right side and left side
The sex difference in orbital development
The overall developmental trends were very similar in boys and girls. Both groups demonstrated a fast phase before 3 years of age, slow phases between 3 years and 6 years, another fast phase between 7 years and 12 years, and a final slow phase after 12 years of age. This developmental pattern was clear for orbital volume, IORD and the extent of exophthalmos.
However, there were some subtle differences between boys and girls during the course of development. In the first two fast phases (up to 6 years of age), there was no difference in orbital volume (p=0.227 and p=0.62, respectively). In the second fast phase (7–12 years of age), the difference between boys and girls started to increase, with boys showing a larger orbital volume. The difference was not quite significant (p=0.075, table 4). In the final slow phase (>13 years of age), the orbital volumes in the boys were significantly larger than those of the girls (figure 4A, p<0.001). A similar pattern could be found in the development of the interlateral orbital rim distance, with the difference between boys and girls becoming larger and reaching a statistically significant level after 12 years of age (figure 4B and table 4, p<0.001). For the development of the extent of exophthalmos, the difference between boys and girls never reached the significance level (figure 4C and table 4).
Statistics of orbital volume, interlateral orbital rim distance (IORD) and exophthalmos in the four developmental stages

Line plots showing the developmental trend of the orbital volume (A), interlateral orbital rim distance (B) and extent of exophthalmos (C). In each panel, each blue circle represents a boy and each grey triangle represents a girl. Blue and black lines represent the developmental trend of boys and girls, respectively. Blue and black diamonds represent the mean value±SD of boys and girls in each of the developmental phases, outlined by the grey vertical lines.
The correlation between orbital volume, IORD and exophthalmos
For the subjects studied in this project, their orbital volumes, interlateral orbital rim distances and the extent of exophthalmos were significantly correlated with each other linearly (figure 5). The correlation between the orbital volume and IORD was the strongest (R=0.83, p<0.01). In contrast, the correlations between the extent of exophthalmos and IORD and orbital volume were relatively weaker (R=0.69, p<001; R=0.49, p<0.01, respectively).

Scatter plots showing the correlations among orbital volume, interlateral orbital rim distance and exophthalmos. Each dot represents a subject and the straight line represents the best-fit regression line.
Discussion
Potential explanations for the biphasic development
Considering the development of structures close to orbits, the biphasic development of the orbital volume could potentially be explained in the following way. The first fast phase, before 3 years age, is mainly determined by the fast growth of facial bones, the eyeball and orbital bones. At birth, the cranium to face ratio is 8:1. By 5 years of age, it is reduced to 4:1, and stabilises to 2:1 in adulthood.15 The fastest development of the eyeball occurs within the first year, when it reaches an axial length of 22.5–23 mm. Between 3 years and 14 years of age, the eyeball only increases by 1 mm in axial length. For orbital bone growth, the first year after birth is often considered to be the critical period.2 ,10 The orbital bone develops most quickly during the first 3 years.3 ,16 During the second fast phase orbital development is closely related to the process of sinus pneumatisation.17 The ethmoid sinuses grow gradually to adult size by the age of 12 years. The maxillary sinuses are the first to develop. The growth of these paired sinuses is biphasic, occurring between 0–3 years and 7–12 years of age. This matched our biphasic development of orbital volume extremely well. The frontal sinus pneumatisation begins around 7 years of age, which also matches the start of the second phase.
Clinical implications
In the management of the nasolacrimal duct obstruction, one often has to choose between conservative medical therapy, probing and silicone intubation, and dacryocystorhinostomy (DCR).18 The reasons that some paediatricians may hesitate to perform DCR on children include the poorly defined and changing anatomy, rapidly growing facial bone, and a vigorous repair process producing hyperplastic scar tissue.19 Here, we reported that between 3 years and 6 years of age, the orbital growth is rather slow. That would provide a nice time window for the surgeon to perform DCR with less concern on the rapidly changing anatomy. Indeed, when performed by experienced lacrimal surgeons, DCR can achieve a high cure rate and low rate of complication in treating primary nasolacrimal duct obstruction.20
Exenterated orbit in childhood often experiences growth retardation as a result of reduced volume stimulus.21 Postsurgery radiation also contributes to the retardation by damaging the proliferative cells inside the growth plates.22 Our data showed that the orbit develops rapidly during the fast phase, particularly within the first 3 years of life. This agrees with the clinical observation that younger patients at the time of enucleation have exhibited greater deformities.23 Implants can largely reduce the growth retardation and ameliorate the orbital asymmetry. Therefore, during the rapid growth phase, it is critical to measure the orbital volume periodically and increases in implant size to reflect the increase in volume that naturally occurs with age.
Although Graves' disease is rare in children younger than 4 years old, it can seriously interfere with growth and development if not recognised and treated.24 Common symptoms are upper eyelid retraction, conjunctival injection, and proptosis and periorbital oedema. However, due to the fast growth in childhood, these symptoms may not be easily noticed. Therefore, early detection and high suspicion of Graves' disease become crucial. The younger the patients are, the closer is the monitoring required considering the rapid development in orbital structures during the first 3 years.
In our study, the strong correlation between the orbital volume and IORD may be attributed to the fact that both structures are primarily bony structures. In contrast, the correlations between exophthalmos and orbital volume were rather weak, although significant. The extent of exophthalmos is determined by the combination of several factors including orbital volume, soft content and the size of the globe. For exophthalmos seen in Graves' disease, it is the mismatch between increased orbital contents and normal bony orbital container. In non-syndromic exorbitism, it is the relatively small orbital capacity versus the normal volume of the orbital contents. High myopia is an aggravating factor due to the relatively larger size of the globe.25 Therefore it would be inappropriate to plan an orbital expansion or decompression procedure based on the extent of exophthalmos. Only a thorough analysis of the relationship between the orbital structure, the orbital content and the globe itself will help to create a rational treatment plan.
Conclusion
Our data revealed a biphasic development model of the orbital volumes, with most of the development happening within the first fast phase. Clinically, when considering the timing for any surgery involving craniofacial/orbital structures or orbital contents, it is important to reference the developmental phase. Since development of the orbit depends on the stimulation from the soft tissues located inside the orbit, in the fast phase, the surgery should be performed as early as possible to provide a sufficient implant. Hopefully the orbital bones can be adequately stimulated in order to preserve partial or even full development, with less risk of craniofacial deformation as an adult.
References
Footnotes
Contributors XQ had full access to all of the data in the study and takes responsibility for the integrity of the data and the accuracy of the data analysis. Study concept and design: XQ, NW and BZ. Acquisition, analysis or interpretation of data: all authors. Drafting of the manuscript: BZ and NW. Critical revision of the manuscript for important intellectual content: all authors. Statistical analysis: BZ and NW.
Competing interests None declared.
Patient consent Guardian consent obtained..
Ethics approval This study protocol was approved by the Institutional Review Board of the Tianjin Medical University.
Provenance and peer review Not commissioned; externally peer reviewed.
Linked Articles
- At a glance