Article Text

Abstract
Purpose Several genes causing autosomal-dominant cone-rod dystrophy (AD-CRD) have been identified. However, the mechanisms by which genetic mutations lead to cellular loss in human disease remain poorly understood. Here we combine genotyping with high-resolution adaptive optics retinal imaging to elucidate the retinal phenotype at a cellular level in patients with AD-CRD harbouring a defect in the GUCA1A gene.
Methods Nine affected members of a four-generation AD-CRD pedigree and three unaffected first-degree relatives underwent clinical examinations including visual acuity, fundus examination, Goldmann perimetry, spectral domain optical coherence tomography and electroretinography. Genome-wide scan followed by bidirectional sequencing was performed on all affected participants. High-resolution imaging using a custom adaptive optics scanning light ophthalmoscope (AOSLO) was performed for selected participants.
Results Clinical evaluations showed a range of disease severity from normal fundus appearance in teenaged patients to pronounced macular atrophy in older patients. Molecular genetic testing showed a mutation in in GUCA1A segregating with disease. AOSLO imaging revealed that of the two teenage patients with mild disease, one had severe disruption of the photoreceptor mosaic while the other had a normal cone mosaic.
Conclusions AOSLO imaging demonstrated variability in the pattern of cone and rod cell loss between two teenage cousins with early AD-CRD, who had similar clinical features and had the identical disease-causing mutation in GUCA1A. This finding suggests that a mutation in GUCA1A does not lead to the same degree of AD-CRD in all patients. Modifying factors may mitigate or augment disease severity, leading to different retinal cellular phenotypes.
- dystrophy
- imaging
- retina
- genetics
- degeneration
This is an Open Access article distributed in accordance with the Creative Commons Attribution Non Commercial (CC BY-NC 4.0) license, which permits others to distribute, remix, adapt, build upon this work non-commercially, and license their derivative works on different terms, provided the original work is properly cited and the use is non-commercial. See: http://creativecommons.org/licenses/by-nc/4.0/
Statistics from Altmetric.com
Introduction
Autosomal-dominant cone-rod dystrophy (AD-CRD) is a rare condition characterised by photoaversion, poor colour discrimination and progressive loss of visual acuity leading to legal blindness in older adulthood.1 Advances in molecular genetics have led to the discovery of at least five genes associated with AD-CRD, including guanylate cyclase activator A1A (GUCA1A), which encodes a guanylate cyclase activating protein, GCAP1.2 The essential role of GCAP1 in the visual cycle and its high level of expression in cone outer segments have been demonstrated using animal models and biochemical assays.3 Crystallography studies and computer modelling have shown evidence that disease-causing mutations in GUCA1A alter the calcium binding properties of GCAP1, resulting in persistent stimulation of guanylate cyclase in the dark and poor recovery from photobleaching.3
However, our understanding of how mutations in GUCA1A shape the retinal phenotype at a cellular level in human individuals with AD-CRD and ultimately lead to photoreceptor cell death has been limited by the rarity of the condition, the genetic and environmental heterogeneity in the human population, and our inability to assess single retinal cells over the time course of the disease. To date, the only cellular morphological data available for AD-CRD caused by mutation in GUCA1A have been derived from a single histopathological specimen of a 75-year-old patient, showing complete loss of cones in the central fovea and rare cones in the periphery.4 However, when and where the earliest cone losses occurred, and why the peripheral cones were spared remains unknown.
Adaptive optics (AO) imaging provides a method to obtain phenotypic information at the cellular level in AD-CRD and may help elucidate its pathological mechanism by non-invasive, high-resolution imaging of individual photoreceptor cells in the living eyes of affected individuals. AO imaging can detect cone loss before clinically significant vision loss5 based on in vivo measurement of cell density and spacing. We previously demonstrated reduced cone density and increased apparent cone diameter in a case report of a subject with CRD using a flood-illuminated adaptive optics (FIAO) system.6 Confocal adaptive optics scanning light ophthalmoscopy (AOSLO)7 provides improved resolution and image contrast over FIAO systems, permitting imaging of both rod8 and cone photoreceptors. AOSLO has revealed decreased cone density in a variety of retinal degenerations6 9 and has shown promise as an outcome measure for evaluating the efficacy of new treatments.10 In this study, we use AOSLO to evaluate disease changes and phenotypic variability in the photoreceptor mosaic of AD-CRD patients with the identical disease-causing mutation in GUCA1A.
Methods
Study participants and clinical examinations
The study was approved by the Research Subjects Review Board at the University of Rochester and was carried out in accordance with the tenets of the Declaration of Helsinki. Twelve members in three generations of a family with AD-CRD were recruited and gave informed consent to participate.
All study participants underwent a comprehensive ophthalmic evaluation, including ophthalmic history, visual acuity testing, slit-lamp and fundus examination. Fundus photographs (FF450 plus, Carl Zeiss Meditec), spectral domain-optical coherence tomography (SD-OCT, Bioptigen or Cirrus SD-OCT, Carl Zeiss Meditec) and Goldmann visual fields were obtained. Electroretinography (ERG, UTAS E-4000, LKC Technologies) was performed on selected participants in accordance with the recommendations of the International Society for Clinical Electrophysiology of Vision.
Nine family members were determined to be affected based on decreased visual acuity, macular atrophic changes, central scotoma and/or decreased photopic ERG amplitude. In all cases, disease status was determined before genotyping.
Molecular genetics
Affected study participants underwent molecular genetic testing. Genomic DNA was extracted from peripheral blood using standard techniques.11 A genome-wide scan was performed with Affymetrix microarrays (GeneChip Human Mapping 500K Array Set, Affymetrix, California, USA), which interrogated 238 000 single-nucleotide polymorphisms. Sample processing and labelling were performed using manufacturer’s instructions. The arrays were hybridised, washed and scanned in the University of Iowa DNA core facility. Array images were processed with GeneChip DNA Analysis software. Microarray data were analysed and multipoint non-parametric linkage scores were calculated using the Genespring GT software package (Agilent Technologies, California, USA). Pairwise linkage analysis using STRP markers was performed with the MLINK and LODSCORE programs as implemented in the FASTLINK version of the LINKAGE software package.12–14
DNA samples were tested for mutations in GUCA1A using bidirectional sequencing of PCR products that encompassed the entire coding sequence. Sequencing was performed using dye-terminator chemistry on an ABI 3730 DNA sequencer (Applied Biosystems, Foster City, California, USA). PCR amplification was performed with a standard protocol using primer sequences that are available on request.15 Identified sequence variations were evaluated as potential disease-causing mutations using standard criteria.16
AOSLO imaging
Selected study participants (three affected, three unaffected) underwent high-resolution retinal imaging with AOSLO according to published techniques.17 Cone and rod photoreceptor reflectance images were acquired according to published image acquisition and montaging methods, using 796 nm illumination and a 1.8 Airy disk diameter confocal pinhole.18 A strip of approximately 10°×1.5° along the nasal meridian was imaged in one eye of each study participant. The linear retinal magnification factor or the pixel size of the AOSLO image of each individual eye was calculated using the eye’s axial length measured with an IOLMaster (Carl Zeiss Meditec) and scaled to the Gullstrand model eye. Videos were registered and averaged using custom software19 and manually assembled into a continuous montage using Adobe Photoshop (Adobe Systems, California, USA). Cone photoreceptor locations were determined semi-automatically using a custom MATLAB program with manual correction.20 Rod photoreceptors were manually identified according to published criteria, including size and packing geometry.8 21 22
Statistical analysis
Cone and rod spacing was compared with published normative data. AOSLO normative data20 were used for cones at 200 µm retinal eccentricity and above, and histological data23 were used for rods and foveal cones. The sign test was used to compare photoreceptor cell spacing measurements to the normative data.
Results
Clinical features
Nine patients were identified to have CRD based on clinical criteria. These individuals were members of a four-generation pedigree demonstrating an autosomal-dominant pattern of inheritance, with multiple affected individuals in each generation and male-to-male transmission (table 1).
Clinical features of affected patients
Ophthalmic examinations showed patients in their teenage years had little to no visual acuity loss and subtle scotomas on Goldmann perimetry. Symptoms in this youngest generation included colour vision loss and photoaversion. Patients in their 40s had central scotomas and lost driving vision; those in their 60s were legally blind. Electrophysiology revealed loss of amplitude predominating under photopic conditions, but ranged from non-recordable to within normal limits, under both photopic and scotopic conditions. Eight of nine patients had central scotomas, and three of nine also had peripheral visual field constriction.
Representative fundus photographs are shown in figure 1. In the youngest generation, the fundus appearance was normal and indistinguishable from that of unaffected first-degree relatives. Patient III-1, aged 40 years, showed stippled retinal pigment epithelial (RPE) atrophy and patient II-6, aged 62 years, showed severe central macular RPE atrophy.

Autosomal-dominant cone-rod dystrophy progression. Top row: unaffected sibling IV-4 and affected patients IV-2 and IV-5, all teenaged, are virtually indistinguishable at funduscopic scale. Bottom row: III-1, age 40, shows stippled retinal pigment epithelial (RPE) atrophy. II-6, age 62, shows advanced RPE atrophy in the central macula. (A) Adaptive optics scanning light ophthalmoscopy at the margin of the atrophic area in II-6, indicated by the white square on the fundus photograph. No photoreceptors are identified.
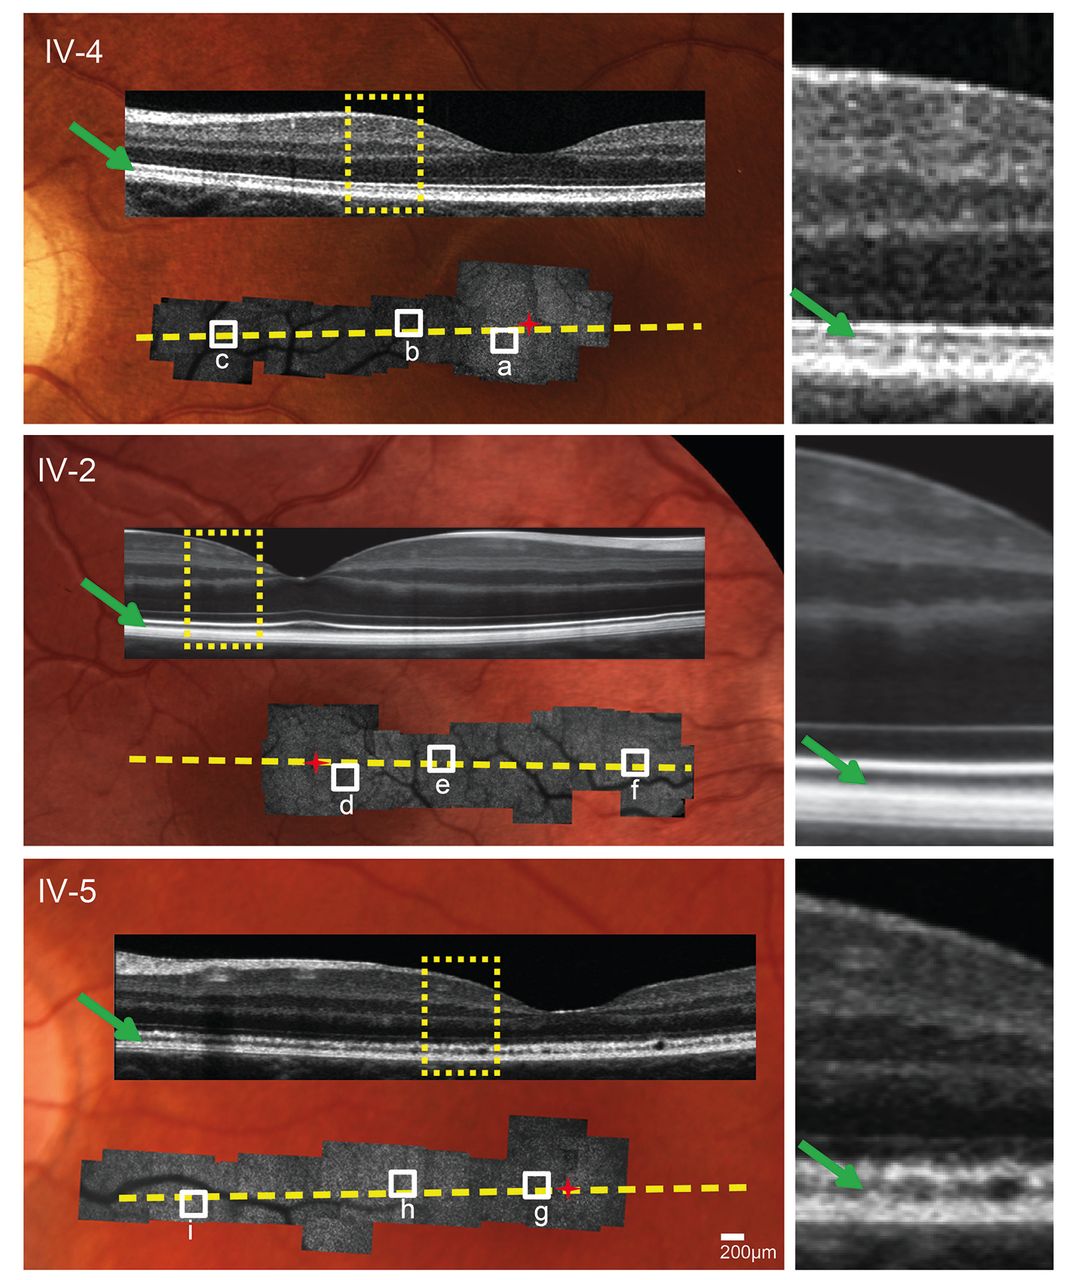
SD-OCT performed horizontally across the foveal centre showed a normal-appearing photoreceptor outer segment (POS) layer in patient IV-2 and a slightly granular appearance of the POS layer in IV-5 (figure 2).

Multimodal imaging. Adaptive optics scanning light ophthalmoscope (AOSLO) montages superimposed on fundus photographs with spectral domain optical coherence tomography (SD-OCT) overlay. SD-OCT photoreceptor outer segment layer (green arrows) appears healthy in unaffected sibling IV-4 and patient IV-2, and shows a subtle granular appearance in patient IV-5. Yellow dotted lines indicate locations of SD-OCT cross sections. Yellow rectangles indicate SD-OCT sections shown at higher magnification on the right. Red ‘+’ indicates foveal centre. White squares indicate AOSLO areas shown at higher magnification in figure 3.
Molecular genetics
Genome-wide scan indicated linkage to 6p21.1, the locus of GUCA1A (gene ID GUCA1A, RefSeq NM_000409). Bidirectional sequencing of GUCA1A revealed an insertion/deletion mutation at codon 143, c.428delTinsACAC, which has been previously reported to be associated with AD-CRD,24 segregating with disease.
AOSLO imaging
AOSLO imaging was performed on the nasal retinae of five teenage family members (three unaffected, two affected) and across the margin of the atrophic macular lesion of patient II-6, aged 62 years. AOSLO imaging of the three unaffected teenage siblings showed normal cone photoreceptor appearance and spacing. In the 62-year-old patient II-6, no normal appearing photoreceptors were identified within the macular lesion (figure 1A). Patients IV-2 (age 18) and IV-5 (age 12) had mild disease features based on symptoms and visual fields, with normal funduscopic appearances by conventional ophthalmoscopy. Both were confirmed to harbour the c.428delTinsACAC mutation at codon 143 in GUCA1A. Montages of the AOSLO images superimposed on the fundus photographs are shown in figure 2.
AOSLO images showed a regular, continuous cone mosaic in patient IV-2 (figure 3D–F, K), similar to that of his unaffected cousin, IV-4 (figure 3A–C, J). At these eccentricities, and with these imaging conditions, rod photoreceptors are not expected to be discernible in normal retinae and are not regularly identified at single-cell resolution in patient IV-2 (figure 3K) or his unaffected cousin IV-4 (figure 3J). In patient IV-5, the cone mosaic was severely disrupted. At 0.3 mm eccentricity, the cone mosaic was continuous, but with patchy areas of hypo-reflective cones (figure 3G). At 1.2 and 2.4 mm, individual cones appeared enlarged and were characterised by a having a ‘dark’ (hypo-reflective) centre, surrounded by a darker halo. Within this same region, rod photoreceptors were enlarged and were thus identifiable at single-cell resolution (figure 3H, I, L).
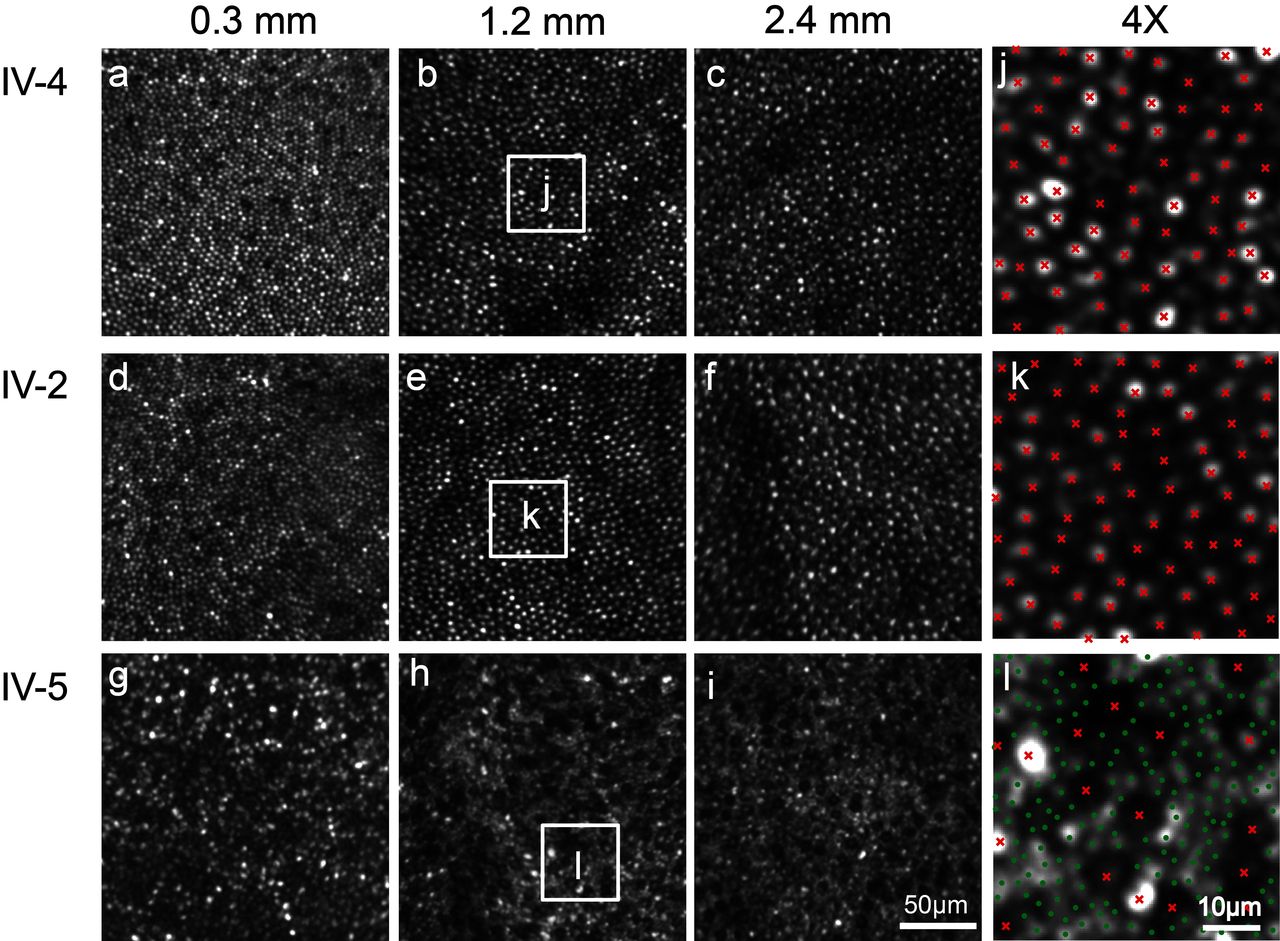
Photoreceptor mosaics. In unaffected sibling IV-4 and patient IV-2, adaptive optics scanning light ophthalmoscope shows a regular, continuous cone mosaic. Cone cell size increases with eccentricity, labelled in mm. In patient IV-5, the cones are enlarged, irregularly spaced and dark in appearance. Enlarged intervening rods are visualised. (J, K, L) 4× magnification of the areas indicated by the white squares. (Cones, red ‘x,’ rods, green ‘ .’)
Cone spacing measurements fell within the range of age-matched normative data for patient IV-2 and unaffected relatives IV-4, IV-6 and IV-7, but were significantly increased at all eccentricities measured for patient IV-5 (figure 4, top). Consistent with the qualitative appearance, rod spacing was increased for patient IV-5 compared with normative data (p=0.00003, sign test). Rod spacing diverged further from normal with increasing eccentricity, suggesting that rod losses were more prevalent in the peripheral retina in IV-5 (figure 4, middle). However, the ratio of cone spacing to rod spacing was increased relative to normal eyes (p=0.00007, sign test), indicating a predominant cone loss overall, as would be expected in a cone-rod dystrophy (figure 4, bottom).

Photoreceptor spacing. Top: cone spacing of patient IV-2 and unaffected siblings IV-4, IV-6 and IV-7 falls within 2 SDs of mean normative adaptive optics scanning light ophthalmoscope data, indicated by the solid lines. The cone spacing of patient IV- 5 is increased (p=0.001). Middle: rod spacing of patient IV-5 (dashed line, exponential fit curve) is increased compared with histological normative data (p=0.00003), with greater divergence at higher eccentricities. Bottom: The ratio of cone spacing to rod spacing in patient IV-5 (dashed line, exponential fit curve) is increased compared with histological normative data (p=0.00007), indicating that cone loss predominates over rod loss. CRD, cone-rod dystrophy.
Discussion
In two teenage cousins with AD-CRD and the identical disease-causing mutation in GUCA1A, standard clinical tests revealed minimal disease features only, whereas AOSLO imaging demonstrated substantial differences in their patterns of cone and rod cell loss. These findings provide evidence that a single mutation in GUCA1A does not uniformly lead to the same degree of AD-CRD. One possibility is that GUCA1A disease severity may be mitigated or augmented by modifying genes, analogous to the digenic mechanism for retinitis pigmentosa associated with the peripherin 2 (PRPH2) and rod outer segment protein 1 (ROM1) genes.25
In patient IV-5, the cone reflectance was diminished relative to surrounding rods, giving them a dark appearance. The presence of these ‘dark cones’ has been described by our group and others in a range of retinal degenerations17 18 26 and may represent cones with reduced outer segment length or cones that lack outer segments. This hypothesis is supported by split-detector AOSLO that shows preserved cone inner segments underlying dark cones.27 The dark cones described in this study are distinct from the ‘negative mosaic’ that has been described using off-axis alignment in FIAO.28
The increased rod spacing in patient IV-5 indicates that rod loss may be present in early disease and that rod loss in the peripheral retina may precede rod loss in the central retina. However, the increase in the ratio of cone spacing to rod spacing suggests that cone loss predominates rod loss overall. The apparent increase in photoreceptor cell size and spacing may represent a cellular response to disease or a diminished complement of photoreceptors from birth. Further study, including longitudinal evaluation of these patients, may help to resolve this question.
SD-OCT images showed a slightly granular appearance of the POS layer in patient IV-5, suggesting that SD-OCT can additionally be useful in characterising the phenotypic diversity of AD-CRD.
The presence of phenotypic diversity among individuals with familial retinal disease can yield important clues about how the causative gene leads to disease. The Y99C mutation in GUCA1A, which also affects calcium binding, has been reported to demonstrate variable expressivity in some cases but not in others.3 Potential modifiers could include variable activity of the second, wildtype allele of GUCA1A or the activity of other interacting proteins such as cGMP phosphodiesterase.
AOSLO imaging provides a method to distinguish phenotypes in AD-CRD at the retinal cellular level, a critical step towards the discovery of disease-modifying effects. Particularly in the case of rarely occurring retinal disease-causing gene mutations, for which histopathological data are scarce, AOSLO can provide insight into how genetic mutations shape the retinal cellular phenotype of the disease. The ability to use AOSLO longitudinally in genetically well-characterised patients affords an opportunity to discover factors influencing the course of disease. Identifying mitigating effects may provide valuable clues to potential treatments and advance our understanding of disease pathogenesis and the biology of the visual cycle.
Acknowledgments
The authors acknowledge Margaret Folwell and William Fischer for their technical assistance with fundus photography and data analysis.
References
Footnotes
Contributors HS made substantial contributions to the acquisition and analysis of the adaptive optics imaging data and drafting the work. EAR made substantial contributions to the acquisition and analysis of the adaptive optics imaging data and drafting the work. ES made substantial contributions to the acquisition and analysis of the genetics data and critically revised the work. LL made substantial contributions to the acquisition and analysis of the adaptive optics imaging data and drafting the work. DW made substantial contributions to the interpretation of the adaptive optics imaging data and critically revised the work. AD made substantial contributions to the design of the adaptive optics study, interpretation of the adaptive optics imaging data and critically revised the work. MC made substantial contributions to the conception or design of the work, the interpretation of data, drafting and critically revising the work.
Funding This work was supported by the National Eye Institute (EY021786, EY021669, EY001319, EY014375, and EY004367), Research to Prevent Blindness, Fight for Sight(ER) and the Burroughs Wellcome Fund (AD).
Competing interests DW is an inventor on licensed patents pertaining to the adaptive optics ophthalmoscope that are owned by the University of Rochester.
Patient consent Obtained.
Ethics approval Research Subjects Review Board at the University of Rochester.
Provenance and peer review Not commissioned; externally peer reviewed.