Article Text

Abstract
Background Small hard macular drusen can be observed in the retina of adults as young as 18 years of age. Here, we seek to describe the in vivo topography and geometry of these drusen.
Methods Retinal images were acquired in young, healthy adults using colour fundus photography, spectral domain optic coherence tomography (SD-OCT), reflectance flood-illuminated adaptive optic ophthalmoscopy (AO flood) and reflectance adaptive optic scanning light ophthalmoscopy (AOSLO) in both confocal and non-confocal split-detection modalities. Small bright yellow hard drusen within a 10 degree radius from the foveal centre were characterised.
Results Small hard drusen were seen on colour photographs in 21 out of 97 participants and 26 drusen in 12 eyes in 11 participants were imaged using the full protocol. Drusen were easily identifiable in all modalities, except a few very small ones, which were not visible on SD-OCT. On AOSLO images, these drusen appeared as round, oval or lobular areas (up to three lobules) of diameter 22–61 µm where cone photoreceptor reflectivity and density was decreased (p=0.049). This was usually associated with discrete thickening of the retinal pigment epithelium (RPE) complex.
Conclusion High lateral resolution imaging of small lobular hard retinal drusen suggests formation through the confluence of two or more smaller round lesions. The outline and size of these smaller lesions corresponds to 1–4 RPE cells. Prospective longitudinal studies are needed to determine the ultimate fate of small hard drusen and their potential relation to age-related macular degeneration.
- imaging
- macula
- retina
This is an Open Access article distributed in accordance with the Creative Commons Attribution Non Commercial (CC BY-NC 4.0) license, which permits others to distribute, remix, adapt, build upon this work non-commercially, and license their derivative works on different terms, provided the original work is properly cited and the use is non-commercial. See: http://creativecommons.org/licenses/by-nc/4.0/
Statistics from Altmetric.com
Introduction
Drusen are extracellular deposits that form between the retinal pigment epithelium (RPE) and Bruch’s membrane (BrM). Drusen define age-related macular degeneration (AMD).1 In epidemiological context, a lower limit of relevance for the diagnosis of AMD is usually set at a diameter of 63 µm and age 55 years or younger.1 Nevertheless, small, yellow lesions with sharp margins and a diameter <63 µm are common in younger adults and are called small hard drusen,1 to distinguish these lesions from drusen that are used for protocolised AMD diagnosis.2 3 That small, hard drusen may be a precursor of AMD is suggested by the observation that eyes with >8 per eye or small clusters of these lesions are at increased risk of eventually developing soft drusen and pigment abnormalities2 4 or larger drusen that meet the AMD definition of drusen.5 Numerous (≥20) small hard drusen have been reported to be a highly hereditary trait.3 6
While AMD-drusen have been studied in vivo and found to be associated with deflection, irregularity and partial loss of the overlying photoreceptors, which manifests in OCT cross-sectional images of the retina as attenuation of the reflectivity associated with photoreceptor layers,7 there are no comparable reports on small hard drusen. The long-term significance of small hard drusen in young adults remains to be investigated in detail.
The aim of the present study was to study in vivo the shape and size and distribution of small hard macular drusen, as well as their effect on the photoreceptor mosaic.
Materials and methods
Participants
Ninety-seven participants were recruited among optometry students at the University College in Kongsberg, Norway. All had spherical equivalent refractive errors within ±5.0 D, normal visual acuity (logMAR ≤0.20) and were in self-reported good ocular and systemic health.
The study was approved by the Regional Committee for Medical Research Ethics for the Southern Norway Regional Health Authority and was carried out in accordance with the principles in the Declaration of Helsinki.
Colour fundus photography and clinical examination
Clinical examination and fovea-centred, digital, 45-degree colour fundus photography (Topcon TRC-NW6S non-mydriatic fundus camera, Topcon, Tokyo, Japan) were performed in all participants in an initial session. Small hard drusen were identified by two trained graders (authors HRP and ML), and defined on colour fundus images as any yellowish bright element ≤63 µm in diameter whose shape, colour or proximity to any adjacent feature did not suggest any other possible classification than that of a small hard druse.3 We used a square grid with a radius of 10 degree with 1-degree spacing that was centred manually over the fovea on the colour fundus images using the freely available image editing software Gimp v2.8 (www.gimp.org) to specify the location of the drusen.
Participants with small hard drusen on fundus photography were invited to participate in a subsequent session including refractioning, slit-lamp biomicroscopy and multimodal retinal imaging. The clarity of the lens was evaluated using the Lens Opacities Classification System ΙΙΙ,8 and was graded to be lower than grade 1 for all participants. Refractive error and best-corrected logMAR visual acuity (BCVA) were measured at 6 m. Ocular biometry was measured with the IOL Master (Carl Zeiss Meditec AG, Jena, Germany).
Spectral domain optic coherence tomography
Volumetric images in eyes with drusen were acquired with spectral domain optic coherence tomography (SD-OCT) (Heidelberg Spectralis OCT, Heidelberg Engineering GmbH, Heidelberg, Germany). The imaging protocol included three volumetric scans (512 A-scans/B-scan); one centred over the fovea (30×5 degrees) and two over areas with small hard drusen (15×5 and 30×5 degrees). Each volume consisted of 49 B-scans 30 µm apart with size 1536×496 or 768×496 pixels, respectively. Twenty individual B-scans were captured, aligned and averaged during acquisition of each B-scan (TruTrack, Heidelberg Engineering). B-scans through areas with small hard drusen were exported to ImageJ.9 The lateral scale of the SD-OCT images was adjusted by multiplying the nominal scan length with the ratio between each individual’s axial length, obtained with the Zeiss IOL Master, and the OCT assumed axial length (24 mm).
All SD-OCT-derived measures were obtained semi-automatically with bespoke software implementing a method similar to that used by Park et al.10 Reflectivity values from five consecutive A-scans were averaged to construct each longitudinal reflectivity profile. Longitudinal reflectivity profiles from areas with drusen were compared with control areas 120–180 µm temporal and nasal from the boundary of the druse. The thickness of the RPE complex was defined as the distance between the interdigitation zone (IZ) and the RPE/BrM. The outer segment (OS) length was defined as the distance from inner segment (IS) ellipsoid zone (EZ) to the IZ, while the IS length was defined as the distance between the external limiting membrane (ELM) and EZ.11
Adaptive optics imaging
High-resolution Adaptive Optics flood (AO flood) images of the cone mosaic were acquired with the Kongsberg Adaptive Optics Ophthalmoscope ΙΙ with 840 nm light.12 High-resolution reflectance confocal and split-detector images were acquired with the Kongsberg Adaptive Optics Scanning Light Ophthalmoscope (AOSLO), a replica of that described by Dubra and Sulai13 and Scoles et al 14 constructed in collaboration with the Boston Micromachines Corporation (Cambridge, Massachusetts, USA). AOSLO, using 790 nm light (and repeated OCT imaging) was carried out 18–21 months after the initial AO flood and OCT imaging session.
For both AO flood and AOSLO imaging, the participants’ pupils were dilated with cyclopentolate 1% (Bausch & Lomb, Cyclopentolat Minims) eye drops instilled 20 min prior to imaging. A dental impression on a bite bar stabilised the head and provided stable pupil positioning. Multiple locations were imaged across the fovea, parafovea and perifovea (0–10 degrees and 0–5 degrees eccentricity along the horizontal and vertical meridian, respectively). Areas with known drusen locations were densely imaged at 0.5 degree increments. Confocal and non-confocal split-detector14 image sequences of 60–150 frames were acquired simultaneously using 1 and 1.75 degrees fields of view. Images were processed according to previously published methods.15–17
Image analysis and statistics
The registered and averaged images were scaled for individual retinal magnification ratio (in µm/degree) based on the Liou and Brennan eye model18 calculated with optical design software (Zemax EE, Radiant Zemax, Redmond, Washington, USA). Images were aligned manually with the corresponding infrared image acquired by the OCT using selected blood vessel landmarks. The hyper-reflective area that featured the small hard drusen was delineated on the AO flood images and size in µm was calculated with reference to the calculated scaling of each individual image.
Individual cones were identified via a semi-automatic algorithm previously described by Li and Roorda16 and validated by Garrioch et al.19 Cones observed on the split detector images were manually identified and marked. Cone density (cones/mm2) and mosaic regularity were measured directly over drusen and at four to six adjacent locations where a contiguous cone mosaic was clearly visible. Measurements were made within analysis windows of typical angular subtense 0.1×0.1 degrees to 0.13×0.22 degrees sized to enclose each small hard druse in all directions. The same size was used both over drusen and in the respective control area. The mosaic regularity was assessed by measuring the mean distance between a given cone and its nearest neighbour (NND) and by determining the percentage of cones with five to seven neighbours.17
Statistical analysis was performed with R (v3.2.4, package Coin20), R Foundation for Statistical Computing, Vienna, Austria.21 Each measure over a small hard druse was paired with measures of adjacent intact locations in the same eye and analysed using Wilcoxon signed-rank test. The difference in size of drusen visible on OCT compared with those that were not visible was tested with the Mann-Whitney U test. Correlations were assessed using Spearman’s correlation coefficients (rs). Differences were considered significant when p value was ≤0.05.
Results
Subject demographics and clinical data
Small hard macular drusen were identified on colour fundus photographs in 21 (8 males, 13 females) of the 97 participants aged 19–36 years. Table 1 shows the frequency and distribution of drusen across the fovea, parafovea and perifovea. Of the 21 participants with drusen, 11 (mean age (±SD) 22.6 (4.9) years) volunteered for OCT and AO imaging resulting in a total number of 26 investigated (table 2) drusen in 12 eyes.
Frequency and distribution of drusen in the fovea, parafovea and perifovea in 21 healthy participants with small hard drusen in at least one eye on colour fundus photographs
Demographics of 11 healthy participants who underwent high-resolution fundus imaging
In vivo characteristics of small hard drusen imaged with AO flood
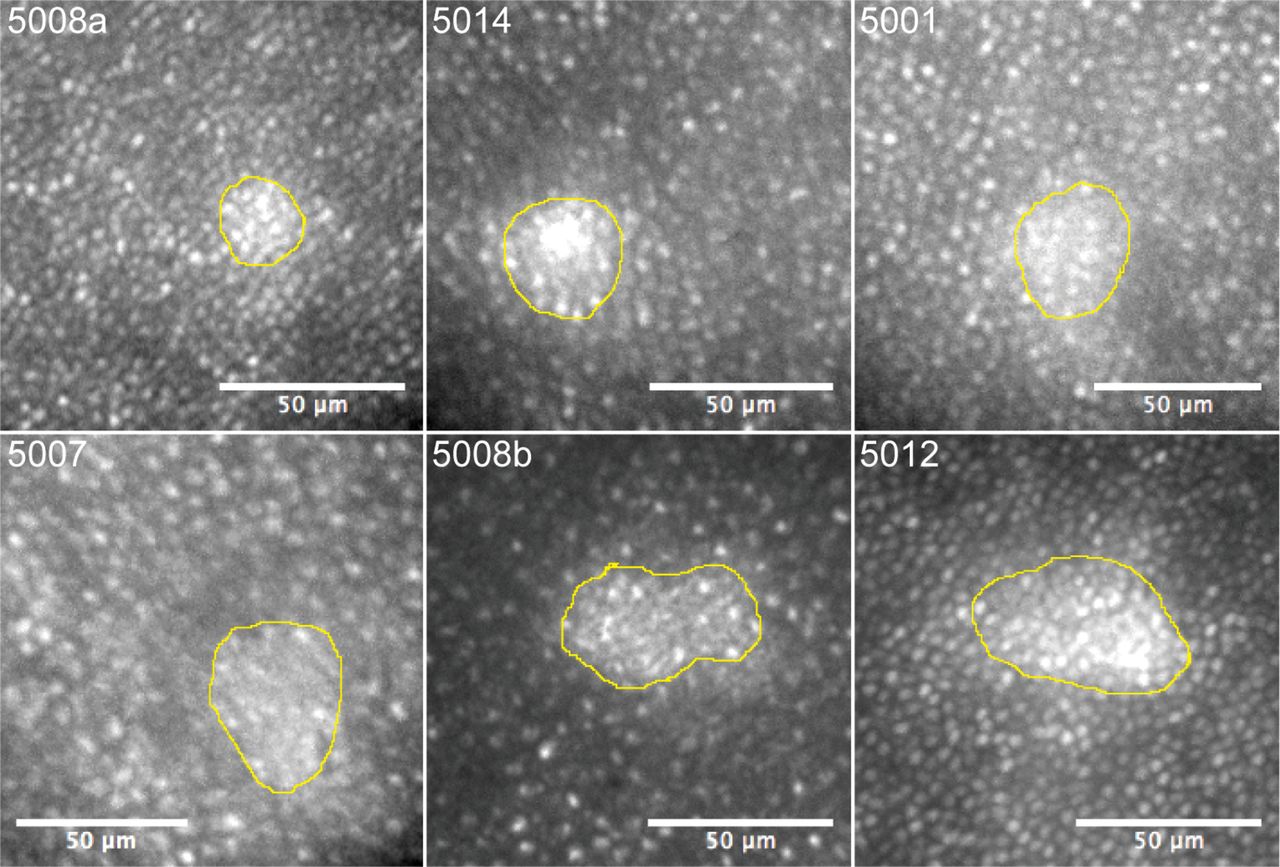
Small hard drusen (figure 1A) appeared as hyper-reflective, round to oval or lobular elements with smooth borders (figures 1 and 2) on AO flood images. The largest linear diameter ranged from 22 to 61 µm (mean 35.5 µm) and the smallest linear diameter from 22 to 40 µm (mean 29.8 µm) (table 3). The larger drusen were typically more elongated and lobular with asymmetric largest-to-smallest linear diameter ratios (≥1.2, calculated from third and fourth column, table 3). A positive correlation was found between largest-to-smallest linear diameter ratio and druse area (rs=0.75, p=0.002).

Multimodal image montage of a small hard druse (49 µm) in left eye of a female aged 19 years (participant 5007). Colour fundus photograph (A) show small hard drusen (arrows). SD-OCT B-scans were taken along the yellow line on the infrared image (B). The white box represents the area of the AO flood image (C). Segment (D) show the druse located within the retinal pigment epithelium (RPE) complex at 2° temporal/4° superior retinal eccentricity. Line plots represent reflectivity profiles through the corresponding OCT image at the location of drusen (black arrow in (A), solid yellow arrow and black line in (D)) and control area (dashed arrow and dashed line in (D)). The gap in the interdigitation zone band (IZ: red arrow) corresponds with the hyporeflective area in the cone mosaic in the AO flood image (C). ELM, external limiting membrane; EZ, ellipsoid zone; ILM, internal limiting membrane.

AO flood images of cone mosaics showing six small hard drusen of different size, delineated by the yellow boundary line, at different retinal eccentricities in five eyes. The small hard drusen are shown in ascending order according to the largest linear diameter for each participant ID. 5008a: 22 µm; 5014: 33 µm; 5001: 41 µm; 5007: 49 µm; 5008b: 55 µm; 5012: 60 µm. Some of the small hard drusen had a lobular appearance (5008b and 5012) suggesting formation through the confluence of two or more smaller drusen.
Individual druse size, appearance of drusen and cone photoreceptor metrics calculated from AO flood images and SD-OCT
AO flood images of 14 drusen were of sufficient quality to be included in the cone density and mosaic regularity analyses, and showed a contiguous photoreceptor mosaic across the area of the druse. Three drusen (all >40 µm) appeared as hyper-reflective lesions surrounded by discontinuous hyporeflectivity. The mosaic revealed loss of cone OS reflectivity in this dark border zone (figure 1C). Photoreceptor changes were not detected on SD-OCT, except for one druse (5007, OS), where the hyporeflective halo corresponded to a disruption of the IZ band (figure 1D). Using paired, within-eye analyses, the cone density directly over drusen was found to be significantly decreased compared with the control areas located around the drusen (Z=−1.978, p=0.049). The average NND was shorter for the cones overlying drusen (median 5.3 µm, IQR 4.6–5.8 µm) compared with cones located around drusen (median 5.7 µm, IQR 4.7–5.9 µm, p=0.051). The percentages of cones with five to seven neighbours were the same for cones overlying drusen (90.0%) compared with cones located around drusen (92.8%). Qualitatively, however, it appeared that there were more variation in cone mosaic regularity at the border of some of the small hard drusen (figure 3).

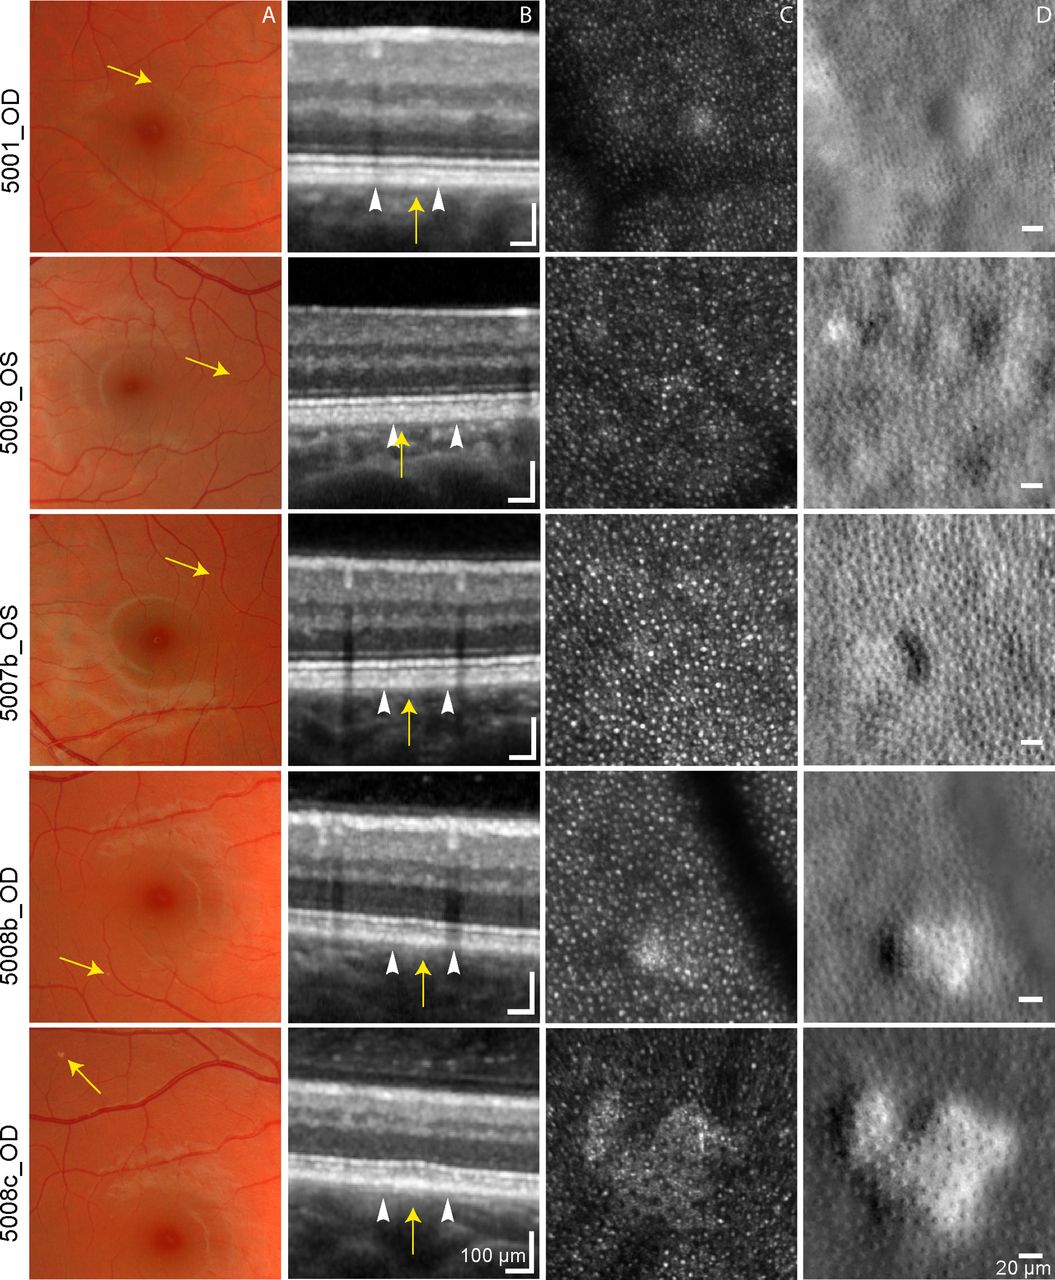
Multimodal image montage of small hard drusen of varying sizes and appearance. Fundus images (A), SD-OCT (B), AOSLO confocal (C) and AOSLO split-detection (D) images showing drusen (yellow arrows) of varying sizes and appearance (round, oval, lobular). White arrowheads (in B) denote the outer edges of the region imaged in C and D. Largest linear diameter: 5001_OD: 32 µm; 5009_OS: 27 µm; 5007b_OS: 49 µm; 5008b_OD: 55 µm; 5008c_OD: 123 µm. Participant 5009 had multiple drusen located within the same area. The largest druse (123 µm) was located outside the central 20° (5008c) and was not included in the analyses, but is included in the figure to show the typical multilobular appearance of a larger druse.
In vivo characteristics of small hard drusen imaged with AOSLO
In the confocal images, small hard drusen (figure 3A) appeared as slightly hyper-reflective lesions (figure 3C). In the split-detector images (figure 3D), the small hard drusen were clearly visible and delineated. As size increased, the appearance of the drusen seemed to change from round to oval, then lobular (figure 3). The cone IS were clearly resolved over the drusen, and a comparison between the confocal and split-detector images revealed good correspondence. Nevertheless, split detector images revealed on average 6% (range 0%–10%) more cone IS over drusen and 3% (range 0%–5%) around drusen than the confocal images.
Three (5001os, 5007a and 5008b) of the 15 drusen appeared as hyper-reflective lesions surrounded by discontinuous hyporeflectivity. Reflective cones were not observed on confocal images within the hyporeflective regions in these images (5008b; figure 3C).
In vivo characteristics of small hard drusen imaged with SD-OCT
Seven small hard drusen were visible on OCT (size 27–61 µm) and appeared as dome-shaped focal thickening of the RPE complex of 4–8 µm (table 3) well within the axial resolution of the Spectralis OCT.22 This thickening affected the overlying photoreceptor layer with a small inward displacement of the EZ band (figures 1B, C and 3B). OCT-visible drusen had a larger linear diameter on AO (median 41 µm, IQR 32–55 µm) than those that were not visible on OCT (median 27 µm, IQR 24–33 µm, p=0.036).
One druse associated with a localised irregularity near the IZ showed a small disruption adjacent to the druse which corresponded with the hyporeflective region surrounding that druse on AO images (figure 1). Colour fundus photographs from one eye showed multiple drusen located within the same area (figure 3, 5009_OS), which corresponded with a granulated RPE complex on OCT.
Longitudinal reflectivity profile analyses revealed a significantly thicker RPE complex in drusen areas (median thickness 25 µm) compared with control areas (median thickness 21 µm, Z=2.366, p=0.016). Photoreceptor IS and OS layer thicknesses did not differ between drusen (median IS and OS length 29 and 25 µm, respectively) and control locations (median IS and OS length 28 and 25 µm, respectively), both p=0.750.
Discussion
This first in vivo study of small hard drusen shows that they have a round, oval or lobulated outline depending on size, suggesting that the drusen have formed as a result of the confluence of two or three smaller merging drusen (see figure 2 in Rudolf et al 23). The size of the smallest lesions and the individual lobules of larger lesions were found to correspond to the size of a single RPE cell reported in histological studies.24 This has lead us to hypothesise that the elementary unit of dysfunction, associated with small hard drusen, corresponds to one to four RPE cells. The overlying photoreceptor mosaic was irregular and had abnormal reflectivity, characteristics that are comparable with that reported from histology for drusen <63 µm, although from older subjects and without fundus photographic correlation.22 25
The observed RPE thickening is similar to that described in both in vivo26 and histological studies of AMD drusen of size >63 µm,1 including displacement of the EZ band.27 Histological studies have also shown that drusen down to 12 µm cause displacement of photoreceptor OS.22 This is in line with the observed relative attenuation of cone density over the small hard drusen combined with mosaic irregularities; a subtle characteristic observed in some pathological conditions even when cone density is within normal limits.28 Cone mosaic irregularity and reduced cone reflectivity has been observed over large AMD drusen27; here, it is also observed for drusen <63 µm.
A discontinuous zone of hyporeflectivity was detected in reflectance confocal AOSLO around three of the larger small hard drusen. This zone was associated with little or no reflectivity from the cones in AO flood images and a small disruption of the IZ on OCT (figure 1C and D). The altered reflection is likely due to the OS being tilted away from their normal orientation by an underlying druse (caused by decreased waveguiding of cones due to the Stiles-Crawford effect29). An alternative explanation may be that the drusen have given rise to a diffuse loss of photoreceptors. The confocal modality relies on the waveguided light from the cone OS, while the split-detector modality reveals the mosaic through multiple-scattered light from the cone IS, independently of whether a cone has normal reflectivity or not.14 Thus, a reduction in reflective cones on these images could be caused by deflection of cone OS and poor waveguiding.30 When it corresponds with loss of IS on split-detection images, it implies a diffuse loss of cones.
The focal lesions, corresponding to drusen, reported here, were unlike the surrounding normal retina. Because cone photoreceptors were visible in the hyper-reflective area of the drusen and because small hard drusen were associated with focal thickening in the RPE complex, we surmise that the localised increase in reflectivity is found in or near the RPE. Furthermore, the sizes and lobular shapes of the larger drusen suggests that they formed through the confluence of two or three smaller drusen or by formation of a new hoard next to an initial hoard, each site affecting a separate elementary unit of the retina. It is striking how well the hexagonal shape and size of RPE cells (10–20 µm) reported in histological studies24 match the size and shape of the smallest hard drusen (or a single lobule within a hard drusen) documented in this study.
Small hard drusen rarely attract the retina expert’s attention in clinical practice, because they are of no documented clinical significance. Small hard drusen occasionally give rise to confusion when new staff are trained to evaluate fundus photographs from diabetic retinopathy screening clinics, because they share the appearance of hard exudate. An expert, however, will be able to observe the difference, because hard exudate occurs in characteristic patterns and in relation to sources of vascular leakage. The results of the present study give no reason to add anything to existing clinical examination routines based on colour fundus photography. For the scientific study of small hard drusen, however, AO imaging is clearly of benefit, because the increase in lateral resolution allows distinction between lesions of different size and shape, which could potentially be related to lesion growth. To this, OCT adds the information that only some small hard drusen are associated with RPE thickening.
Conclusion
In the present study, small subclinical drusen were associated with altered retinal reflectivity in AO fundus images of the outer retina. Small hard macular drusen in young adults are fundus lesions that are poorly understood in terms of their pathogenesis, composition, development over time and future clinical significance. Information about RPE cell diameters and their distribution found in electron microscopy studies of the human retina show an interesting resemblance with the size and shape of the small hard drusen seen with AO in this study. This suggests that small, hard drusen could arise from single RPE cell lesions or lesions of a small cluster of two to three adjacent RPE cells.31–33
References
Footnotes
Contributors HRP, RCB, ML and ICM were involved in the conception and design of the study. HRP, SJG, AD, ML and RCB were involved in the analysis and the interpretation of the data. HRP and RCB were involved in the data collection, literature research and writing the first drafts of the manuscript. HRP, SJG, AD, ICM, ML and RCB were involved in the critical revision and final approval of the article.
Funding The study was funded by the University College of Southeast Norway.
Competing interests None declared.
Provenance and peer review Not commissioned; externally peer reviewed.