Article Text

Abstract
Background Refractive error is an increasing global public health concern that requires robust and reliable research to identify modifiable risk factors and provide accurate estimates of population burden. We investigated the impact of reclassification of individuals when using different threshold values of spherical equivalent (SE) to define myopia, on estimates of frequency, distribution and associations with risk factors, to inform current international initiatives to standardise definitions.
Methods A random sample of 1985 individuals from the 1958 British birth cohort, at age 44, had autorefraction and self-reported on educational attainment and social class.
Refraction status assigned in three different models using SE: (A) moderate to high myopia −3 diopters (D) or more extreme (≤−3.00D), (B) hypermetropia +1.00D or more extreme (≥+1.00D) and (C) mild myopia using three different thresholds: −1.00D, −0.75D or −0.50D, hence reciprocal changes in definition of emmetropia.
Results Frequency estimates and associations with risk factors altered significantly as the threshold value for myopia moved towards SE 0.0D: prevalence of mild myopia increased from 28% to 47%, the association with highest educational attainment attenuated and with higher social class strengthened, with changes in risk ratios of approximately 20%.
Conclusion Even small changes in the threshold definition of myopia (±0.25D) can significantly affect the conclusions of epidemiological studies, creating both false-positive and false-negative associations for specific risk factors. An international classification for refractive error, empirically evidenced and cognisant of the question(s) being addressed and the population(s) being studied, is needed to serve better translational research, practice and policy.
- refractive error
- myopia
- threshold values
This is an open access article distributed in accordance with the Creative Commons Attribution Non Commercial (CC BY-NC 4.0) license, which permits others to distribute, remix, adapt, build upon this work non-commercially, and license their derivative works on different terms, provided the original work is properly cited and the use is non-commercial. See: http://creativecommons.org/licenses/by-nc/4.0/
Statistics from Altmetric.com
Introduction
Recent projections suggest that by 2050 about 50% of the adult population worldwide will have myopia, specifically 10% with high myopia.1 The need for robust and reliable research identifying modifiable risk factors and providing accurate estimates of population burden—to inform prevention, intervention and public health services—is greater than ever. However, meaningful comparison of studies across populations and over time is hampered by the absence of an empirically developed classification system for refractive error that takes into account the study context, variability of thresholds between studies and the lack of statistical validation of a chosen threshold in terms of the biases that can be introduced by small changes in dioptric thresholds.
The conventional approach in epidemiological research is to define refractive error using spherical equivalent (SE), a continuous measurement variable on which arbitrarily selected threshold values are superimposed to categorise myopia and hypermetropia as distinct states/conditions. This risks a systematic (non-random) reclassification of individuals due to the shape of the population refraction distribution curve. For example, reducing the threshold from −0.75 to −0.50D, a small change of 0.25D, dilutes the pool of ‘real’ myopes by classifying as myopes a large number of emmetropic subjects whose refraction sits within the margins of measurement error of refraction. There has been scant formal consideration in the research literature of the impact of this bias and the challenges it poses to identifying reproducible associations with risk factors and delineating trends across populations and over time within populations.
We investigated the impact of different threshold values for defining myopia on frequency, distribution and associations with key risk factors within a single study. We provide empirical data to stimulate discussion of the approaches used in ophthalmic epidemiology and to encourage the development of an international taxonomy that serves translational research, practice and policy.
Methods
Study population
The 1958 British birth cohort originally comprised everyone born in Britain in 1 week in 1958. Cohort members have been followed since using serial clinical examinations and/or face to face interviews carried out by trained examiners. Diverse and detailed biological, social and lifestyle data have been collected. A random subsample underwent autorefraction using the Nikon Retinomax 2 without cycloplegia as part of a broader biomedical examination of the entire cohort at age 44/45 years.2 Refraction of all subjects was precluded by equipment costs and cycloplegia prohibited by ethics approvals.
We undertook a series of analyses of associations between refractive error (mild myopia, moderate to severe myopia and hypermetropia) and the key risk factors of educational attainment and social class, using three prespecified minimum SE thresholds to define mild myopia. We examined any resultant change in size and composition of both the mild myopia and emmetropia (ie, reference) groups and the impact of these changes on frequency and associations. Although the composition of the moderate to high myopia and hypermetropia groups remained constant, we also evaluated the impact on associations for these states, by virtue of changed composition of the reference group. Models are reported unadjusted and adjusted for gender, highest educational qualification and social class status.
Categorisation of refractive error
Refractive status was defined for three different threshold values for myopia as shown in figure 1. Definitions of moderate to high myopia (SE −3.00D or more extreme,≤−3.00D) and hypermetropia (SE +1.00D or more extreme, ≥+1D) were the same in each analysis/model. Mild myopia was defined as: SE −1.00 to −2.99 D (model 1), –0.75 to −2.99D (model 2) and −0.50 to −2.99D (model 3). Thus, definition of emmetropia, the reference category, was defined as: −0.99 to +0.99D (model 1), –0.74 to +0.99D (model 2) and −0.49 to +0.99D (model 3).
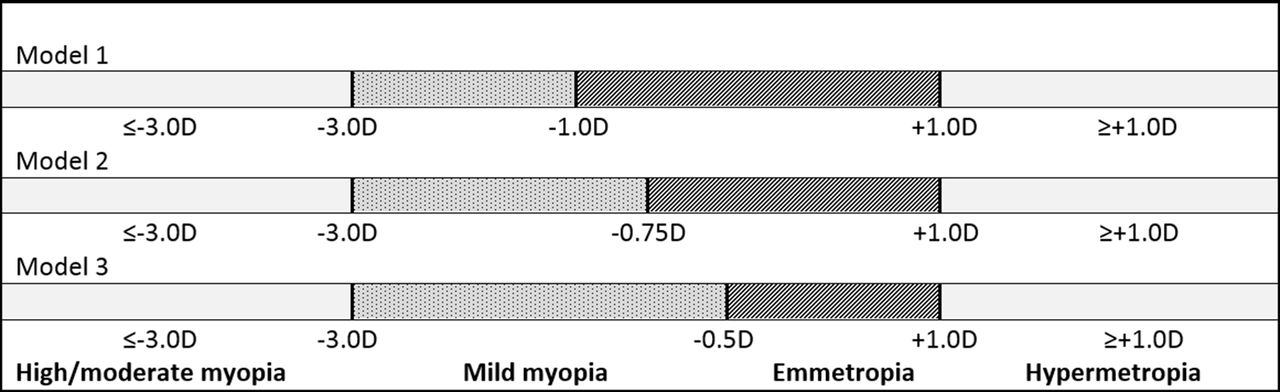
Refraction status for models using three different threshold values for myopia.
Environmental risk factors
For simplicity, we selected two well established risk factors for myopia to most easily illustrate the impact of changing the SE threshold for definitions. Highest educational attainment was categorised as: less than O levels (no examination passes on leaving school), O levels (examinations at 16 years in the UK), A levels (examinations at 18 years in the UK) and higher education (degree and/or further education equivalent). Occupational social class, at age 42 (Registrar General Classification) was dichotomised as non-manual (higher social class) or manual.
Statistical methods
We used mean SE of the two eyes for each individual for estimation of frequencies of refractive error and descriptive statistics on the study sample, to allow comparison with the literature.3 4 For the analyses of associations between refractive status and risk factors, we used SE for each eye and bivariate multinomial regression using sandwich variance estimates to model the paired data (two eyes) to allow for correlation within individuals, thus maximising use of available data. We undertook univariable and then multivariable analysis and report relative risk ratios with 95% CIs for each analysis/model shown in figure 1. Analyses were carried out using Stata V.13 (STATA, Texas, USA).
Results
The study sample comprised 1985 individuals who underwent autorefraction and had complete data on all risk factors. The full sample is detailed elsewhere.5 Individuals who had undergone refractive laser surgery and whose prior refractions were unknown (n=7) and those with interocular discordance, defined as an absolute difference of SE >2D across the range SE −1D to SE +1D, were excluded (n = 9).
Impact on prevalence of refractive error
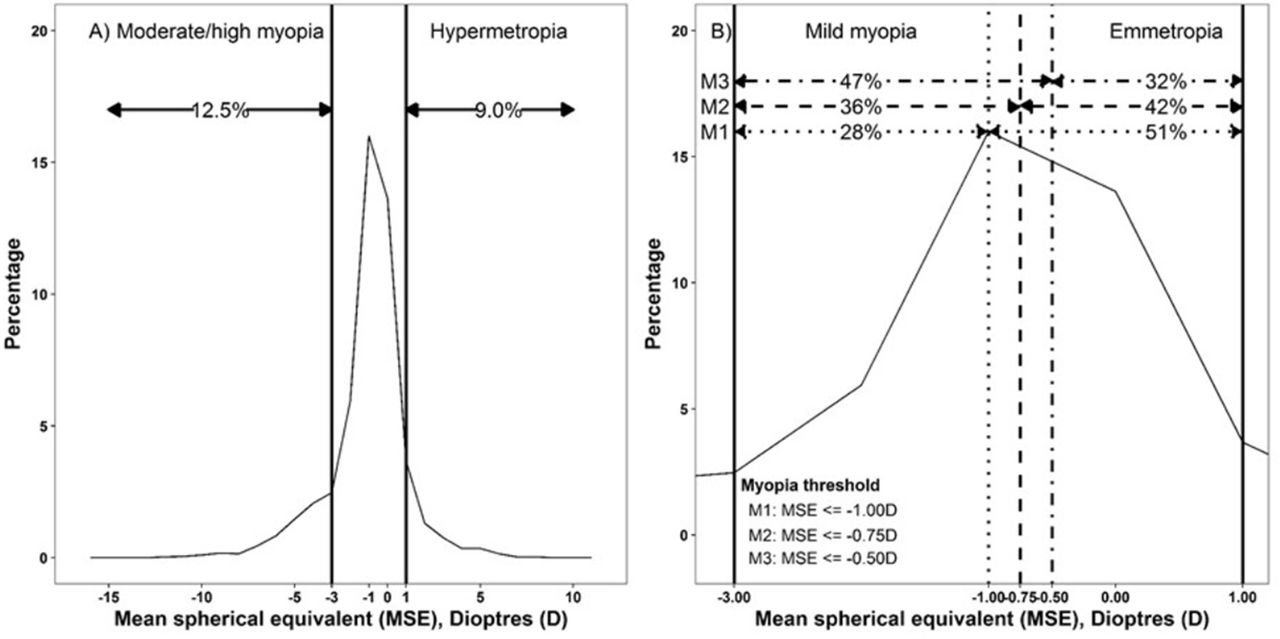
The marked impact of changing the minimum threshold for myopia on prevalence estimates is shown in figure 2. Estimates of mild myopia were 28% (26 to 30), 36% (34 to 39) and 47% (45 to 49) and of emmetropia 50% (48 to 53), 42% (40 to 44) and 31% (30 to 34), in models 1–3, respectively (figure 2B). As the thresholds for moderate or high myopia and hypermetropia did not change, prevalence estimates for each were the same in each model: 13% (95% CI 11 to 14) and 9.0% (8 to 10), respectively (figure 2A).

Distribution of SE (A) overall and (B) for mild myopia and emmetropia (range >−3.0D to <+1.0D), using myopia threshold values: −1.0D (model 1), –0.75D (model 2) and −0.5D (model 3). D, dioptres; MSE, mean spherical equivalent; SE, spherical equivalent.
Impact on distribution of social class status and educational attainment
Table 1 and figure 3 illustrate how changing the minimum threshold for defining myopia changed the distribution of the two risk factors within the sample and, in particular, the significant impact of these changes on the size and composition of the reference group (emmetropia). For example, the overall frequency of those of lower social class (manual occupation) among those with mild myopia vs emmetropia was 17% vs 24% in model 1 increasing to 19% vs 26% in model 3 (table 1).
Distribution of education and socioeconomic status by refractive error, by different thresholds for myopia

Distribution of sex, educational attainment and socioeconomic status (row percentages) by refraction status: mild myopia −1.0D to <−3.0D (model 1), ‘reclassification’ groups −0.75D to <−1.0D and −0.5D to <−0.75D and emmetropia >−0.5D to <+1.0D.
However as figure 3 shows, these moderate overall differences mask a notable difference in the proportion of individuals in the lower social class in the groups who would be ‘reclassified’ in different analyses. Similarly, the overall frequencies in the educational attainment categories by myopia and emmetropia across the models (table 1) are moderate but, for example, there is a considerable shift in the distribution by education category in those with a SE measure between −0.50D and −0.74D compared with the other refraction categories (figure 3). The likely difference this will make to the estimates of association between myopia and educational attainment will depend on the threshold used, that is, whether these individuals are assigned to the myopia or emmetropia group.
Impact on association of social class status and educational attainment with risk of myopia
Although the moderate/severe myopia category comprised the same individuals in each model, the changing composition of the comparator group nevertheless meant that the relative risk of moderate/severe myopia for those in the higher social class (non-manual occupation) increased by 21% from 1.80 in model 1 to 2.01 in model 3, solely due to reclassification. The relative risk of mild myopia with higher social class similarly increased from 1.24 to 1.38, tipping into ‘statistical significance’ with the increasing power in models 2 and 3 (table 2).
Associations between moderate to severe myopia, mild myopia and hypermetropia, and highest educational attainment and adult socioeconomic status, using three minimum threshold values for myopia
The strong positive association between higher educational attainment and relative risk of moderate/severe myopia was evident in all models though the point estimate decreased from 3.75 to 3.55 in models 1 and 3, respectively. Since all relative- risk ratios were relatively large (with P<0.001), the interpretation of these results would remain the same regardless of comparison group threshold. However, the risk estimates for mild myopia were less robust to the impact of reclassification, with a 39% decrease in relative risk ratio from 1.57 (model 1) to 1.18 (model 3) with a loss of statistical significance (P>0.05) in model 3. The size of the decline in relative risk ratios was greater between models 1 and 2 than between models 2 and 3.
Impact on association of social class status and educational attainment with risk of hypermetropia
The impact of change in the comparator group was also evident in the analysis of associations with hypermetropia. The relative risk of hypermetropia with lower social class increased from model 1 to 3. However, none of these point estimates nor any for associations with educational attainment were significant at a 5% level (table 2).
Discussion
Our reanalysis of population-based refraction data of 1985 individuals from the 1958 British Birth Cohort study has demonstrated that small variations (±0.25D) in the threshold for defining myopia can significantly alter the conclusions drawn regarding associations with risk factors. Using less stringent thresholds of itself resulted in a near doubling of prevalence, which may have been further amplified if mean SE had not been used. Alongside this, there was a significant increase in the effect size of the positive association with higher social class, with the decrement in P value (tipping it below 0.05) and a significant decrease in the effect size of the positive association with higher educational attainment with increment in the P value (tipping it over 0.05). Despite the unaltered composition of the moderate/severe myopia category, similar trends in effect size occurred, through the indirect pathway of change in size and composition of the reference (emmetropia) group. Thus, we have demonstrated that any study of myopia can render meaningfully different findings, necessitating different interpretations, depending on the minimum threshold of SE used to define myopia.
Our study is of intermediate size which may have limited the ability to investigate associations of risk factors with hypermetropia. However, refraction status was ascertained at a stage of natural history (at an age) which minimised potential misclassification of later onset or secondary myopia. A doubling of prevalence estimates due to reclassification alone would have significant implications for understanding time trends or planning services when comparisons need to be made with retrospective data or findings from historical studies. More importantly, the 14% to 21% difference between estimates of risk ratios of values <2.0 are consistent with the magnitude of change investigated in randomised controlled trials of interventions, underlining that these are clinically meaningful disparities in associations.
It is uncommon for papers to provide a rationale for the threshold selected to define myopia in terms of either/both the research question or the population being investigated. Also, rarely provided is a justification for the choice of variable for prevalence estimate for example, mean SE for an individual or SE of most extreme eye. Refractive error as summarised by SE and used as a continuous variable has analytical strengths as a phenotype in genetic epidemiology. However, for clinical practice, planning of services and in classical epidemiology where measurement and monitoring of frequency or understanding associations with risk factors are key, then distinct categories of refractive status become relevant. This requires selection of threshold values of SE to disaggregate myopia as the opposite of hypermetropia with emmetropia as an intermediate state. We have shown that this conversion of a continuous trait to distinct categories impacts at the margins, where the groups are more similar. As this is a non-random error, the effect could be to either increase or decrease a point estimate erroneously and the associated alpha error (P value). In our study, the effects were in opposing directions for two key risk factors, illustrating the complexity of the scenario created by reclassification. Furthermore, there could be differential impact depending on the question being addressed, for example, using a threshold of −0.5D is likely to have different impacts in comparisons of high myopia with emmetropia as opposed to mild myopia.
A cut-off of ≤−0.50D in either eye for definition of any myopia has recently been recommended by the WHO for use in RAAB surveys1 6 in poorly resourced settings where a high rate of false positives is acceptable, given the primary aim of identifying for further formal assessment, those who may have remediable sight impairment due to refractive error. In most other contexts, minimisation of ‘false positives’ through use of more stringent definitions of myopia is critical to avoid misleading interpretation of results. For example, in a recent intervention trial,7 8 most of the observed effect of outdoor activity on myopia progression in children was apparent using a threshold of ≤−0.50D but not ≤−0.750D. In effect, the intervention reduced the number of children with SE between −0.50D and −0.75D, but not with SE >−0.75. Historically in studies directed at aetiology, a cut-point of −0.75D5 9 has been used frequently as a functionally meaningful threshold (equating to unaided visual acuity of 0.3 LogMAR, the European driving standard10) or a cut-point of −1.0D or more extreme as an unequivocal threshold for defining clinically important myopia.11–13
Thus, we argue that a better approach to improve translational value and minimise the risk of spurious findings, would be for the choice of threshold to be hypothesis-driven by being both biologically ‘anchored’, that is, taking account of natural history and the population being studied (reflecting the distribution of both refractive error and risk factors) as well as being functionally meaningful, that is, considering the threshold for treatment per se and the magnitude of anticipated outcomes of treatment or other interventions. For example, in a European setting use of a SE −0.75D will have greater clinical meaning (more likely to be ‘true’ primary myopia) if observed in a preschool child population tested with cycloplegia than in elderly adult populations tested without; but this may not hold for a contemporaneous Asian population.
Research on myopia needs to move into an new era where use of arbitrary definitions of myopia are replaced by carefully justified definitions within an overarching taxonomy that would serve the needs of research, practice and policy. The impact of reclassification is invisible without an explicit sensitivity analysis of the impact of more or less stringent thresholds. Including sensitivity analyses in papers would ultimately enable rigorous meta-analysis and in turn inform a universal taxonomy articulating appropriate definitions of refractive error for different research questions and contexts. Its development requires scientific exchange to agree the conceptual framework. The ongoing discussions relating to myopia for the 11th revision of the WHO’s International Classification of Disease offer one opportunity for this exchange. In parallel, we suggest that there is potentially considerable benefit in developing reporting standards for all aspects of research on refractive error analogous to, for example, Strengthening the Reporting of Observational Studies in Epidemiology14 15 and Consolidated Standards of Reporting Trials.16 These would enable the quality of myopia research to be assessed against established criteria and make robust meta-analyses feasible. The ophthalmic community knows that the need is greater than ever for robust research that can inform strategies to tackle myopia occurrence and progression: defining the problem can no longer be a moveable feast.
References
Footnotes
Contributors PMC, VB and JSR: conception or design of the work, or the acquisition, analysis or interpretation of data; drafting the work or revising it critically for important intellectual content; final approval of the version published; agreement to be accountable for all aspects of the work in ensuring that questions related to the accuracy or integrity of any part of the work are appropriately investigated and resolved.
Funding This study was funded by Economic and Social Research Council (ES/K000357/1).
Competing interests None declared.
Patient consent Detail has been removed from this case description/these case descriptions to ensure anonymity. The editors and reviewers have seen the detailed information available and are satisfied that the information backs up the case the authors are making.
Ethics approval The South East MREC (ref: 01/1/44).
Provenance and peer review Not commissioned; externally peer reviewed.
Data sharing statement Data held by UK Data Archive (http://www.data-archive.ac.uk/).
Linked Articles
- At a glance