Article Text

Abstract
Purpose To determine the influence of the optic disc–fovea distance (DFD) on the normative classifications based on thickness measurements of macular inner retinal layers with spectral-domain optical coherence tomography (OCT) in healthy subjects.
Methods A total of 182 eyes from 182 healthy subjects were included (mean (SD) spherical equivalent −0.8 (1.9) dioptres). We performed macula and optic disc imaging with the Topcon 3D OCT 2000. The thickness of the macular inner retinal layers (macular retinal nerve fibre layer (mRNFL), ganglion cell-inner plexiform layer (GCIPL) and both combined (ganglion cell complex; GCC)) and the corresponding classifications based on the built-in normative database were recorded. The occurrence of an abnormal normative classification (occurrence of any thickness variable below the fifth percentile) was related to the DFD and other factors (axial length/refraction, optic disc area, fovea–disc angle, age, gender, image quality, visual field mean deviation and peripapillary retinal nerve fibre layer thickness), using logistic regression.
Results The mean (SD) DFD was 4.90 (0.29) mm. A greater DFD was associated with a higher percentage of abnormal normative classification in the OCT parameters describing the thickness of the mRNFL (OR (95%CI) per 0.1 mm increase in DFD: 1.30 (1.13 to 1.50), p<0.001), GCIPL (1.18 (1.02 to 1.38), p=0.023) and GCC measurement (1.29 (1.08 to 1.55), p=0.006).
Conclusions Eyes with a greater DFD are prone to false-positive classifications in the thickness assessment of the macular inner retinal layers. The thicknesses should always be interpreted in the context of DFD.
- macular inner retinal layer
- optic disc-fovea distance
- retinal ganglion cell
- spectral domain-OCT
- glaucoma
- normative database
id='8a663cbd-9386-480d-91f5-0b8003b619fe'>
Statistics from Altmetric.com
- macular inner retinal layer
- optic disc-fovea distance
- retinal ganglion cell
- spectral domain-OCT
- glaucoma
- normative database
Glaucoma is one of the major causes of irreversible blindness worldwide.1 2 The morphological changes in the retinal ganglion cells have been reported to be helpful in the assessment of glaucomatous damage.3 Spectral-domain optical coherence tomography (SD-OCT) enables in vivo measurements of macular inner retinal layers, including the retinal nerve fibre layer (RNFL) and the ganglion cell-inner plexiform layer (GCIPL).4 Previous studies have shown that the GCIPL thickness has a similar glaucoma discriminating performance as the peripapillary retinal nerve fibre layer (pRNFL) thickness, both in clinical and in population-based studies.5–7 However, the discriminative performance of the GCIPL thickness is far from optimal.5–10
Several factors including age, gender, axial length and optic disc area have been shown to be associated with the thicknesses of the macular inner retinal layers.11 12 However, our knowledge concerning the variability of these thicknesses is far from complete. The distance between the optic disc centre and the fovea (DFD) is another biometric variable that may influence the macular inner retinal layers. A large DFD may be associated with a stretching of the posterior fundus, which may cause a change in retinal thickness. In our previous study, using a generic segmentation algorithm, we found that the observed thicknesses of the macular inner retinal layers were significantly associated with the DFD.13 The next question is on how far these associations influence the performance of the built-in software that provides a normative classification, which is based on the thicknesses. The normative classification is the primary OCT output used by clinicians.
The aim of this study was to determine the influence of the DFD on the normative classifications based on thickness measurements of macular inner retinal layers in healthy subjects. For this purpose, we performed SD-OCT measurements in a large group of healthy subjects and related the occurrence of an abnormal normative classification to the DFD and other ocular factors (axial length/refraction, optic disc area and fovea–disc angle (FDA)), using logistic regression. Analyses were further adjusted for age, gender, image quality, visual field mean deviation and pRNFL.
Methods
Subjects
One hundred and ninety-three Chinese healthy subjects were consecutively recruited from the clinic of the Joint Shantou International Eye Center. All included subjects underwent a full ophthalmic examination including a measurement of best corrected visual acuity, intraocular pressure (IOP), refraction and axial length (IOLMaster; Carl Zeiss Meditec, Dublin, California), slit-lamp biomicroscopy and fundus examination. None of the included eyes had any concurrent ocular disease other than ametropia. If both eyes were eligible, one eye was randomly selected. Subjects were excluded if the spherical equivalent was less than −6.0 dioptres (D), the IOP was over 21 mm Hg, the best corrected visual acuity was less than 20/40, if they had a family history of glaucoma, or if they had a history of intraocular surgery, refractive surgery, neurological disease, macular degeneration, glaucoma or diabetes.
Visual field testing
Visual field testing was performed with standard automated perimetry, using the 24–2 SITA (Swedish interactive thresholding algorithm) standard strategy (Humphrey Field Analyzer II; Carl Zeiss Meditec). Only reliable visual field tests with fixation loss less than 20% and false-positive and false-negative less than 10% were included in the study.14 15 All the included visual field tests were within normal limits in the glaucoma hemifield test and had a pattern standard deviation p value >5%.
Optical coherence tomography
Each eye was imaged using the Topcon 3D OCT 2000 software (V.8.11; Topcon). Both the ganglion cell complex (GCC) 3D scan 512×128 protocol and the optic disc 3D scan 512×128 protocol were performed. Images with eye movements during image acquisition were excluded and retaken. All the included images had a minimum image quality score of 45 as recommended by the manual of the device (median value 58).16 The GCC scan protocol, which has a scan area of 7×7 mm2, was used for the thickness measurements of the different inner retinal layers in an area of 6×6 mm2 centred at the fovea. The built-in software was used to generate thickness maps.
We recorded the superior, inferior and total (average of superior and inferior) thickness of the macular RNFL (mRNFL), GCIPL and GCC (combination of mRNFL and GCIPL). We also recorded the corresponding classification (within normal limits (green on printout), below P5 (yellow) and below P1 (red)), which is based on the internal normative database. We further recorded, for each of the three layers (mRNFL, GCIPL and GCC), the fourth thickness parameter as provided by the device, being the presence of an abnormal normative classification in the thickness deviation map. Each thickness deviation map consists of a 10×10 grid. A cell in this grid is colour-coded yellow or red if the thickness in the concerning cell is below the lower 95% (‘borderline’) or 99% (‘outside normal limits’) of the centile ranges, respectively. In the present study, an abnormal normative classification in the thickness deviation map was defined as an area of at least three contiguously colour-coded (yellow or red) cells, not including the cells directly adjacent to the fovea. Disc area and pRNFL thickness were recorded from the analysis printout of the optic disc scan protocol.
Measurement of DFD and FDA
DFD was manually measured on fundus photographs (taken with the fundus camera of the OCT system at an angle of 45० centred at the fovea) with ImageJ software (available in the public domain at http://rsbweb.nih.gov/ij/; www.nih.gov, National Institutes of Health, Bethesda, Maryland, USA), based on the coordinates of the fovea and the optic disc centre. First, a rectangle was fitted to the height and width of the optic disc manually. Two diagonal lines were drawn, and their crossing was considered as the centre. Subsequently, DFD was determined. We also measured the FDA. FDA was defined as the angle between the disc–fovea line and a horizontal line through the fovea. A positive FDA value indicates that the fovea is located inferiorly with respect to the optic disc centre.
Statistical analysis
Partial correlation tests were performed to determine the effect of DFD on the thickness of the mRNFL, GCIPL and GCC. These tests were adjusted for axial length, optic disc area, FDA, age, gender, image quality, visual field mean deviation and average pRNFL thickness. Factors associated with an abnormal normative classification based on the thickness deviation map of the mRNFL, GCIPL and GCC were evaluated with logistic regression analysis. We used backward stepwise regression by including initially all variables (DFD, axial length, optic disc area, FDA, age, gender, image quality, visual field mean deviation and average pRNFL thickness) and subsequently removing, one at a time, those variables with p>0.05, starting with the variable with the highest p value. A p value less than 0.05 was considered statistically significant. Analyses were performed using SPSS V.22.0 software.
Results
Eleven subjects were excluded because of an unreliable visual field test (five subjects), poor quality of the fundus photographs (four subjects) or poor OCT scan quality (two subjects). As a result, we included 182 eyes from 182 subjects (106 women; 95 right eyes). Table 1 shows the demographics of the study population. The mean (SD; range) DFD was 4.90 (0.29; 3.98–5.66) mm. Table 2 demonstrates the associations between DFD and mRNFL, GCIPL, and GCC thickness. DFD, adjusted for other covariates, correlated negatively with all the thicknesses of the macular inner retinal layers (all p≤0.001).
Characteristics of the study population (n=182)
Associations between DFD and the average thickness of the macular inner retinal layers, adjusted for axial length, optic disc area, FDA, age, gender, image quality, visual field mean deviation and average pRNFL thickness (n=182; partial correlation analysis)
The overall frequency of ≥1 abnormal normative classification (abnormally low average thickness superior, inferior or total, or an abnormal normative classification based on the thickness deviation map; for definitions see the Methods section) was 73.1% (134 eyes) for the mRNFL, 23.1% (42 eyes) for the GCIPL and 19.2% (35 eyes) for the GCC, respectively. Figure 1 shows the number of eyes classified as abnormal according to the four employed parameters (superior, inferior or total thickness, cluster in the thickness deviation map) for the different macular inner retinal layers. As can be seen in this figure, an abnormal classification in the thickness deviation map most often occurred in the mRNFL (abnormal classification 73.1%, 23.1% and 19.2% for the mRNFL, GCIPL and GCC, respectively; p<0.001, two-way analysis of variance).
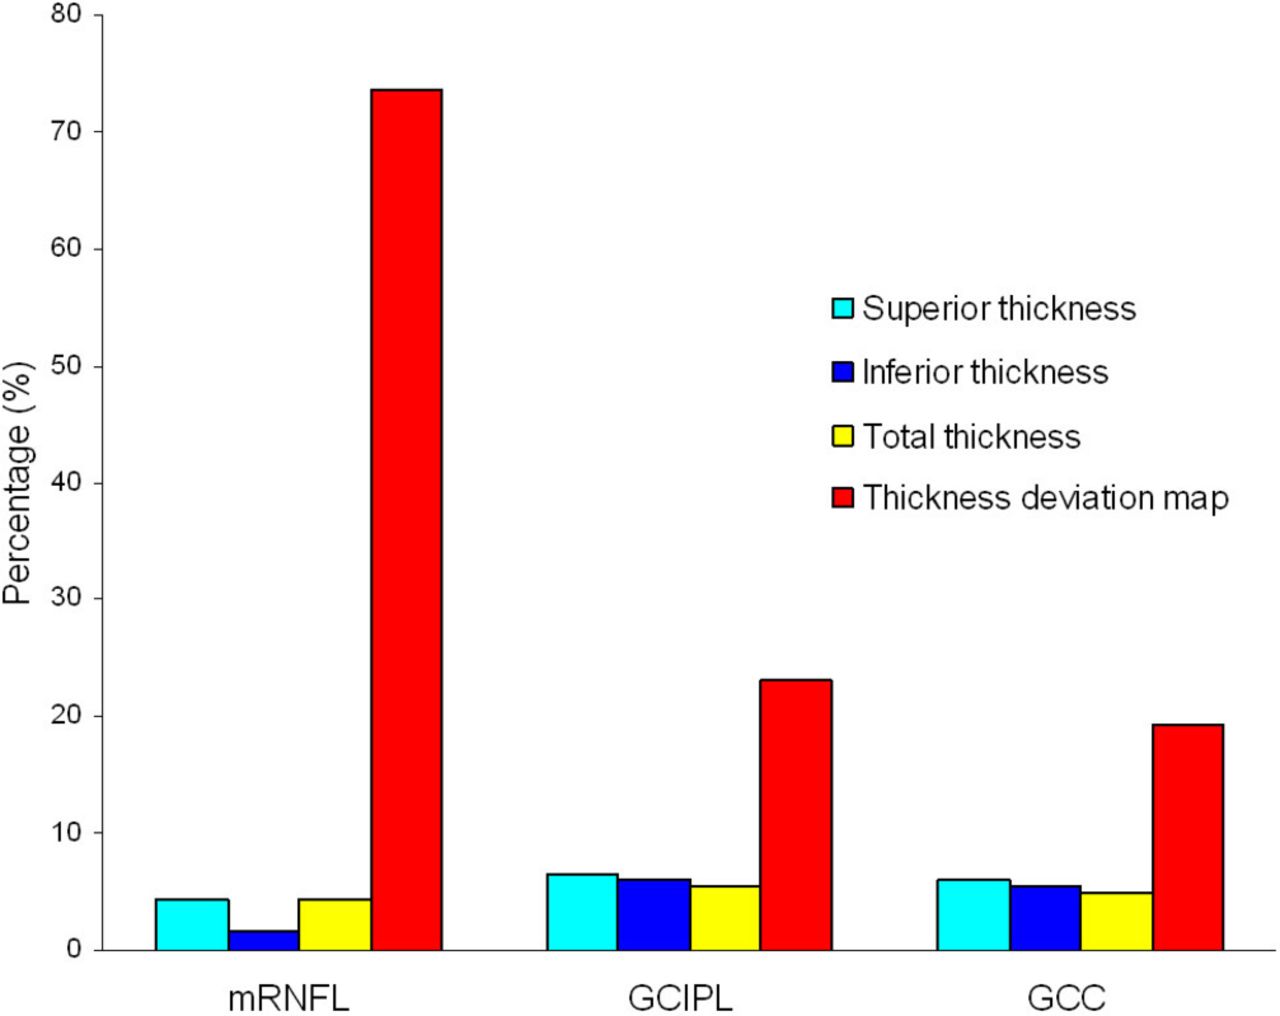
Percentages of eyes classified as abnormal according to the four optical coherence tomography parameters (superior thickness, inferior thickness, total thickness and cluster in thickness deviation map) for the macular retinal nerve fibre layer (mRNFL), ganglion cell-inner plexiform layer (GCIPL) and ganglion cell complex (GCC).
Eyes that classified as abnormal according to at least one of the four employed parameters had a significantly greater DFD (4.95 vs 4.78 mm, p<0.001 for mRNFL; 4.95 vs 4.88 mm, p<0.001 for GCIPL; 5.00 vs 4.88 mm, p=0.027 for GCC) than that of eyes classified as normal. Table 3 presents the logistic analysis. After adjusting for the effects of other covariates, a greater DFD was associated with an increased occurrence of an abnormal normative classification based on the thickness deviation map for the mRNFL (OR (95% CI) per 0.1 mm increase in DFD: 1.30 (1.13 to 1.50), p<0.001), GCIPL (1.29 (1.08 to 1.55), p=0.005) and GCC measurement (1.18 (1.02 to 1.38), p=0.006).
Factors associated with an abnormal normative classification based on the thickness deviation map of the macular inner retinal layers mRNFL, GCIPL and GCC (n=182; logistic regression analysis)
Figure 2 demonstrates the effect of the DFD on the normative classifications for the mRNFL, GCIPL and GCC in four healthy eyes. With increasing DFD, an increasing number of parameters were reported to be borderline or outside normal limits.

Four cases demonstrating the association between the DFD and the occurrence of abnormal normative classifications in the optical coherence tomography printout. DFD, disc–fovea distance; GCL, ganglion cell layer; RNFL, retinal nerve fibre layer.
Discussion
A greater DFD is associated with a higher percentage of abnormal normative classification for the OCT parameters describing the thickness of the mRNFL, GCIPL and GCC in healthy subjects.
In a previous study, we found that the DFD was significantly associated with the thickness of individual macular intraretinal layers as measured with a generic segmentation algorithm.13 In the current study, we confirmed our previous finding by using the built-in software of the OCT device, and we showed that the DFD has a clinically relevant impact on the normative classifications and is an important, independent factor determining the thickness of the macular inner retinal layers. To the best of our knowledge, no other reports regarding DFD and OCT-based normative classifications have been published thus far. A longer axial length has been found to be associated with a higher percentage of abnormal normative classifications for the GCIPL.8–10 This is in agreement with our findings. Previous studies reported that the disc area was associated with false-positive results with regard to pRNFL but not GCIPL.8 9 In agreement with this, we found that disc area was significantly associated with an abnormal normative classification for the mRNFL but not for the GCIPL or GCC. It has been reported that the FDA was significantly associated with the distribution of the pRNFL,17 and Kim et al 8 reported that the FDA was significantly associated with an abnormal normative classification for the GCIPL. In the current study, we did not detect a significant association between the FDA and an abnormal normative classification for the macular inner retinal layers. Differences in study design could have contributed to these conflicting results, such as different measurement area of the GCIPL, different study populations and adjustment for other covariates. In agreement with our findings, Mwanza et al reported that the glaucoma diagnostic performance of RNFL parameters did not improve by correcting the RNFL profiles for the FDA.18 In our study, age appeared to be significantly associated with an abnormal normative classification, despite the fact that the normative database is age-corrected. This suggests that the normative database is not optimal for our current study population. Ethnic differences in macular inner retinal layer thicknesses have been reported.11 19 The device used has four different normative databases: Caucasian, Hispanic, African and Asian. In the current study, we used the Asian database, which is based on subjects from China, Japan and Korea (personal communication with Topcon Corporation).
It is worth to note that a high percentage (73%) of abnormal normative classifications was observed for the mRNFL in the present study. Assessment of the mRNFL has been reported to be useful in glaucoma diagnosis,20–22 but the reported areas under the receiver operating characteristic curves (AUCs) ranged from 0.589 to 0.940 for detecting patients with early glaucoma with high myopia,21 and similar values (0.486–0.859) were found in another study.22 These AUC values show that improvement in diagnostic performances is needed, and reducing noise by adjusting for factors that contribute to the observed variability is a logical approach. The DFD is one of these factors that can easily be determined from data available in the scans.
Several limitations exist in the current study. First, only Chinese subjects were included. As racial differences in macular thickness have been reported,19 the current findings may not apply to other populations. A second limitation is the cross-sectional nature of the present study. Some eyes with subclinical glaucomatous damage may have been included accidentally. Although strict inclusion and exclusion criteria were applied, future longitudinal follow-up is necessary to confirm our results. On the other hand, if such a longitudinal study would reveal the spurious inclusion of early glaucoma cases, the DFD would be a risk factor for glaucoma rather than for a false-positive classification. Finally, some of the current results may not apply to other OCT devices, as there are differences in scan protocol, segmentation algorithm and normative database between different devices. The strengths of the present study are the strict inclusion and exclusion criteria and the large sample size.
Why is the DFD associated with the thickness of the mRNFL, GCIPL and GCC? Regarding the mRNFL thickness, a possible explanation is the difference in scan area for the mRNFL assessment between eyes with different DFD. In eyes with a greater DFD, the OCT scan area (centred at the fovea) is farther away from the optic disc. The RNFL is thinner farther away from the optic disc than it is closer to the disc.23 Thus, one would expect to find that the mRNFL is thinner in eyes with a greater DFD. With respect to the GCIPL thickness, one possible explanation is the stretching of the posterior fundus. In a previous study, the DFD has been reported to be associated with the peripapillary retinal nerve fibre distribution in healthy eyes.24 We speculate that the posterior fundus in eyes with a greater DFD is stretched, which may cause a decrease in GCIPL thickness in the macular region. Importantly, stretching of the posterior pole could also be caused by an increase in axial length, but our multivariable analysis showed that the DFD is an independent factor. Image magnification could play a role as well, but in our earlier studies we showed that the associations between DFD and layer thicknesses (in μm) were also found in a group of subjects with a very narrow axial length range.13 25 In the present study, the mRNFL and GCIPL thicknesses were both significantly and negatively associated with the DFD. The observed significant and negative correlation between the DFD and the GCC thickness is a logical consequence, as the mRNFL and GCIPL form together the GCC.
In conclusion, eyes with a greater DFD are prone to false-positive classification in the thickness assessment of the macular inner retinal layers. The thicknesses should always be interpreted in the context of DFD. DFD-adjusted normative databases should be developed, and future research should evaluate such normative databases in terms of improvement in diagnostic performance.
References
Footnotes
KQ and BC contributed equally.
Contributors Involved in study design and conduct: MZ, CZ, HC; data collection, management, analysis: KQ, BC, CZ, JY; interpretation: MZ, NMJ, KQ; and manuscript preparation, review or approval: MZ, NMJ, KQ.
Funding The present study was supported by grant no 81486126, from the National Nature Science Foundation of China; by grant no 2014KQNCX075, from the Foundation for Distinguished Young Talents in Higher Education of Guangdong, China; and by the University of Groningen Abel Tasman Talent Program (University Medical Center Groningen/Shantou University Medical College). The funding organisations had no role in the design, conduct, analysis or publication of this research.
Competing interests None declared.
Patient consent Obtained.
Ethics approval The study was designed following the ethical standards of the Declaration of Helsinki and approved by the ethical committee of the Joint Shantou International Eye Center of Shantou University and The Chinese University of Hong Kong.
Provenance and peer review Not commissioned; externally peer reviewed.
Linked Articles
- At a glance