Article Text

Abstract
Background/Aim This study aimed to compare central visual sensitivity under monocular and binocular conditions in patients with glaucoma using the new imo static perimetry.
Methods Fifty-one consecutive eyes of 51 patients with open-angle glaucoma who were affected with at least one significant point in the central 10° were examined in this cross-sectional study. Monocular and binocular random single-eye tests were performed using the imo perimeter and the Humphrey field analyser (HFA) 24-2 and 10-2 tests. The eyes were assigned to ‘better’ and ‘worse’ categories based on the visual acuity and central visual thresholding. Central visual sensitivity results obtained by monocular, binocular random single-eye tests and binocular simultaneous both eye test were compared.
Results The average mean deviation with the HFA 24-2 was −5.5 (–1.5, –14.6) dB (median, (IQR)) in the better eyes and −18.0 (–12.9, –23.8) dB in the worse eyes. The mean sensitivity in the central 4 points of the visual field (VF) of the worse eyes was lower when measured under the binocular eye condition than under the monocular condition. Conversely, this value of the better eyes was greater when measured under the binocular eye condition than under the monocular condition.
Conclusions The central sensitivity of the better eyes was better and that of the worse eyes poorer with binocular testing than with monocular testing in patients with glaucoma. Although monocular VF testing is still the most straightforward means to monocularly monitor glaucoma at clinical settings, binocular testing, such as provided with imo perimetry, may be a useful clinical tool to predict the effect of VF impairments on a patient’s quality of visual life.
- physiology
- glaucoma
- field of vision
This is an open access article distributed in accordance with the Creative Commons Attribution Non Commercial (CC BY-NC 4.0) license, which permits others to distribute, remix, adapt, build upon this work non-commercially, and license their derivative works on different terms, provided the original work is properly cited, appropriate credit is given, any changes made indicated, and the use is non-commercial. See: http://creativecommons.org/licenses/by-nc/4.0/.
Statistics from Altmetric.com
Introduction
Understanding a patient’s binocular visual field (VF) is important when predicting the effect of VF impairments on a patient’s quality of visual life (QoVL).1 2 VF testing is essential in diagnosing and monitoring many ophthalmological and neurological diseases, including retinitis pigmentosa and glaucoma. Automated perimeter devices, such as the Humphrey field analyser (HFA) (Carl Zeiss Meditec, Dublin, California, USA) and Octopus perimeter (Haag-Streit, Köniz, Switzerland) have been widely used in the field of standard automated perimetry (SAP) since the 1990s. With both the HFA and Octopus, VF examination is usually performed monocularly, with one eye occluded, and binocular VF measurement is rarely performed, although the binocular Esterman VF test can be performed with both these perimeters.
Because humans use both eyes simultaneously, a binocular measure is likely best to predict the impact of VF impairment on a patient’s QoVL,1 and there is evidence to support this.2 Previous reports have specifically shown that, in addition to visual acuity,3–6 VF loss impacts patient QoVL.1–3 6–8 Previous studies have also reported a strong relationship between patient QoVL and binocular VF, as measured using the binocular Esterman VF test.2 3 8–10 Nevertheless, in clinical settings, resources are typically solely dedicated to monocular assessment.
A new portable head-mounted perimeter, named ‘imo’ (CREWT Medical Systems, Tokyo, Japan) has recently been developed.11 This device enables VF testing with no need for a dark room and using test conditions compatible with those for SAP.12 A gyroscope is integrated, and the head tilt can be monitored.13 It has been shown that imo achieves VF sensitivity comparable with that obtained using the SAP.11 12 Moreover, the test target is randomly presented to either eye, under both eyes-open conditions, without performing occlusion and the examinee being aware of which eye is being tested (ie, a binocular, random single-eye test).11 13
To our knowledge, however, there is no investigation comparing mean sensitivity in better and worse eyes between monocular and binocular testing among patients with advanced glaucoma. Thus, the purpose of this study was to compare central visual sensitivity as assessed using monocular and binocular conditions, where the test target is presented randomly to either eye, in patients with glaucoma with parafoveal scotoma using the new imo static perimetry’.
Materials and methods
Study population
Patients with glaucoma were included if they were ≥20 years old, fulfilled the eligibility requirements detailed below and signed informed consent, between October 2017 and March 2018.
All patients underwent a comprehensive ophthalmic examination, including slit lamp biomicroscopy, intraocular pressure (IOP) measurement with Goldmann applanation tonometry and fundus photography (CX-1, Canon, Tokyo, Japan). Axial length and central corneal thickness were also measured (Optical Biometer OA-2000, Tomey, Nagoya, Japan). To diagnose glaucoma and assess its severity, automated VF assessment was performed using the 24-2 and 10-2 pattern Swedish interactive threshold algorithm (SITA) standard strategy on the Humphrey field analyser (HFA, Carl Zeiss Meditec, Dublin, California, USA). All participants had previous experience with VF examinations, and unreliable VFs, defined as fixation losses greater than 25% or false-positive responses greater than 15%, were excluded.14 Retinal nerve fibre layer (RNFL) measurements were made using spectral domain optical coherence tomography (OCT) (SD-OCT) (Spectralis OCT, Heidelberg Engineering, Heidelberg, Germany).
Glaucoma was diagnosed when the following findings were present: (1) apparent glaucomatous changes in the optic nerve head (ONH), according to fundus photography, such as a vertical cup-to-disc ratio of 0.7, a rim notch with a rim width ≤0.1 and/or an RNFL defect (with its edge at the ONH margin greater than that at a major retinal vessel) diverging in an arcuate or wedge shape; (2) glaucomatous VF defects based on the HFA 24-2 test pattern, compatible with glaucomatous ONH changes. These had to fulfil at least one of Anderson-Patella’s criteria, that is, a cluster of ≥3 points in the pattern deviation plot in a single hemifield (superior/inferior) with p<0.05, one of which must have been p<0.01; a glaucoma hemifield test result outside of normal limits; or an abnormal pattern SD with p<0.0515; and (3) absence of other systemic or ocular disorders, including a shallow peripheral anterior chamber that could affect the VF. Eyes with refractive error ≥− 8.0 D and <3.0 D were included. Participants with systemic hypertension and diabetes mellitus were included, unless they had hypertensive or diabetic retinopathy, respectively.
Participants with history of intraocular surgery (except for uncomplicated cataract or glaucoma surgery), coexisting retinal pathologies, non-glaucomatous optic neuropathy, uveitis, ocular trauma, strabismus or fusion disorder, or history of Parkinson’s disease, Alzheimer’s disease, dementia or stroke were excluded. Eyes with best visual acuity worse than 1.3 logMAR were also excluded.
After diagnosing patients with open-angle glaucoma, we selected only those who had parafoveal scotoma. Based on previous studies,16 17 the 24-2 SITA programme was used to detect parafoveal scotoma in patients who had been diagnosed with glaucoma. Parafoveal scotoma was defined as a glaucomatous VF defect with >3 adjacent points with p<0.05 within the central 10° of fixation, with >1 point with p<0.01 at the innermost paracentral point.
Imo perimetry
After diagnosing glaucoma and confirming reliable test results and central scotoma using the HFA 24-2 test, we performed the fovea macula test using the imo, as previously described.11 13 18 Briefly, during an imo test, the target delivered by a high-intensity light-emitting diode (LED) backlight is presented on a full high-definition transmissive liquid crystal display. The maximum target luminance is 3183 cd/m2 (10 000 asb) and the background luminance is 10 cd/m2 (31.4 asb). An eye-tracking system is integrated in imo and enables to follow eye movement from the fixation point and to correct the location of the target presentation. For this eye-tracking system, imo has three near-infrared LED monitors with a wavelength of 950 nm. By using an SXVGA-resolution (1,280×960 pixels) complementary metal-oxide-semiconductor sensor with a maximum frame rate of 54 Hz, images can be recorded in real time. In this study, a total of 5 points located at the fovea and on the 3° superior/inferior and 3° temporal/nasal points, with 6° intervals, within the central 5° VF were tested using Goldmann size III (0.431° visual angle) stimuli (figure 1). The threshold algorithm used a 4–2 dB bracketing strategy. Mean sensitivity was calculated in dB using individual test points, with each point converted to a linear scale (1/Lambert = 100.1XdB; linear sensitivity)19–21 and averaged to obtain the mean sensitivity values.

Schematic representation of the test locations.
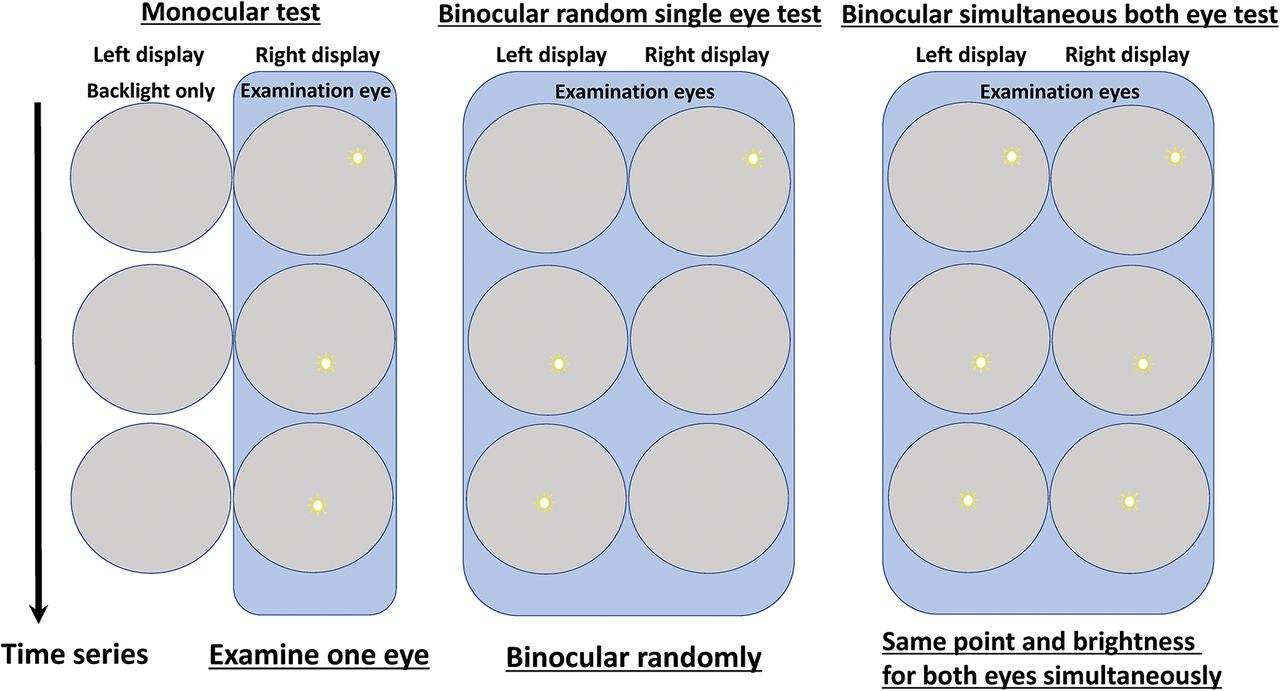
Monocular test, binocular random single-eye test and binocular simultaneous both eye test
The imo perimeter can test the right and left eyes separately and present the test target randomly to either eye under a non-occlusion (binocular) condition. Thus, monocular sensitivity for the right or left eye can be measured without occluding the other eye. Additionally, the binocular, random single-eye test is a new testing approach created for the imo.11 13 In brief, the test target was presented randomly to either eye under a non-occlusion condition, with the patient unaware of which eye was being tested (figure 2), and the VF sensitivities for the two eyes were measured simultaneously during a single test. Each condition was tested twice and the mean of the two sensitivity measurements was analysed. Moreover, the binocular simultaneous both eye test was also performed. In the binocular simultaneous both eye test, the test target was presented simultaneously to both eyes, with the patient unaware of which eye was being tested (figure 2). Figure 2, online supplementary video and table 1 summarised each test programme. All test conditions were performed on the same day.
Supplementary video

Schematic explanation of the monocular and binocular tests. (Left) Monocular testing was performed for each eye separately, without occlusion. The non-tested eye was presented only with a backlight at the same level of illumination. The examinee was aware of which eye was being tested. Results for each eye are obtained separately. (Centre) The binocular random single-eye test examined the bilateral visual fields simultaneously in a single test. The target was presented randomly to either eye under a non-occlusion condition, with the patient unaware of which eye was being tested. Results for each eye were obtained simultaneously. (Right) The binocular simultaneous both eye test examined the bilateral visual fields simultaneously. The target at same place and same brightness was presented to either eye under a non-occlusion condition. One result for both eyes was obtained. Neither the examiner nor the subject was aware which eye was being tested.
Characteristics of each test condition
Better eye and worse eye
We determined the better and worse eyes based on the following criteria. (1) Foveal visual sensitivity using the HFA 24-2 programme of the better eye was greater than or equal to that of the worse eye. (2) Best-correlated visual acuity (BCVA) of the better eye was greater than or equal to that of the worse eye. (3) The patient’s subjective awareness of which eye was better or worse. If there was any discrepancy, we excluded the patient from the analysis.
Statistical analysis
The distribution of numerical variables was assessed by inspecting histograms and using the Shapiro-Wilk W test of normality. For normally distributed variables, results are shown as mean±SD. For non-normally distributed variables, results are shown as median (IQR). Two-tailed paired t-test and Wilcoxon signed-rank test were used to compare the mean sensitivities between the monocular and binocular tests.
A p value<0.05 was considered statistically significant. All statistical analyses were performed using JMP V.10.1 software (SAS Institute, Cary, North Carolina, USA) and Stata software V.14 (StataCorp LP, College Station, Texas, USA).
Results
During the enrolment period, this study initially involved 80 consecutive patients. Of these, we excluded 3 with strabismus or fusion disorder, 16 with best visual acuity worse than 1.3 logMAR and 10 with discrepancy between subjective and objective awareness of which eye was better or worse. Thus, 51 patients with glaucoma were eligible for this study. Baseline demographics and ophthalmic characteristics are summarised in table 2.
Demographics and ocular characteristics of the study population
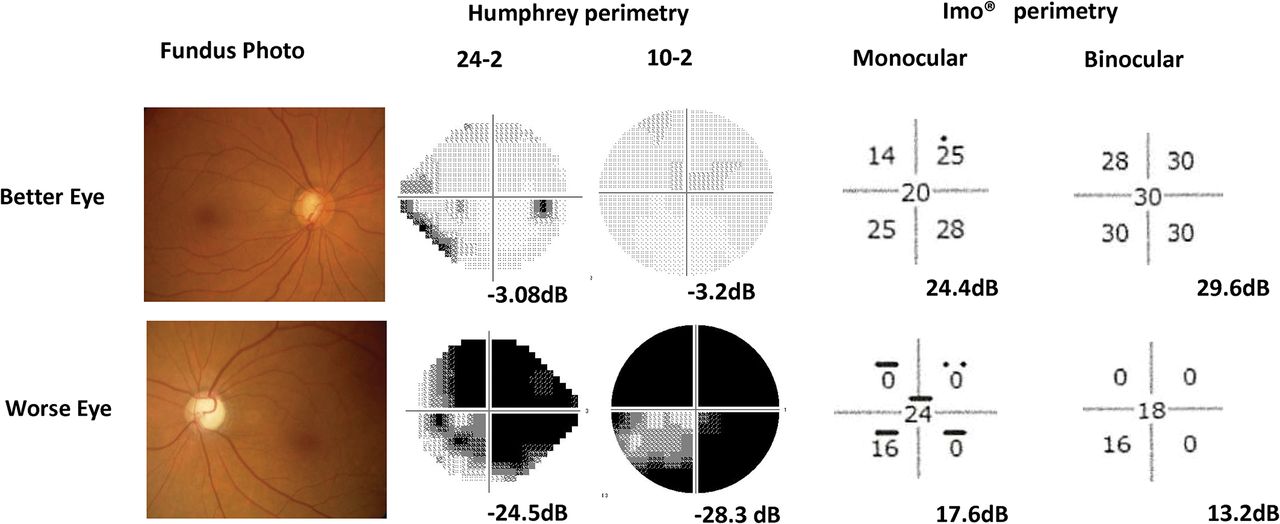
The mean patient age was 65.1±14.9 years. There were no significant differences in central corneal thickness, IOP, refractive error and axial length between the better and worse eyes (p>0.05 for all). As expected, better eyes had, on average, better VF mean deviation (MD) on both the 24-2 and 10-2 HFA programme and better BCVA than the worse eyes (p<0.001 for all). Figure 3 shows representative results of fundus photography, HFA 24-2 and 10-2 tests, and imo perimetry for the better and worse eyes. The better eye had early glaucoma, but central sensitivity was intact according to the HFA 24-2 and 10-2 test results. With imo perimetry, the mean sensitivity in the binocular test (29.6 dB) was better than that in the monocular test (24.4 dB). Conversely, the worse eye had advanced glaucoma and central sensitivity was impaired according to the HFA 24-2 and 10-2 tests. With imo perimetry, the mean sensitivity in the binocular (13.2 dB) was worse than in the monocular test (17.6 dB).

Representative case. The patient was a 71-year-old female with glaucoma. Her decimal visual acuity was 1.2 OD and 0.5 OS. Fundus photograph (first column), Humphrey perimetry results based on the 24-2 and 10-2 test (second and third columns, respectively), and results of imo perimetry using monocular and binocular conditions (fourth and fifth columns, respectively).
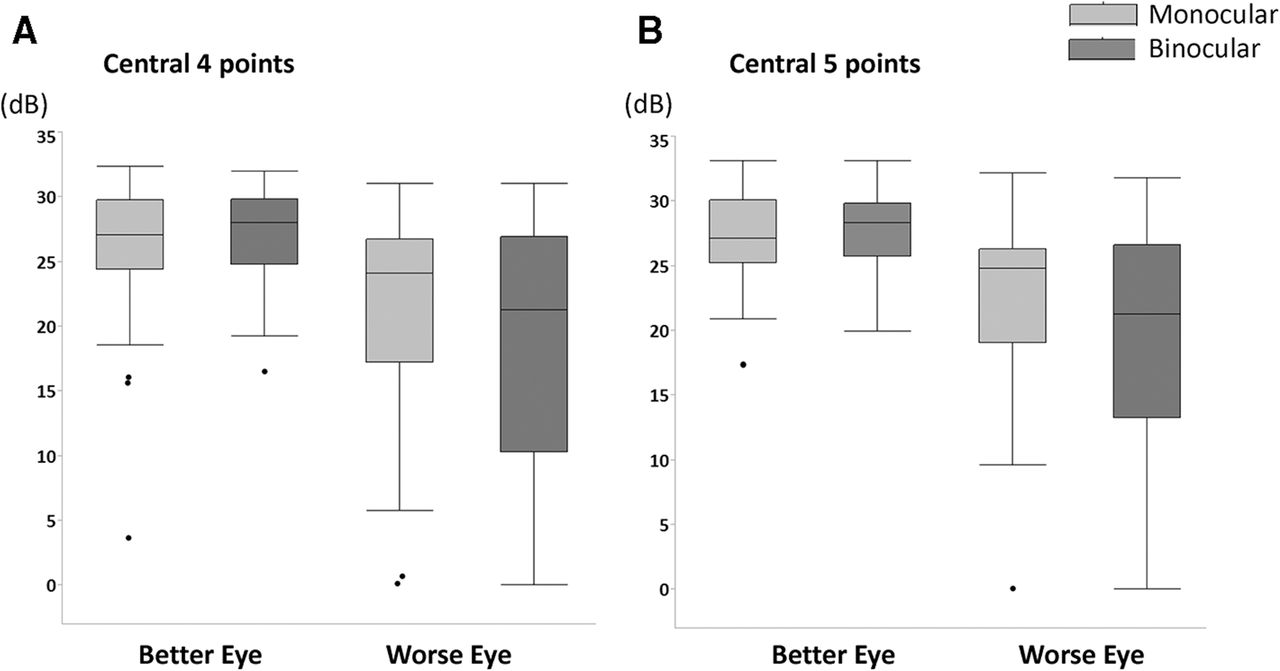
Figure 4 shows scatterplots comparing the binocular and monocular sensitivities in the better and worse eyes and indicate that many better eyes had higher mean sensitivity in the binocular than in the monocular test. Table 3 and figure 5 compare the sensitivity of the central 4 and 5 points in better and worse eyes measured under monocular and binocular conditions.
Mean sensitivity in better and worse eyes between the binocular and monocular conditions

Scatterplots showing the relationship between monocular measurements and binocular measurements in the better and worse eyes, in the central 4 points (left) and central 5 points (right).

Boxplots illustrating a comparison of mean sensitivity between monocular and binocular conditions in the better and worse eyes for the central 4 points (left) and central 5 points (right). The medians are represented by horizontal lines inside the white boxes. Boxes represent the IQR between the first and third quartiles.
In better eyes, the median of the mean sensitivity was significantly higher in the binocular than in the monocular test. Conversely, in worse eyes, the median of the mean sensitivity was significantly worse in the binocular than in the monocular test (p<0.05 for all).
Table 4 shows the comparison of visual sensitivities between the binocular simultaneous both eye test and the binocular random single eye test in the better eyes. The median of the mean sensitivity was significantly higher in the binocular simultaneous both eye test than in the binocular random single eye test (p<0.05 for all).
Mean sensitivity between the binocular simultaneous both eye test and the binocular random single-eye test in the better eyes
Discussion
This study demonstrated that the central sensitivity of the better eyes in patients with advanced glaucoma was better when tested under the binocular than under the monocular condition, and conversely, the central sensitivity of the worse eyes was poorer under the binocular than under the monocular condition. Thus, compared with real-life conditions, in which both eyes are typically open, the visual function of the better eye is underestimated and that of the worse eye is overestimated in a typical VF test using monocular examination.
During monocular measurements, darkening of the eye, called ‘blankout’, may occur, and this would affect the sensitivity measurement when monocular sensitivity is measured with the non-tested eye occluded.22 23 It is reported that ‘blankout’ occurs when both eyes simultaneously experience different levels of illumination.22 A comparison of monocular sensitivity showed that it was higher when measured with a translucent occluder than when measured with an opaque occluder on the non-tested fellow eye, and that the global indexes were better with translucent occlusion in healthy subjects.23 This result may suggest that using a test condition in which the non-tested eye is occluded may lower the monocular sensitivity of the tested eye.23 Conversely, Wakayama et al13 recently demonstrated that monocular sensitivity measured using the imo perimeter without occluding the non-tested eye was not significantly different from the sensitivity measured at the fovea with occlusion. Moreover, the sensitivities for monocular measurement without occlusion and binocular measurement in the random single-eye test did not differ in young healthy subjects,13 suggesting that foveal sensitivity using the imo was similar between monocular measurements without occlusion and binocular measurements, at least in healthy young subjects. In contrast, in this study, it is noteworthy that both the better and worse eyes showed significant differences between these monocular and binocular measurements, although the monocular sensitivity was measured without occlusion. Although the detailed mechanism of the difference in sensitivity between monocular and binocular measurements remains unclear, we hypothesised that patients with advanced glaucoma may unconsciously improve the sensitivity of the better eye and decrease the sensitivity of the worse eye. The effect of blankout,22 23 binocular summation24–26 or binocular rivalry27 on central visual sensitivity might cause different results between healthy subjects and patients with advanced glaucoma. Nevertheless, these results suggest that caution should be exercised in directly interpreting visual sensitivity measured with occlusion of one eye, at least in patients with advanced glaucoma with central VF impairment.
Glaucomatous VF damage is closely related to deterioration of a patient’s QoVL,8 and a binocular measure is likely best to predict the impact of VF impairment on QoVL.1 2 However, typically, only monocular VF is tested in the clinic. Integrated VF (IVF) assessment offers an alternative to estimating a patient’s binocular VF severity.28–32 The IVF is estimated simply from monocular results, taking the best sensitivity values from corresponding VF locations from the two eyes, and requires no additional testing. The IVF has been shown to closely agree with the results of the Esterman test for identifying patients with glaucomatous central defects.30 However, the IVF is not the same as the VF determined with both eyes open; the IVF only simulates the binocular VF by merging monocular VFs and is, therefore, not a true measure of binocular VF. Here, central sensitivity was highest in the binocular simultaneous both eye test, followed by the binocular random single eye test in the better eye and the monocular test in the better eye. Moreover, central sensitivity in the better eyes was better under the binocular than under the monocular condition, suggesting that visual sensitivity tested monocularly in the better eye may be underestimated compared with that tested under binocular conditions. Asaoka et al investigated the IVF MD and reported that, in many cases, the patient’s functional binocular field of view tended to be better than that represented by the VF of the better eye alone, particularly if VF loss was advanced or when there was spatial discordance in VF damage between the eyes.29 These findings appear to be in line with our results. Moreover, based on our current results, the central visual sensitivity in the better eyes under binocular conditions might in fact be better than expected based on the results of monocular testing. Further research is needed to clarify whether central sensitivity in eyes with advanced glaucoma tested under binocular conditions differs from that determined under monocular conditions.
This study had several limitations. First, we measured only the central 5 points’ sensitivities, which limited peripheral insight into visual sensitivities. However, a longer measurement time would cause a fatigue effect, which can be limiting because patient cooperation is necessary. Moreover, because central visual sensitivity impacts both visual acuity and QoVL, this study focused on central visual sensitivities. Nonetheless, future studies of peripheral visual sensitivity under binocular conditions in eyes with early glaucoma should be conducted. Additionally, further investigation into the correlation between binocular and monocular sensitivity and patient’s QoVLs would be needed to clarify which test mode is clinically relevant. Second, the use of background light during monocular testing is debatable. The threshold of the second eye tested was higher than that of the first eye using frequency doubling perimetry and this effect could be minimised using a translucent occluder.33 34 These results indicated that light adaptation in both eyes is important for perimetric threshold measurement.13 Thus, we tried to minimise the differences in background conditions between monocular and binocular measurements. Third, some patients in this study had poor visual acuity due to advanced glaucoma. Previous studies have suggested that the results of VF measurement are not accurate in patients with poor VA, and the inclusion criteria of central scotoma patients are debatable. We also analysed the data applying the stricter criterion of best visual acuity equal or better than 1.0 logMAR (online supplementary tables 1 and 2) and the results showed the same tendency.
Supplemental material
Supplemental material
In conclusion, we here evaluated central visual sensitivity under monocular and binocular conditions in patients with glaucoma using the new imo static perimetry. Compared with monocular examinations, the central sensitivity of the better eyes was better and that of the worse eyes was poorer under binocular testing conditions in patients with glaucoma. Many patients’ fields of view might be more impaired than would be expected from only monocular measurements of the worse eye. The findings reported in this article should encourage future studies endeavouring to examine the association between VF loss and QoVL to use binocular rather than monocular measurements. Nevertheless, monocular VF testing remains the most straightforward means to diagnose early VF defect due to glaucoma and monitor glaucoma in clinical settings so far. Binocular VF testing, such as that possible with this new type of perimetry, would be a useful clinical tool in this respect.
References
Supplementary materials
Supplementary Data
This web only file has been produced by the BMJ Publishing Group from an electronic file supplied by the author(s) and has not been edited for content.
Footnotes
Contributors Involved in design and conduct of study: TK, TS, IK and KS. Data collection: TS, TK, YY, IM, JK, HI, AS and SI. Analysis and interpretation of data: TS and TK. Writing: TS, TK and KS. Critical revision: TS, TK and SK. Approval of the manuscript: TK, TS, YY, IM, JK, HI, AS, SI, IT and KS.
Funding This study was supported in part by a Japan Society for the Promotion of Science grant (Kakenhi grant number 19K09976).
Competing interests None declared.
Patient consent for publication Obtained.
Ethics approval This cross-sectional study was approved by the Ethics Committee of Saitama Medical University and was conducted in accordance with the tenets of the Declaration of Helsinki.
Provenance and peer review Not commissioned; externally peer reviewed.
Data availability statement Data are available on request. The datasets during and/or analysed during the current study available from the corresponding author on reasonable request.