Article Text

Abstract
Background/aims To assess foveal avascular zone (FAZ) morphology and parafoveal capillary perfusion in patients with various stages of sickle cell retinopathy (SCR) using optical coherence tomography angiography (OCT-A).
Methods This is a multi-institutional retrospective study of patients with various stages of SCR compared with healthy controls. Parafoveal OCT-A images obtained using a commercial spectral domain-OCT system were reviewed. Foveal-centred 3×3 mm full vascular slab OCT-As were used for image processing and data analysis. FAZ area, perimeter, and acircularity index were determined on the OCT-A image after manual delineation of the FAZ border. Quadrant-based parafoveal capillary density and per cent area deviating from normal distribution were also measured.
Results Fifty-two patients with SCR (33 non-proliferative and 19 proliferative) and 20 age and race-matched healthy controls were included. One randomly selected eye per study participant was analysed. FAZ perimeter and acircularity index were significantly greater in SCR eyes when compared with the controls. While parafoveal capillary density was significantly lower, per cent area deviated from normal distribution was significantly higher in SCR eyes than that of the control. However, no statistically significant difference between the two SCR stages was observed. In quadrant-based analysis, the temporal quadrant showed greater parafoveal capillary dropout due to SCR, with the most profound effect in patients with proliferative SCR.
Conclusions Abnormal FAZ morphology and altered parafoveal capillary perfusion were found in patients with SCR. Our customised OCT-A image analysis method uniquely highlights significant quantitative alterations in perfusion density mapping in a qualitative display, with minimal obscuration of OCT-A image detail.
- retina
- imaging
- macula
This is an open access article distributed in accordance with the Creative Commons Attribution Non Commercial (CC BY-NC 4.0) license, which permits others to distribute, remix, adapt, build upon this work non-commercially, and license their derivative works on different terms, provided the original work is properly cited, appropriate credit is given, any changes made indicated, and the use is non-commercial. See: http://creativecommons.org/licenses/by-nc/4.0/.
Statistics from Altmetric.com
Introduction
Sickle cell disease is an autosomal recessive haemolytic anaemia due to multiple genotypic mutations of adult haemoglobin. This haemoglobinopathy precipitates a complex metabolic cascade that causes erythrocytes under local hypoxia to polymerise and aggregate, leading to recurrent vaso-occlusive crises and decreased erythrocyte lifespan.1 Sickle cell retinopathy (SCR), one of the ocular manifestations of sickle cell disease, is characterised by chronic retinal vascular ischaemia and occlusion due to the clogging of rigid sickle-shaped erythrocytes in the capillaries. Currently, intravenous fluorescein angiography (IV-FA) is the gold standard for evaluation of retinal vasculature and clinical staging in SCR. The advent of ultrawide IV-FA, in particular, has enabled capture of both the macula and peripheral retina up to 200° in a single image.2 3 While the peripheral vasculature is especially susceptible to sickle cell disease, recent studies have demonstrated that macular involvement is also common.4–10 IV-FA displays only the superficial macular capillaries with limited ability to provide quantitative information.11 Optical coherence tomography angiography (OCT-A), which uses the contrast of erythrocyte motion to distinguish blood flow from the static signal of the background retinal tissue, offers additional information on tissue perfusion.12 Compared with IV-FA, OCT-A features higher resolution with the capability of precise quantification of capillary abnormalities at the macula and may be a more sensitive imaging method for early detection and monitoring of SCR.
Sickle cell maculopathy develops from retinal ischaemia due to occlusion of the macular capillary networks, resulting in perifoveal capillary loss, alteration of foveal avascular zone (FAZ) morphology, formation of parafoveal microaneurysms and vascular loops, and nerve fibre layer thinning.13 14 These macular abnormalities have been strongly associated with peripheral neovascularisation in patients with advanced SCR.15 Prior OCT and OCT-A studies of SCR have reported that vascular abnormalities and retinal thinning are predominately located in the region temporal to the fovea.5–9 However, these studies have been predominantly qualitative, and there remains limited quantitative evidence supporting the initial observations of regional susceptibility for SCR insult. In this study, we compared FAZ morphology in patients with SCR and controls using OCT-A. We also investigated any potential spatial propensity for parafoveal capillary dropout in patients with SCR, using a customised parafoveal capillary density method and mapping approach that provides both qualitative and quantitative assessments.
Materials and methods
Subjects
This retrospective, cross-sectional study was conducted at the Johns Hopkins Wilmer Eye Institute with data analysis performed at the New York Eye and Ear Infirmary of Mount Sinai. The research study adhered to the tenets of the Declaration of Helsinki and was approved by the Johns Hopkins University School of Medicine Institutional Review Board. Diagnoses of patients with sickle cell of any genotype were determined through a comprehensive chart review and diagnostic wide-field IV-FA imaging conducted from September 2016 through May 2018 at the Johns Hopkins Wilmer Eye Institute. All patients with SCR underwent a complete ophthalmic examination by ophthalmologists, including ETDRS visual acuity testing, slit lamp biomicroscopy, dilated fundus examination, OCT and OCT-A imaging. SCR stage was graded according to Goldberg classification for each eye: stage I—peripheral arteriolar occlusions; stage II—peripheral arteriolar-venular anastomoses; stage III—preretinal neovascular; stage IV—vitreous haemorrhage; stage V—retinal detachment.16 For patients in whom both eyes met inclusion criteria, a single eye was selected at random for inclusion in the study. Exclusion criteria for patients with sickle cell disease included cataract, vitreous haemorrhage, macular oedema, nystagmus, or a history of other retinal vascular disease such as hypertension, diabetes or retinal vessel occlusion. Selected patients with sickle cell disease were then placed one of two groups according to SCR stage: group 1 was non-proliferative SCR (NP-SCR) with stage II or less and group 2 was proliferative SCR (P-SCR) with stage III or above. Age and race-matched healthy controls were also enrolled. Exclusion criteria for healthy controls were the same. However, controls were also required to have a best corrected visual acuity of 20/20 or better and no prior ocular pathology or surgery.
OCT-A image acquisition
OCT-A images were obtained with a commercial spectral-domain OCT system (Avanti RTVue-XR; Optovue, Fremont, CA, USA), with a scan rate of 70 000 A-scans per second, scan beam wavelength centred at 840 nm and a bandwidth of 45 nm. A single 3×3 mm scan, centred at the fovea, was acquired from each study participant. Following image acquisition, OCT-A images were generated by the Optovue AngioVue software (Angioanalytics, V.2018.0.0.16) which employs the split-spectrum amplitude-decorrelation angiography algorithm.12 A 3×3 mm full vascular slab was designated for image processing and analysis, which included both large blood vessels and capillaries located between the inner limiting membrane and 70 µm below the posterior boundary of the inner plexiform layer (figure 1A). Individual axial lengths were not measured at the time of imaging. A default axial length of 23.95 mm was used to derive the scan dimensions in millimetres.17

Demonstration of optical coherence tomography angiography (OCT-A) image processing procedure in a patient with non-proliferative sickle cell retinopathy (NP-SCR). (A) Contrast-stretched full vascular slab OCT-A. (B) Manual segmentation of foveal avascular zone (FAZ). (C) Full vascular slab OCT-A after the removal of non-capillary blood vessels. (D) Parafoveal capillary segmentation highlighted in cyan. (E) Parafoveal capillary density map with non-capillary blood vessels indicated in white due to the exclusion from density computation. (F) Corresponding deviation map. Areas with parafoveal capillary density below 5% and 1% of the normal distribution are indicated in yellow and red, respectively. The temporal aspect of the parafovea is to the left in all images.
OCT-A image processing and data analysis
All image processing and data analysis were performed in the Einhorn Clinical Research Center at the New York Eye and Ear Infirmary of Mount Sinai. The first step involved manual delineation of the FAZ border on the full vascular slab OCT-A image using Adobe Photoshop (Adobe Systems, San Jose, CA, USA).18 An FAZ mask was created based on the FAZ border delineation (figure 1B). FAZ area, perimeter and acircularity index were then measured on the FAZ masks using MATLAB (The MathWorks, Natick, MA).18
On each greyscale full vascular slab OCT-A image, parafoveal capillary area was extracted after the removal of non-capillary blood vessels using global and local thresholding as described previously (figure 1C,D).19 20 This resultant OCT-A image contains only parafoveal capillaries for the generation of parafoveal capillary density map (figure 1E). Parafoveal capillary density was then measured for five regions of interest (ROI) including the entire OCT-A image and four equiangular quadrants (temporal, nasal, superior and inferior) with the centre defined as the centroid on the FAZ mask.
For quantitative assessment, parafoveal capillary density (%) for each ROI was computed as described below:

In both the control and SCR groups, individual density values on the parafoveal capillary density maps were compared against a previously established age and eccentricity-matched normative database (n=261, mean age 37 years; age range 5–87 years).21 Individual parafoveal capillary density deviation maps highlighting the regions with capillary density at the extreme lower end of the normative curve were then generated for each control and patient with SCR (figure 1F). On the deviation map, yellow and red colours indicate regions with parafoveal capillary density below 5% and 1% of the normal distribution, respectively. Per cent yellow and red areas were then computed for the same five ROIs as described in the parafoveal capillary density analysis.
For quantitative assessment, per cent yellow area and per cent red area (%) for each ROI were computed as described below:

Statistical analysis
All statistical analyses were performed using SPSS V.24.0 (IBM). To avoid interocular correlation, only one randomly selected eye from each participant was included for image processing and data analysis. Age, FAZ metrics, parafoveal capillary density measurements and per cent area deviated from normal distribution were all tested for normality in each study group using a Kolmogorov-Smirnov test. Since not all groups met the requirement for normality, comparison between groups was performed using the non-parametric Kruskal-Wallis and post hoc tests with the Bonferroni correction for multiple comparisons. Horizontal and vertical asymmetries in parafoveal capillary density measurements (temporal vs nasal quadrants and superior vs inferior quadrants) were compared using Wilcoxon signed-rank test in each group. Horizontal and vertical asymmetry analyses were similarly performed for per cent yellow area and per cent red area measured on the deviation map. Area under the receiver operating characteristic (AUROC) curve with 95% confidence interval (CI) was used to assess the diagnostic ability of FAZ metrics, parafoveal capillary density measurements and per cent area deviated from normal distribution to differentiate between eyes without SCR (control) and with any SCR (NP-SCR or P-SCR). A reference standard was provided by a retina specialist with full medical training to the fellowship level. SCR staging based on the Goldberg classification system was carried out by the reference standard.
Results
A total of 52 patients with sickle cell (33 NP-SCR and 19 P-SCR) and 20 age and race-matched controls from the Johns Hopkins Wilmer Eye Institute were included in this study. There was no significant difference in age (p=0.08, Kruskal-Wallis test) among the three study groups. The median age and range for the control, NP-SCR and P-SCR groups were 33 years (range: 22–55), 29 years (range: 19–70) and 39 years (range: 24–57), respectively. Participant characteristics are shown in table 1.
Participant characteristics
FAZ metrics
Boxplots of the FAZ metrics are shown in figure 2. There was no statistically significant difference between groups in FAZ area (p=0.606, Kruskal-Wallis test). However, FAZ perimeter was significantly greater in the P-SCR group when compared with the control group (p=0.045). FAZ acircularity index was significantly greater in the NP-SCR and P-SCR groups when compared with the control group with p=0.002 and p<0.001, respectively (Kruskal-Wallis tests).

Boxplots of foveal avascular zone (FAZ) metrics in different study groups. (A) FAZ area. (B) FAZ perimeter. (C) FAZ acircularity index. Significant p values for the post hoc pairwise comparisons after non-parametric Kruskal-Wallis tests are shown; all other comparisons were not significant (p>0.05). NP-SCR, non-proliferative sickle cell retinopathy; P-SCR, proliferative sickle cell retinopathy.
Parafoveal capillary density
There were significant differences in total and quadrant parafoveal capillary densities among study groups. Parafoveal capillary density measured in the entire image was lowest in the P-SCR group (36.43%±3.46%), followed by the NP-SCR group (37.19%±4.00%) and the control group (41.45%±1.95%) (table 2). Boxplots of total and quadrant parafoveal capillary densities for each group are shown in figure 3. Post hoc pairwise comparisons after non-parametric Kruskal-Wallis tests showed that parafoveal capillary densities measured in the entire image and four quadrants were significantly lower in the NP-SCR and P-SCR groups compared with the control group (table 2 and figure 3). No statistical significant difference between the NP-SCR and P-SCR was observed in all tested ROIs.

Boxplots of parafoveal capillary density in different study groups. (A) Total parafoveal capillary density measured in the entire image excluding the foveal avascular zone (FAZ) area. (B) Temporal quadrant. (C) Nasal quadrant. (D) Superior quadrant. (E) Inferior quadrant. Significant p values for the post hoc pairwise comparisons after non-parametric Kruskal-Wallis tests are shown; all other comparisons were not significant (p>0.05). NP-SCR, non-proliferative sickle cell retinopathy; P-SCR, proliferative sickle cell retinopathy.
Non-parametric Kruskal-Wallis tests and post hoc pairwise comparisons for parafoveal capillary density and per cent area deviated from normal distribution measurements in three study groups
In horizontal asymmetry analysis, the largest absolute parafoveal capillary density difference was found in the P-SCR group (3.33%±3.23%), followed by the NP-SCR group (2.60%±3.59%) and the control group (1.27%±1.13%). The same trend was also found in vertical asymmetry analysis with the largest absolute parafoveal capillary density difference found in the P-SCR group (2.97%±2.22%), followed by the NP-SCR group (1.95%±2.21%) and the control group (0.95%±0.71%). However, only the P-SCR group showed significantly horizontal asymmetry where parafoveal capillary density in the temporal quadrant was lower than that of the nasal quadrant (p=0.007, Wilcoxon signed-rank test) (figure 4A,B).

Boxplots show horizontal and vertical asymmetries of parafoveal capillary density (A, B), per cent yellow area (C, D) and per cent red area (E, F) measured at opposite quadrants in different study groups. (Left column) Temporal versus nasal quadrants. (Right column) Superior versus inferior quadrants. Only the temporal quadrant showed significantly lower parafoveal capillary density compared with the nasal quadrant in the proliferative sickle cell retinopathy (P-SCR) group. Temporal quadrant showed significantly higher per cent yellow area compared with the nasal quadrant in both non-proliferative sickle cell retinopathy (NP-SCR) and P-SCR groups. Significant p values for Wilcoxon signed-rank test are shown; all other comparisons were not significant (p>0.05).
Per cent area deviated from normal distribution
Similar to parafoveal capillary density results, per cent area deviated from normal distribution also showed significant differences in the entire image and four quadrants among study groups. Post hoc pairwise comparisons after non-parametric Kruskal-Wallis tests showed that per cent yellow area and per cent red area measured in the entire image and four quadrants were significantly higher in the NP-SCR and P-SCR groups compared with the control group (table 2). No statistical significant difference between the NP-SCR and P-SCR was observed in all tested ROIs.
In horizontal asymmetry analysis, the largest absolute per cent yellow area difference was found in the P-SCR group (12.53%±11.52%), followed by the NP-SCR group (9.68%±15.01%) and the control group (2.04%±3.09%). The same trend was also found in vertical asymmetry analysis with the largest absolute per cent yellow area difference found in the P-SCR group (12.84%±10.25%), followed by the NP-SCR group (6.53%±8.62%) and the control group (2.48%±2.12%) (figure 4C,D). However, only the NP-SCR and P-SCR groups showed significant difference in horizontal asymmetry where per cent yellow area in the temporal quadrant was higher than that of the nasal quadrant (p=0.048 and p=0.004, Wilcoxon signed-rank tests). A similar trend was found in the per cent red area horizontal asymmetry where only the P-SCR group showed significantly higher per cent red area at the temporal quadrant than that of the nasal quadrant (p=0.004, Wilcoxon signed-rank test) (figure 4E,F).
Area under the receiver operating characteristic
The results of the AUROC curve analyses for FAZ metrics, parafoveal capillary density measurements and per cent area deviated from normal distribution are shown in table 3. Unlike FAZ area and perimeter, which showed relatively poor diagnostic capability, FAZ acircularity index demonstrated good diagnostic capability of 0.82 AUROC when differentiating between eyes with and without SCR. Parafoveal capillary density and per cent area deviated from normal distribution of the entire OCT-A image also showed good diagnostic capability of 0.84–0.87 AUROC.
Area under the receiver operating characteristic (AUROC) curve analyses of the FAZ metrics, parafoveal capillary density and per cent area deviated from normal distribution in differentiating eyes without SCR (control) and eyes with SCR (NP-SCR and P-SCR)
Discussion
Although sickle cell maculopathy has been well documented in patients with sickle cell disease, the lack of quantitative data describing microvascular changes has limited our understanding of early changes in SCR and the best approach to monitoring progression. In recent attempts to measure FAZ area in patients with SCR, some studies using IV-FA and OCT-A have indicated that FAZ area is enlarged in patients with SCR compared with controls.22–25 Our findings failed to show any statistically significant difference between the control and SCR groups (figure 2). However, given the substantial variability in FAZ area among controls as well as diseased eyes, this metric alone may be insufficient for discriminating controls and patients with SCR.18 26–29 Additionally, the discrepancy from our findings may have been due to difference in sample size, the use of both eyes from the same subject or the lack of age and race-matched controls in the prior studies. In agreement with prior OCT-A studies, however, both NP-SCR and P-SCR groups showed significantly higher FAZ acircularity index due to the increased parafoveal capillary tortuosity at the FAZ border, suggesting that FAZ acircularity index may be a more sensitive metric to discriminate SCR from control (figure 2C).
In this study, we employed a unique quantitative approach which measured parafoveal capillary density only after the removal of larger blood vessels. This was performed in a quadrant-specific manner to investigate whether parafoveal capillary dropout preferentially affects particular areas of the macula in SCR. As expected, parafoveal capillary density was found to be lowest in the P-SCR group, followed by the NP-SCR and control group compared with healthy controls. In comparison of parafoveal capillary density measured at four quadrants, both NP-SCR and P-SCR groups showed significantly lower density compared with the control group in all four quadrants (figure 3). Prior studies have demonstrated that retinal thinning temporal to the fovea is associated with peripheral neovascularisation in SCR.15 30 Our observation of horizontal asymmetry with lower parafoveal capillary density at the temporal retina than the nasal retina in P-SCR group supports the prior observation that capillary dropout is more prevalent in the temporal retina than the nasal retina (figure 4A). It is worth noting that no vertical asymmetry was observed in both SCR groups (figure 4B).
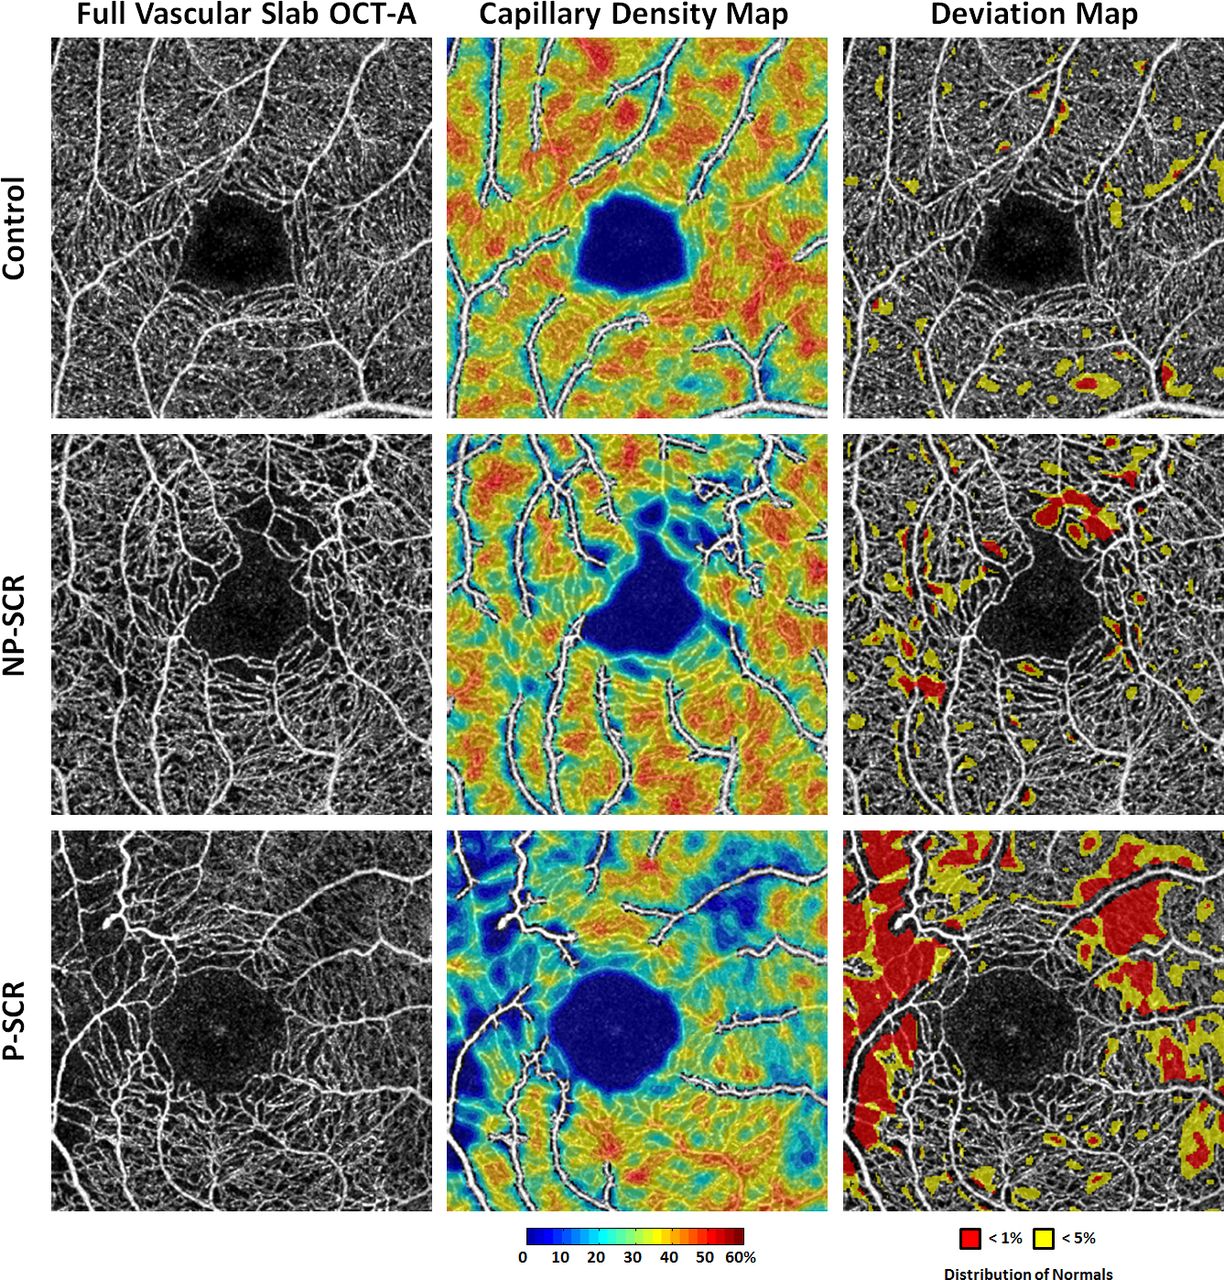
While measurements of parafoveal capillary density using OCT-A have become more common in the literature, the clinical significance of these measurements remains unclear given the lack of comparison to normative values. This study is the first to analyse parafoveal capillary density data in a deviation map comparing SCR to age and race-matched controls. Our normative-based deviation mapping method specifically depicts areas with parafoveal capillary density below 1% (red) and 5% (yellow)of the normal distribution, highlighting areas which are most likely to be abnormal (figure 5, right column). Figure 5 shows that while parafoveal capillary density decreases (middle column), total area below 5% and 1% of normal distribution increases with increasing SCR severity (right column). Measurements of regions severely deviated from normal distribution appear to be a more sensitive method for detecting horizontal asymmetry in both NP-SCR and P-SCR groups as compared with using parafoveal capillary density alone (figure 4C,E).
Comparison of parafoveal capillary density and deviation maps in (top row) healthy control, (middle row) NP-SCR and (bottom row) P-SCR. (Left column) Contrast-stretched full vascular slab OCT-A. (Middle column) Parafoveal capillary density maps with non-capillary blood vessels indicated in white due to the exclusion from density computation. (Right column) Corresponding deviation maps. Parafoveal capillary density below 5% and 1% of the normative database is indicated in yellow and red, respectively. While parafoveal capillary density decreases, total area below 5% and 1% of normal distribution increases with increasing SCR severity. The temporal aspect of the parafovea is to the left in all images. NP-SCR, non-proliferative sickle cell retinopathy; OCT-A, optical coherence tomography angiography; P-SCR, proliferative sickle cell retinopathy.
Notably, our findings did not show statistical significant differences between the NP-SCR and P-SCR groups for any comparisons of FAZ metrics or parafoveal capillary density measurements. We attribute this to the random sampling of the tested eye from the control and SCR groups. To avoid interocular correlation, only one eye was selected randomly from each participant when both eyes were available. However, prior studies have observed that significant interocular asymmetry of FAZ metrics in healthy controls and disease severity in SCR may exist within the same individual.7 28 Interocular asymmetry together with the random sampling may have reduced the ability to detect statistical significant difference between the NP-SCR and P-SCR groups due to higher data variability. Additional studies evaluating the degree of interocular asymmetry in eyes with SCR might prove useful for determining the more representative eye to grade the extent of disease.
There were a number of limitations to be noted in this study. First, the relatively small sample size restricted our ability to substratify patients with sickle cell according to the Goldberg classification of five different stages of retinopathy. Second, there may have been some artefactual effect on capillary recording due to the reported reduced blood flow velocity in patients with sickle cell disease.31–34 Some non-perfused capillaries in the patients with SCR may have been the result of blood flow velocities below the detection threshold of the OCT-A system rather than due to non-perfusion. This may have led to an overestimation of FAZ metrics and parafoveal capillary dropout. Third, individual axial length was not obtained for the correction of ocular magnification, reducing the accuracy of the FAZ metrics and parafoveal capillary density measurements.17 35 Finally, a full vascular slab containing both superficial and deep microvascular networks was used for measurement of parafoveal capillary density. While this approach has been successful in reducing artefactual non-perfusion in patients with macular oedema due to poor OCT layer segmentation in diabetes or vein occlusion, it does not take advantage of OCT-A’s ability to measure superficial and deep vascular layers individually. Since sickle cell maculopathy does not take the form of cystic oedema which displaces retinal layers on OCT scans, modifying the method in future studies to look at individual capillary layers might enhance the sensitivity of the technique for this disease.
In summary, our customised OCT-A image processing analysis highlights significant quantitative alterations in perfusion density mapping in a qualitative display, with minimal obscuration in OCT-A image detail. Regardless of the retinopathy stage, FAZ acircularity index appeared higher in patients with SCR when compared with controls. Our findings confirmed the observation of horizontal asymmetry with lower parafoveal capillary density in the temporal retina associated with the presence of neovascularisation in eyes with SCR. The application of normative-based parafoveal capillary density deviation mapping in patients with SCR shows promise for immediate qualitative and quantitative assessments of SCR, which may prove useful for clinical management.
References
Footnotes
Correction notice The paper has been corrected since it was published Online First. Table 2 has been replaced with an updated version.
Contributors AWS and TYC were involved in study conceptualisation and supervision. All authors were involved in data curation, data interpretation, manuscript drafting and editing. GL and TYC were involved in formal data analysis and validation.
Funding This study was supported by the National Eye Institute of the National Institutes of Health under award numbers R01EY027301 and R01EY024969. Additional funding for this research was provided by the New York Eye and Ear Infirmary Foundation Grant, Marrus Family Foundation, the Geraldine Violett Foundation, the Edward N & Della L Thome Memorial Foundation, the Jorge N Buxton Microsurgical Foundation, unrestricted contributions to the Johns Hopkins University Retina Division research fund and by private philanthropy from Gail C and Howard Woolley, Baltimore, Maryland.
Disclaimer The content is solely the responsibility of the authors and does not necessarily represent the official views of the National Institutes of Health. The sponsors and funding organisations had no role in the design or conduct of this research.
Competing interests RBR: Optovue: Code C (Consultant); Boehringer Ingelheim: Code C (Consultant); Astellas: Code C; Genentech-Roche: Code C; NanoRetina: Code C; OD-OS: Code C; Opticology: Code I (Personal Financial Interest); Guardion: Code I (Personal Financial Interest); GlaucoHealth: Code I (Personal Financial Interest); Regeneron: Code C; Bayer: Code C; Diopsys: Code C (Consultant); Teva: Code C (Consultant). JC: Optovue: Code F (Financial Support). REL: Optovue: Code C (Consultant).
Patient consent for publication Not required.
Ethics approval Johns Hopkins University School of Medicine Institutional Review Board
Provenance and peer review Not commissioned; externally peer reviewed.
Data availability statement All data relevant to the study are included in the article or uploaded as supplementary information.
Linked Articles
- At a glance