Article Text

Abstract
Background/aims To assess the agreement in measuring retinal nerve fibre layer (RNFL) thickness between spectral-domain (SD; Cirrus HD, Carl Zeiss Meditec, USA) optical coherence tomography (OCT) and swept-source (SS; Plex Elite 9000, Carl Zeiss Meditec) OCT using an OCT angiography (OCTA) scanning protocol.
Methods 57 participants (12 glaucomatous, 8 ocular hypertensive and 74 normal eyes) were scanned with two OCT instruments by a single experienced operator on the same day. Circumpapillary RNFL thicknesses were automatically segmented for SD-OCT and manually segmented for SS-OCTA scans. Agreement of global RNFL thickness, as well as average thickness in four quadrants was assessed using intraclass correlation coefficients (ICCs).
Results There was excellent agreement in the inferior and superior quadrants and the global (all ICC >0.90), followed by good agreement in the temporal (ICC=0.79) and nasal (ICC=0.73) quadrants. The ICC values were similar in the subgroups except within the ocular hypertension group, where the nasal quadrant was less agreeable (ICC=0.31). SS-OCTA-derived RNFL thickness was on average 3 µm thicker than SD-OCT, particularly in the nasal (69.7±11.5 µm vs 66.3±9.3 µm; p<0.001) and temporal (75.6±13.7 µm vs 67.9±12.3 µm; p<0.001) quadrants.
Conclusions RNFL measurements taken with SS-OCTA have good-to-excellent agreement with SD-OCT, which suggests that the RNFL thickness can be sufficiently extracted from wide-field OCTA scans.
- retina
- imaging
This is an open access article distributed in accordance with the Creative Commons Attribution Non Commercial (CC BY-NC 4.0) license, which permits others to distribute, remix, adapt, build upon this work non-commercially, and license their derivative works on different terms, provided the original work is properly cited, appropriate credit is given, any changes made indicated, and the use is non-commercial. See: http://creativecommons.org/licenses/by-nc/4.0/.
Statistics from Altmetric.com
Introduction
Over the past two decades, optical coherence tomography (OCT) has been widely used to measure the thickness of retinal tissues with unprecedented resolution.1 Retinal nerve fibre layer (RNFL) is the anterior-most layer of the inner retina, comprising of the axons of retinal ganglion cells.2 Thinning of RNFL is a well-established indicator of retinal ganglion cell axon loss.2–4 Specifically, the RNFL thickness is typically obtained by selecting of a neuroretinal ring around the optic disc, followed by a comparison of patient’s RNFL thickness profile with the normative database. Most commercial SD-OCT systems acquire the cross-sectional circumpapillary retina either by reconstructing the circular scan from the volumetric data of the raster scan pattern, for example, Cirrus (Carl Zeiss Meditec, USA), or directly by applying circular scans centred at the optic disc, for example, RTVue (Optovue, Inc, California, USA).
In the recent years, some authors have suggested the OCT angiography (OCTA), a functional extension of OCT5–7 as a diagnostic tool for glaucoma.8–10 In particular, a reduction in capillary density in the peripapillary and macular regions could potentially be a biomarker for early glaucomatous damage before visual field loss.11 OCTA scans also carry structural information and in the case of wide-field imaging contain both the macular and the optic nerve head (ONH) area. Therefore, using both the structural (RNFL thickness) and vascular (capillary density) information from a single wide-field scan of swept-source (SS)-OCTA may provide better diagnostic accuracy than either one alone. However, SS-OCTA operates at longer wavelengths and lesser light scatters back from inner retinal structures, resulting in lower signal-to-noise ratio. This increases the uncertainty for RNFL thickness layer segmentation and may be reduce its reliability and reproducibility. Moreover, SS-OCTA systems are commonly associated with lower axial resolution, because of longer coherence length, which could decrease the precision of layer boundary detection. Therefore, it is worthwhile to investigate whether one single angiography scan from a SS-OCTA system can derive similar RNFL thickness measurement as the SD-OCT.
Methods
Study participants
Singapore Imaging Eye Network is a clinical cross-sectional study investigating the effects of vascular abnormalities in individuals aged 21 years and older with a variety of eye conditions. A total of 57 participants (12 glaucomatous, 8 ocular hypertensive and 74 normal eyes) were consecutively recruited from Singapore National Eye Centre, a tertiary eye care institution in Singapore, from July 2018 to September 2018. Written Informed consent was obtained from participants.
Test eyes were classified as glaucomatous, ocular hypertension (OHT) or normal based on the following criteria. Glaucomatous eyes had a pathological optic disc appearance and glaucoma hemifield test outside normal limits. Glaucoma severity was staged based on the standard automated perimetry using the simplified version of Bascom Palmer Glaucoma Staging System12: mild glaucoma (mean deviation (MD) ≥−6 dB), moderate glaucoma (−6.01 to −12.00 dB) and severe glaucoma (MD <−12 dB). Ocular hypertensive eyes were defined as normal optic disc appearance, normal visual fields and untreated history intraocular pressure (IOP) (>23 mm Hg). Normal eyes were defined as individuals who were free from clinically relevant eye conditions such as glaucoma, diabetic retinopathy, age-related macular degeneration and ocular vascular occlusive disorders.
After an interview to obtain demographic, previous medical and ophthalmic history, each participant underwent standardised eye examination including measurement of visual acuity using a logarithm of minimum angle of resolution chart (LogMAR chart, The Lighthouse, New York, USA), autorefraction-keratometry, intraocular pressure measurement, retinal photography and OCT imaging (see later section). All eyes were imaged after pharmacological dilation (tropicamide 1%).
OCT imaging
Both spectral-domain (SD)-OCT and SS-OCT detect the signal in frequency domain and convert the spectral signal to structural information by Fourier transform. The SD-OCT uses a broadband superluminance diode (central wavelength λc=840 nm) as the light source, and the spectral fringes are dispersed by a grating and detected by a linescan camera, which operates at 68 000 A-scans/s. The axial and lateral resolutions in tissue are 5 µm and 15 µm, respectively. A 6×6 mm2 area centred at the ONH was scanned. Each scan consists of 200 cross-sectional images, and each image has 200 A-scans. Retinas were positioned close to the zero-delay line to ensure high contrast.
The SS-OCT uses a wavelength scanning laser (λc=1050 nm) as light source, and the spectral information is acquired by a photodetector. The system operation speed is dependent on the scanning rate of the swept source (100 000 A-scans/s), and the axial and lateral resolutions in tissue are 6.3 µm and 20 µm, respectively. An OCT angiography scanning pattern with an area of 6×6 mm2 was centred at the optic disc. Each scan consisted 400 cross-sectional images, and each image consisted of 400 A-scans. In both systems, linescan ophthalmoscope (LSO) eye tracker was integrated to compensate the artefacts caused by blinking, bulk motion and involuntary eye motion.
Image processing and RNFL segmentation
For the commercial SD-OCT, a review software (Zeiss Meditec, Inc) provided automatic on-board circumpapillary RNFL layer segmentation from a 3.46 mm diameter neuroretinal ring around the optic disc. For the SS-OCT prototype, raw intensity was exported to MATLAB (Mathworks Inc, Natick, Massachusetts, USA), and a custom algorithm was created to acquire circumpapillary RNFL thickness. First, all the images were reconstructed into a three-dimensional volume and projected onto a two-dimensional enface view (figure 1A). The boundary of the optic disc was then manually delineated, and the centre of the optic disc was determined by automatically finding the best ellipse fit of the optic disc boundary. Next, three circumpapillary cross-sectional scans at diameters of 3.44 mm, 3.46 mm and 3.48 mm from the optic disc centre (locations indicated by yellow rings on figure 1A) were extracted from the volume and averaged into a more smoothed image (figure 1B vs figure 1C). figure 1E,G shows the zoomed in features of the smoothed image. Compared with the non-averaged images (figure 1D and F), the noise was greatly reduced, and RNFL boundaries were more visible. Finally, the RNFL boundaries were segmented manually by a trained grader (TH). The thickness of four quadrants as well as the global average were extracted for further analysis.
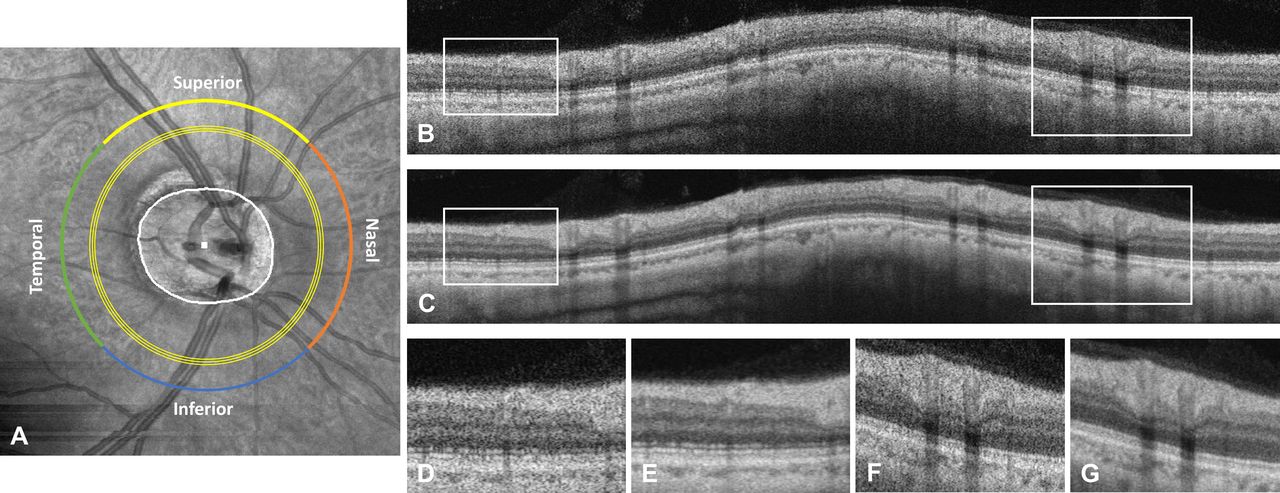
Example of circular circumpapillary RNFL extraction from a 6×6 mm volumetric scan obtained from SS-OCT using an angiography protocol. (A) The boundary of the optic disc was labelled manually (white line), and the centre of the optic disc (white dot) was defined by fitting the optic disc boundary with an ellipse. Three concentric scans with 3.44 mm, 3.46 mm and 3.48 mm diameters from the optic disc centre were extracted and averaged into (C). The non-averaged single circular scan from 3.46 mm is also displayed (B). Zoomed in features showing lower noise and better RNFL boundary are shown in figure parts E and G), compared with the non-averaged images (D and F). The global average, as well as quadrant average, was calculated. OCT, optical coherence tomography; RNFL, retinal nerve fibre layer; SS, swept-source.
Statistical analysis
The coefficient of variance (COV) of RNFL thickness was calculated in four quadrants and the global average. We used a paired t-test with SEs adjusted for individual clustering to compare mean circumpapillary RNFL thickness measured by the two types of OCT machines. Scatter plots and Pearson’s r were used to examine the correlation between these two types of measurements. We quantified inter-rater reliability using the intracluster correlation, using non-parametric bootstrapping with individuals as the resampling clusters to estimate CIs that account for the correlation of measurements between eyes of the same individual. Agreement of RNFL thickness was assessed using intraclass correlation coefficients (ICCs), where ICC values less than 0.5, between 0.5 and 0.75, between 0.75 and 0.90 and greater than 0.90 indicate poor, moderate, good and excellent agreement, respectively.13 The visual representation of agreement was presented using Bland-Altman plots. These analyses were repeated for each of four quadrants and the global average across these quadrants. The statistical software, Stata V.15, was used for all analyses.
Results
Table 1 shows the characteristics of the included participants. A total of 57 subjects (age: 63.0±7.4 years, range: 46–81 years) were enrolled into this study, and good quality images were obtained in 94 out of 116 eyes (right eye=48; left eye=46) from both machines. As expected, the visual field mean deviation of the 12 glaucomatous eyes was the worst at −5.75±3.22 dB, where 58% had mild glaucoma (n=7), 33% had moderate glaucoma (n=4) and only one had severe glaucoma.
Characteristics of participants
Mean RNFL thickness, COV as well as the thickness differences, ICC values of the two OCT systems are displayed in table 2. In all participants, the COVs were highest in the nasal quadrant and lowest in the inferior quadrant for both the systems. The COVs obtained with SS-OCT was generally lower than with SD-OCT, except for the temporal quadrant. In the glaucoma subgroup, both systems detected significantly thinner RNFL compared with other participants in the global average as well as in superior, inferior and temporal quadrants (all p<0.05, unpaired t-test), but no difference was detected in the nasal quadrant (p>0.79, unpaired t-test). In the glaucoma subgroup, the quadrant thickness was thickest in superior followed by inferior, nasal and temporal.
Comparison of RNFL thickness measured by two OCT systems, stratified by glaucoma status
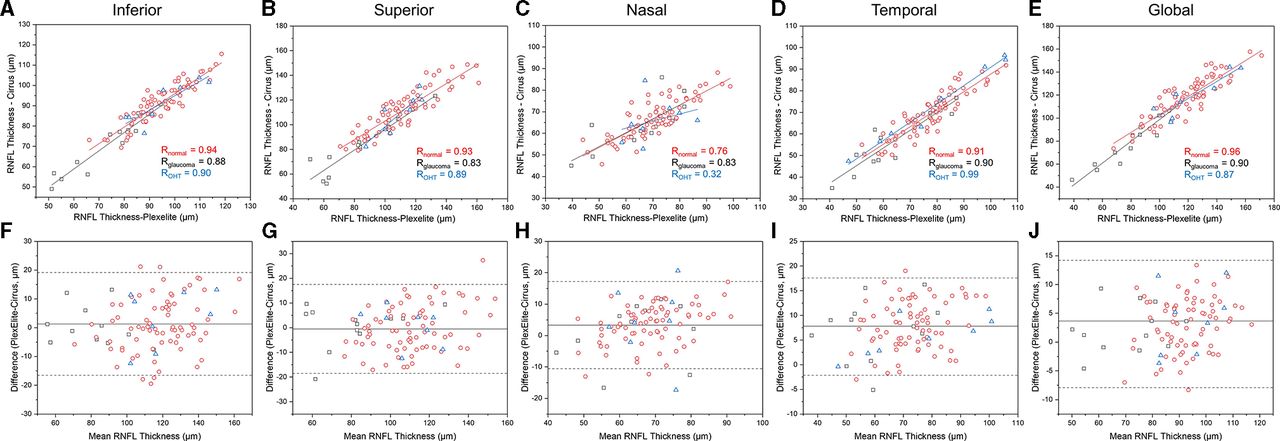
Figure 2A–E show the scatter plots of thickness measurements between the two systems, as stratified by various quadrants. Both SS-OCT and SD-OCT derived RNFL thickness were highly correlated (all r>0.87). However, the correlation was relatively weak in the nasal quadrant (normal eyes: r=0.76; glaucoma eyes: r=0.83; ocular hypertensive eyes: r=0.32).

Scatter plots (A–E) with linear regression analysis and Bland-Altman plots (F–J) of circumpapillary RNFL thickness measurements by SD-OCT and SS-OCT using an angiography protocol. Black square: glaucoma participants. Red circle: normal participants. Blue triangle: OHT participants. OCT, optical coherence tomography; RNFL, retinal nerve fibre layer; SD, spectral-domain.
In all the participants, there was an excellent agreement between the RNFL-derived thickness measurement from the SS-OCT and SD-OCT (all ICC >0.90; table 2), except for the nasal (ICC=0.73) and the temporal quadrant (ICC=0.79; table 2). In the normal subgroup, there was good agreement for all four quadrants and the global average (all ICC between 0.71 and 0.90). In the glaucoma subgroup, the agreement was excellent except for the nasal (ICC=0.76) and temporal (ICC=0.81) quadrants. In the OHT subgroup, the nasal quadrant thickness agreement was poor (ICC=0.31), while the agreement was good-to-excellent in the other quadrants and the global average.
Figure 2F–J shows the Bland-Altman plots for comparing the thickness difference measured by SS-OCTA and SD-OCT. The mean global RNFL thickness assessed by SS-OCT was 3.0 µm thicker than with a SD-OCT (91.6±13.5 µm vs 88.6±12.5 µm; p<0.001). The difference was mainly found in the nasal and temporal quadrants, where the thickness measured by SS-OCT was on average 3.4 µm (p<0.001) and 7.7 µm (p<0.001) thicker in the nasal and temporal quadrants, respectively. In the normal subgroup, SS-OCT-derived RNFL thickness measurements were significantly thicker than SD-OCT in the nasal and temporal quadrants, as well as the overall average (all p<0.001). However, in the glaucoma and OHT subgroups, only values in the temporal quadrant were significantly different between the two systems (p<0.05).
Discussion
In this study, we investigated the agreement of RNFL thickness measured by SS-OCTA using an angiography protocol versus an SD-OCT. Our data showed that RNFL measurements taken with PlexElite have good-to-excellent correlation to Cirrus. However, there is a systematic difference in the RNFL measurements, especially in the nasal and temporal quadrants, which indicates that the measurements between two machines should not be used interchangeably. This is in compatible with previous studies indicating that RNFL thickness values between different OCT instruments differ14–19 and supports the well-known fact that longitudinal follow-up of patients with glaucoma has to be done with one specific device. Our results prove that the RNFL thickness can be well obtained based on a single wide field SS-OCT angiography scan, which allows for extraction of both structural and vascular parameters. Combining vascular with structural parameters may enhance diagnosis and detection of glaucoma progression. The importance of measuring structural and vascular parameters of the optic disc at the same instance may also be useful in the clinical evaluation of vascular conditions such as inflammatory or ischaemic optic neuropathy.20–22
Several studies have previously investigated the repeatability of OCT devices for measuring RNFL as well as the agreement between different systems. The intervisit and intravisit reproducibility were good-to-excellent using either time-domain (TD-OCT), SD-OCT or SS-OCT machines, both in normal and glaucomatous eyes.14 15 23–25 However, the thickness values measured by different machines are not the same. In particular, the RNFL measurement as obtained using TD-OCT (Stratus, Carl Zeiss Meditec) was reported to be thicker than that obtained using SD-OCT machines.15–17 Comparison studies between different SD-OCT machines revealed that Cirrus measurements were on average 4 µm, 5 µm and 14 µm thinner compared with Spectralis (Heidelberg Engineering, Heidelberg Germany),19 3D OCT-1000 (Topcon Corporation, Tokyo, Japan)16 and RTVue.18 We found here that the PlexElite RNFL thickness was on average 3.0 µm thicker than that obtained by Cirrus, and the difference was mainly due to the values from the nasal and temporal quadrants where the RNFL was generally thinner. The exact reasons for the differential measurements remain unknown. Some likely contributions may arise from signal strength, laser wavelength, optic disc centroid, segmentation algorithms and tracking systems. To complicate matters further, these factors are intimately inter-related with each other. For example, longer laser wavelength could result in less scattering in the inner retinal and may as such be associated with lower signal strength and unreliable segmentation. The two systems we have compared here both used LSO-based eye tracker during acquisition, and scanning areas were identical. However, SD-OCT has a slightly higher axial resolution as compared with the SS-OCT (5 µm vs 6.3 µm in tissue). Lower imaging resolution broadens the layer edge, which consequently makes the layer appear thicker. Moreover, we manually delineated optic disc boundary from PlexElite, which provided accurate optic disc centroid prediction, while the accuracy of the Cirrus automatic optic disc centroid detection remains an uncertainty. Determination of the optic disc centroid has been shown important to RNFL measurement reproducibility and longitudinal follow-ups especially in the nasal and temporal quadrants,26 which could potentially contribute to the higher variation observed in these two quadrants. Differences in the orientation of the optic disc between scans will cause a shift of four quadrants because their definition is related to the scanning direction.27 For instance, anti-clockwise rotation of the optic disc of the right eye would misclassify part of the superior region into the nasal region and result in an artificial increase of the RNFL thickness in the nasal quadrant.
Finally, segmentation errors were considered as a major contributor to the RNFL thickness differences when comparing one machine to another.17 28 This factor is, however, not easily assessed because manufacturers usually do not reveal their algorithms or enable segmentation check in greater details. Nowadays, many automatic retinal layer segmentation algorithms have been developed, but it is difficult to determine which algorithm is preferable because of the lack of a gold standard. Even though previous studies showed a strong variation of absolute RNFL thickness values among different OCT systems, their performance for glaucoma diagnosis appears to be relatively similar.29 30 Nevertheless, some patients may have RNFL thickness within normal limits when evaluated with one specific device and abnormal values when measured with another device. Moreover, inherent anatomical differences between study subjects lead to variability, misclassification31 and difficulty in accurate segmentations, for example, in diagnosing glaucoma in patients with myopic disc changes.32 33
The advantages of the SS-OCT system with higher acquisition speed and better signal roll-off is obvious as it allows the scanning of a larger field of view including the optic disc and fovea in one shot without compromising the sampling density. Conventionally, the RNFL thickness using SD-OCT is evaluated from a single circle around the optic disc, but wide-field scan could be more effective in determining the RNFL thickness progression.34 In addition, wide-field scanning enables the ganglion cell analysis from the fovea together with RNFL measurements to better understand the relation between the loss of macular ganglion cells and their axons.35
Some limitations need to be recognised in this study. First, the small sample size of glaucoma subgroup (12 eyes). Also, majority of our patients with glaucoma had mild to moderate glaucoma. We only had one patient with severe form of glaucoma, which is associated with pronounced thinning of the RNFL thickness. Given the low ICC value in the nasal quadrants (mostly thinner) in the present study, consistency may be worse in advanced cases. Second, as discussed above, we applied different segmentation approaches on the two systems. Therefore, differences may either be a result from hardware or software. Last, the manual segmentation was done by a single-trained grader, and this may inadvertently introduce systematic error in segmentation.
In conclusion, there was overall good-to-excellent agreement of RNFL thickness measured by SS-OCT and SD-OCT systems. The agreement was least in the nasal quadrant of the OHT subgroup. RNFL thickness measured by the two machines are, however, not interchangeable. The data do indicate that wide-field OCTA scans can be used in the future for evaluating RNFL thickness in patients with ONH disease.
References
Footnotes
Contributors LS, MA and RH conceived the idea; BT, JC, TH and DWKW conducted the data analysis; AL and YLT collected the data; AL conducted the statistical analysis; BT prepared the first draft; all authors contributed to the data interpretation; all authors contributed to the final version of the manuscript.
Funding This work was funded by grants from the National Medical Research Council (OFIRG/0048/2017, NMRC/CG/C010A/2017, NMRC STaR/0016/2013), Singapore.
Competing interests None declared.
Patient consent for publication Obtained.
Ethics approval This study was approved by the SingHealth Centralized Institutional Review Board and conducted in accordance to the Declaration of Helsinki.
Provenance and peer review Not commissioned; externally peer reviewed.
Data availability statement Data are available on request.
Linked Articles
- At a glance