Article Text

Abstract
Background/Aim To investigate the prevalence, causes and risk factors of visual impairment (VI) among the elderly in ‘home for the aged’ in Hyderabad, India.
Methods Individuals aged ≥60 years were recruited from 41 ‘homes for the aged’. All participants had complete eye examinations including presenting visual acuity, refraction, slit-lamp examination, intraocular pressure measurement and fundus imaging by trained clinicians. VI was defined as presenting visual acuity worse than 6/18 in the better eye. Multivariate logistic regression was used to determine the risk factors associated with VI.
Results 1512 elderly residents from 41 homes for the aged were enumerated, of whom 1182 (78.1%) were examined. The mean age of examined participants was 75.0 years (SD 8.8 years; range: 60–108 years); 35.4% of those examined were men. The prevalence of VI was 30.1% (95% CI 27.5 to 32.8). The leading cause of VI was cataract (46.3%, n=165), followed by uncorrected refractive error (27.0%, n=96), posterior capsular opacification (14.9%, n=53) and posterior segment disease (6.5%, n=23). Overall, 88.2% of the VI was either treatable or correctable. In multiple logistic regression, those aged 80 years and older (OR: 1.7, p<0.01), living in ‘free’ homes (OR: 1.5, p<0.01) and who were immobile/bedridden (OR: 3.02, p<0.01) had significantly higher odds of VI. Gender was not associated with VI.
Conclusions VI was common and largely avoidable in residents of ‘homes for the aged’ in Hyderabad, India. Screening for vision loss in ‘homes for aged’ and the provision of appropriate services should become routine practice to achieve the goal of healthy ageing in India.
- epidemiology
- vision
- public health
This is an open access article distributed in accordance with the Creative Commons Attribution Non Commercial (CC BY-NC 4.0) license, which permits others to distribute, remix, adapt, build upon this work non-commercially, and license their derivative works on different terms, provided the original work is properly cited, appropriate credit is given, any changes made indicated, and the use is non-commercial. See: http://creativecommons.org/licenses/by-nc/4.0/.
Statistics from Altmetric.com
Ageing is associated with declines in health status, physical function, cognition, frailty, and other physical and physiological functions.1 Ageing also makes one vulnerable to other health problems, including vision loss. Over 250 million people are visually impaired globally,2 and 80% of them are 50 years of age or older. A large proportion of this vision loss is avoidable (preventable, treatable or correctable) with relatively simple interventions such as use of spectacles and cataract surgery.3–7 Vision loss adversely impacts the quality of life of the elderly population8–10 and is associated with mortality.11–13 Previous studies have found that vision loss is more common in institutionalised populations and among the elderly in residential care.14–18
According to the 2011 Indian census, 8% of the population is aged ≥60 years or ‘elderly’, and this proportion will increase to 20% by year 2050. This translates to 195 million elderly individuals by year 2030 and 324 million by year 2050.19 The population of India will grow by 55% by 2050, and the percentage of elderly people will increase by 326%, with those aged ≥80 years increasing by 700%, making them the fastest-growing age group.19
The longitudinal Hyderabad Ocular Morbidity in Elderly Study (HOMES)20 is designed to (1) investigate the prevalence, causes, risk factors and impact of visual impairment (VI) among the elderly individuals living in residential care facilities in Hyderabad (pre-intervention), and (2) assess the impact of interventions such as spectacles and cataract surgery on visual functions, falls, fear of falls and depression (post-intervention). In this paper, we report on the prevalence, causes and risk factors of VI in this study population.
Materials and methods
Participants provided written informed consent. HOMES was carried out in the ‘home for the aged’ centres in Hyderabad and adjoining regions of the Greater Hyderabad Municipal Corporation in the south Indian state of Telangana.20 In total, 46 of 76 (60.5%) ‘homes for the aged’ in this region were selected and invited to participate in the study (including 5 for pilot study). The residents who were aged ≥60 years at the time of enumeration and had been residing in these homes for at least 1 month and agreed to participate were included in the study.
Eye examinations
The details of the design and the study methodology of HOMES were described in our previous report.20 In brief, the field investigators visited the selected homes and enumerated all residents. Informed consent was obtained, and detailed interviews were conducted. Personal and demographic information such as age, gender, level of education (years of education) and years of residence in the home and other details were collected using precoded questionnaires. Data were also collected on risk factors such as smoking (never smokers and ever smokers, including current and past smoker) and alcohol consumption (no alcohol and ever alcohol, including current and past alcohol consumption), and a self-report of systemic conditions (diabetes, hypertension and heart disease) and current medication for these conditions. Based on the interviewer’s observations and self-report, the mobility status of the participants was classified as ‘independently mobile’, ‘mobile with assistance’ and ‘immobile/bedridden’. Homes for the aged were classified as (1) private homes, where the individual or their kin pay a monthly or annual user fee; (2) aided/partially subsidised homes, where the individuals or their kin pay a part of the user fee and the rest of the amount is met by philanthropic support or other funding sources; and (3) free homes, where individuals need not pay any user fee as homes are supported by external funding sources.
A ‘makeshift’ clinic was set up in each of the homes and eye examinations were carried out by trained clinicians that included optometrist and vision technicians. Interviews and the clinical examination were conducted on different days to ensure that elderly participants were adequately rested. Interviews were done prior to the clinical examinations. At least two attempts were made within a period of 2 weeks to enrol participants who were not available at the time of the first visit.
The eye examination included assessment of visual acuity (VA) for distance and near using logMAR (logarithm of the minimum angle of resolution) charts.20 Distance VA was assessed at a distance of 3 m in a well-illuminated room (at least 180 lux), and near vision was assessed at a fixed distance of 40 cm. The charts with tumbling E optotypes and English letter alphabets were used. Presenting VA and pinhole VA were assessed. Both manual and autorefraction were done. Subjective refraction was performed on all participants and best corrected VA was obtained. The anterior segment of the eye was examined using a handheld portable slit-lamp biomicroscope (BA 904, Haag-Streit Clement Clarke International, UK). Intraocular pressure was measured using a Perkins applanation tonometer (Mk3, Haag-Streit Clement Clarke International, UK). Fundus images were taken through undilated pupils using a non-mydriatic fundus camera (Visuscout 100 Handheld Fundus Camera, Carl Zeiss Meditec, USA). Both disc-centred and macula-centred images were attempted for each eye, which was graded by trained graders. Among those with aphakia or pseudophakia, distance direct ophthalmoscopy was done in a semi-dark room to grade density, area and extent of posterior capsular opacification (PCO) in the pupillary area. This was graded as (1) no posterior capsule, (2) clear posterior capsule (clear fundus glow visible), (3) hazy posterior capsule (dull fundus glow visible or few dark spots visible), (4) opaque posterior capsule (no fundus glow visible), and (5) cannot examine posterior capsule (for reasons such as opaque cornea, absent globe, phthisis bulbi).
The main cause of VI was assigned by the clinician for each eye and then for the person.20 Where there were multiple causes, based on the clinical examination and the retinal images, the cause that was more likely to explain the vision loss was considered as the main cause in that eye. At the person level, in cases where there were different causes of VI in both the eyes, the cause that was more easily correctable or treatable was assigned. For example, if the cataract was the cause of VI in the right eye and undercorrected/uncorrected refractive error (URE) in the left eye, URE was marked as the main cause of VI and used for analysis. Similarly, if one eye had mature cataract and the other had PCO, then the main cause of VI for the individual was considered PCO as it is easier to address compared with cataract surgery.
VI was defined as presenting VA worse than 6/18 in the better eye. VI was subdivided into blindness (worse than 3/60), severe VI (worse than 6/60–3/60) and moderate VI (worse than 6/18–6/60). VI caused by cataract, URE or PCO was considered as avoidable, which included treatable and correctable causes. All participants who had VI due to URE were provided with spectacles. Those with VI due to other causes such as cataract and/or those who needed further care were referred to the L V Prasad Eye Institute for services. All services and spectacles were provided at ‘no cost’ to the participants.
Data management
Data were collected using precoded questionnaires and entered in a database developed in Microsoft Access, with validation checks for minimising data entry errors using double data entry. Data analysis was conducted using Stata Statistical Software for Windows V.14.21 Prevalence estimates were calculated and presented with 95% CI. Multiple logistic regression models were used to examine the strength of association between VI and all the potential risk factors. Hosmer-Lemeshow goodness-of-fit test was used to assess the goodness of the model fit. Variance inflation factors were used to test for collinearity between the covariates after fitting a multiple regression model. Adjusted ORs with 95% CIs were presented. Statistical significance was assessed at the conventional level of p value less than 0.05 (two-tailed).
Results
Study participants
In total, 1513 elderly participants were enumerated from 41 homes for the aged, of whom 1182 (78.1%) were examined, 179 (11.8%) were not available for examination after two attempts and 152 (10.1%) refused to undergo eye examinations. Those examined and non-examined were similar in terms of age (p=0.05) and gender (p=0.31). Participation rates ranged from 80.2% among the free homes, 80.8% in aided/partially subsidised homes and 75.0% in private homes (p=0.03) (table 1). The mean age of examined participants was 75.0 years (SD 8.8 years; range: 60–108 years), and 35.4% (n=418) were men. Of the participants, 20.3% (n=240) had no formal education, 60.7% (n=717) had school education and 19% (n=225) had higher education. Among those examined, 9.2% (n=108) were bedridden or immobile, 32.0% (n=378) were mobile with assistance and 58.8% (n=695) were independently mobile. In total, 42.4% (n=190) of the participants were from private homes, 41.5% (n=491) were from aided/partially subsidised homes and the remaining 16.1% (n=190) were from free homes. More than two-thirds of the participants reported living in homes for less than 5 years (68.2%, n=806), 17.3% (n=205) reported living in homes for 5–9 years, and 14.5% (n=171) reported living in homes for 10 years or more.
Characteristics of the participants examined and not examined (n=1513) in the HOMES
Prevalence and causes of VI
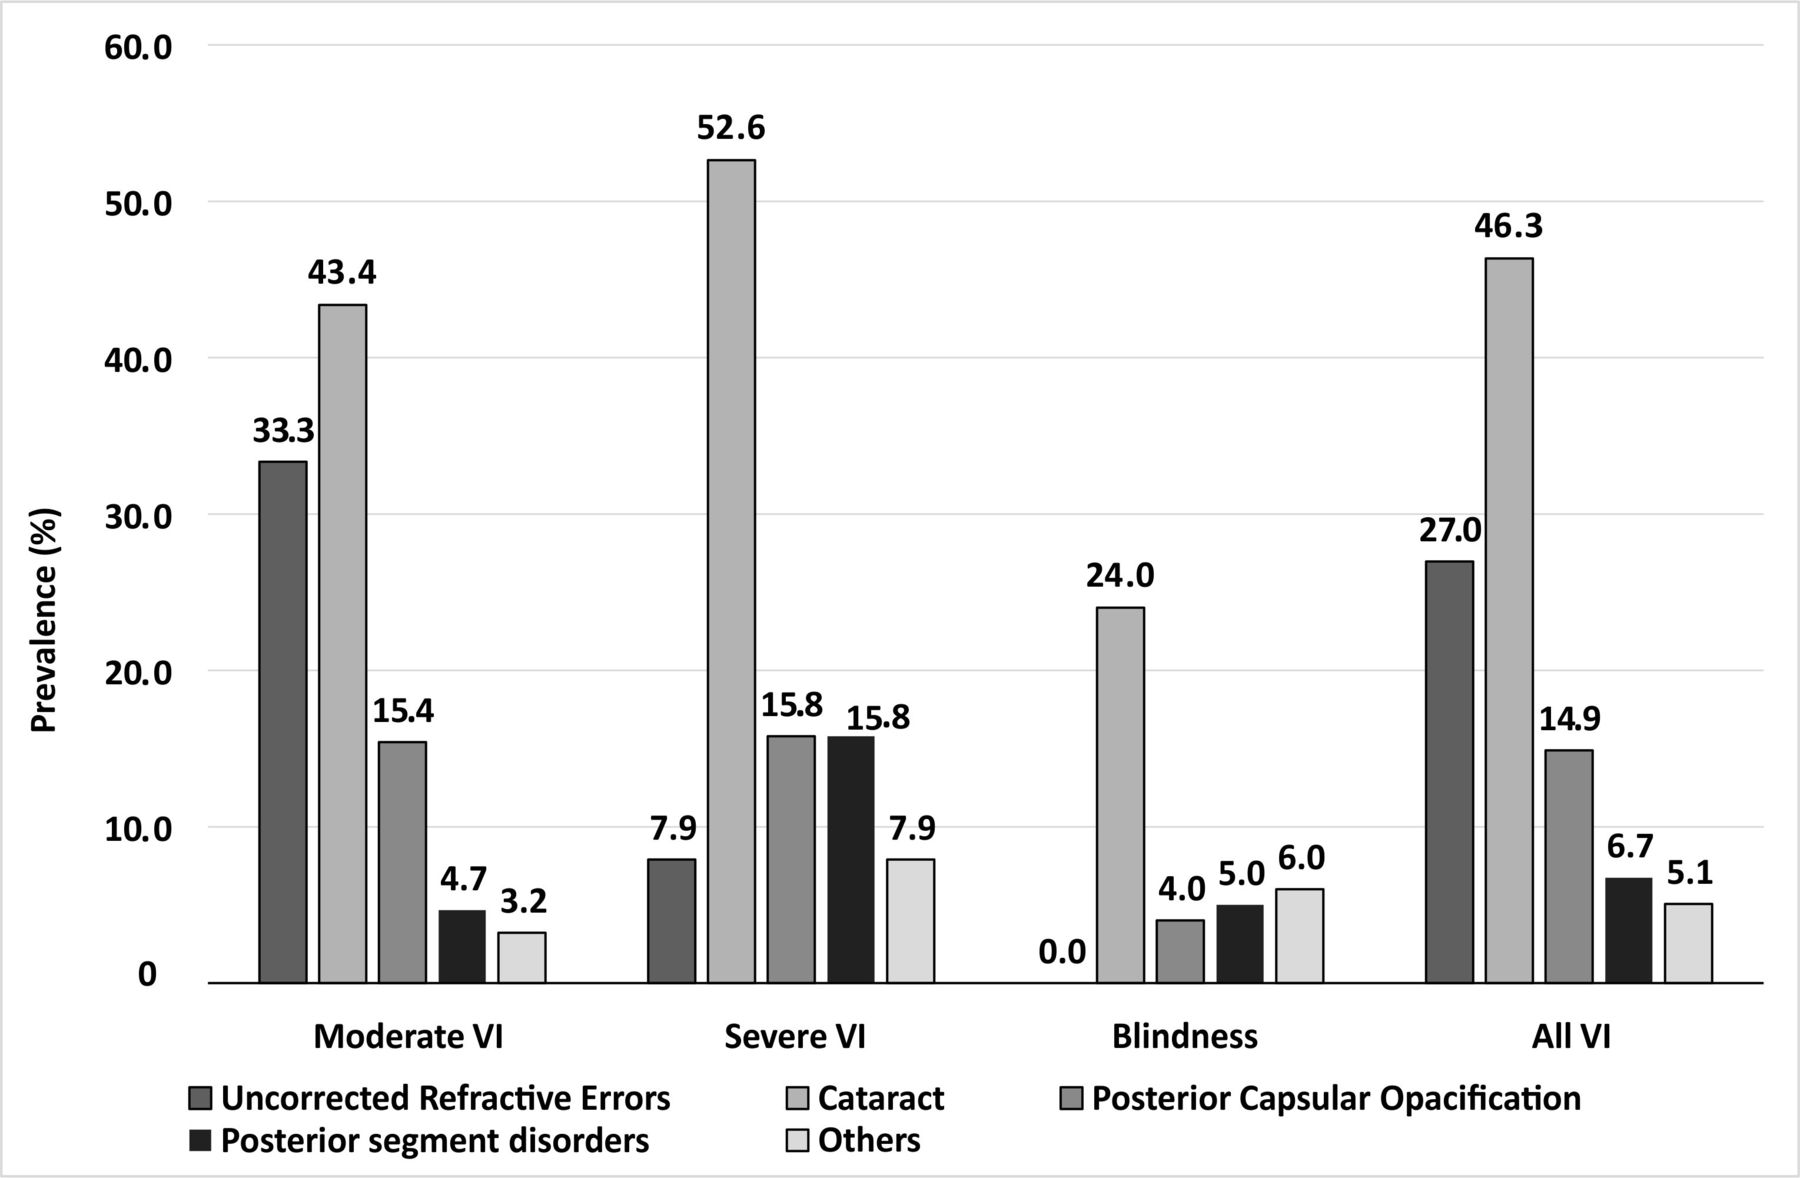
Based on presenting VA, the prevalence of VI was 30.1% (95% CI 27.5 to 32.8), which included moderate VI in 279 (23.6%) participants (95% CI 21.1 to 26.1), severe VI in 38 (3.2%) participants (95% CI 2.3 to 4.4), and blindness in 39 (3.3%) participants (95% CI 2.4 to 4.5) (table 2). Using a better level of cut-off and defining VI as presenting VA worse than 6/12 in the better eye, the prevalence of VI was 52.7% (95% CI 49.8 to 55.6) (table 2). The leading cause of VI was cataract (46.4%, n=165), followed by URE (27.0%, n=96) and PCO (14.9%, n=53). Posterior segment disease was a cause of VI in 6.5% (n=23) of the cases and included age-related macular degeneration (n=9), optic atrophy (n=7), diabetic retinopathy (n=1) and other retinal conditions (n=7). Overall, 88.2% of the VIs were either treatable or correctable (table 3). The causes of VI stratified by categories of VI are shown in figure 1.
Categories of visual impairment (n=356) among the elderly in residential care
Distribution and prevalence of causes of visual impairment (n=356) among the elderly

Distribution of causes stratified by categories of visual impairment (VI) (n=356).
VI and associations
In multivariate logistic regression analysis, those aged 80 years and older had higher odds of VI (OR: 1.70; 95% CI 1.6 to 2.47) compared with their younger counterparts. Compared with those with no formal education, those with school education (OR: 0.35; 95% CI 0.25 to 0.49) or higher education (OR: 0.21; 95% CI 0.13 to 0.35) had lower odds of VI. When compared with those residing in private homes, those living in free homes (OR: 1.51; 95% CI 1.00 to 2.30) had higher odds of VI. VI was more common in those with shorter length of stay in the homes. Compared with those living in residential care for less than 5 years, those who resided for 5–9 years had similar odds of VI (OR: 0.82; 95% CI 0.56 to 1.20), while those residing for 10 years or more had lower odds of VI (OR: 0.46; 95% CI 0.30 to 0.72). Compared with the elderly who were independently mobile, those with mobility with assistance (OR: 1.44; 95% CI 1.06 to 2.16) and those who were immobile/bedridden (OR: 3.02; 95% CI 1.91 to 4.80) had significantly higher odds of VI. Smoking status, alcohol consumption, gender and heart disease were not associated with VI. Those reported to have diabetes had lower odds of VI (OR: 0.68; 95% CI 0.49 to 0.96). The odds were also lower for those who self-reported hypertension (OR: 0.67; 95% CI 0.50 to 0.88) (table 4).
Association of visual impairmentwith sociodemographic characteristics and systemic conditions (multiple logistic regression analysis) (n=1182)
Discussion
Nearly one-third of the elderly individuals living in homes for the aged centres in Hyderabad had bilateral presenting vision worse than 6/18 and 52% had bilateral presenting VA of 6/12 or worse. Furthermore, over 3% were blind. A large proportion of this VI (88%) was avoidable with either cataract surgery, glasses or laser treatment (for posterior capsule opacification). We previously reported a higher prevalence of VI (56.7% vs 30% in the present study) in residential care homes in Prakasam district in India in 2012.18 This difference could be due to a few factors. First, Prakasam is a rural district and access to eye care services may be even more limited compared with the urban location of the present study. Second, there has been an expansion of eye care services in the region since the previous research was conducted and more residents are likely to have received care, leading to a lower prevalence. However, the burden of vision loss remains high and needs to be addressed.
Studies done among the elderly institutionalised populations from other parts of the world report large variability in the prevalence and causes of VI. The prevalence of VI is higher in studies reported from developing countries when compared with those in developed countries. For example, using a similar definition for VI, a study among the elderly in residential care in Nepal reported an overall prevalence of 31.9%, which was higher than what we found in this study.22 Using the <6/12 definition, the prevalence of VI among the elderly in residential care in Singapore and Australia was 46.4% and 41.5%, respectively, compared with 51.5% in the present study. This difference in the prevalence can be attributed to the mean age of the participants in these studies and due to other factors.8 14 Few studies in the USA have reported the prevalence of VI among those in residential care. Tielsch et al 23 in 1995 reported a very low prevalence of VI (15.2%), and Owsley et al 15 reported that over 57% of those examined had VI. However, Tielsch et al included all individuals in residential care, including those aged 40 years and older, whereas Owsley et al included participants aged 55 and older. Using the same definition <6/12 definition for VI, West et al in 2003 reported a 38% prevalence of VI among nursing home residents in the USA, and this prevalence declined to 29% after refractive correction.24
The two most common causes of VI were cataract and URE, a finding that is common to almost all population-based prevalence surveys in adults.18 Of note, PCO was the third leading cause of VI and this was a novel finding in our study. One explanation is the high rate of cataract surgery in Hyderabad, resulting in large numbers of elderly who are pseudophakic. Access to a Nd:YAG (Yttrium Aluminum Garnet) laser may not be simple, and many in the home for the aged do not receive routine eye care, and thus easy-to-manage cases of PCO remain unattended. One possible solution is the development and wider use of portable YAG laser for treating PCO in elderly homes. This may be necessary as poor mobility, poor systemic health and access to care remain major barriers to the uptake of services in the elderly. The elderly with poor mobility were at a higher risk for VI, as has been reported in other studies done in nursing homes.18 25 26 This could either be a risk factor or it could be a cause of VI as those with poor vision are less mobile.
The elderly with poor mobility cannot independently attend eye examinations, and hence a higher prevalence of VI was an expected finding. Access to care is likely an important factor in determining who has VI in these facilities. Residents in private homes had better visual status compared with those living in aided/partially subsidised care, and even better vision than those in free homes. This suggests that those with more resources are more likely to access eye care. ‘Homes for the aged’ in India lack regulatory oversight, leading to considerable variation in services provided. There are often no standard operating procedures in these homes, and no state-wide regulations requiring regular eye examinations.
As expected, age was a major risk factor of VI. However, gender was not associated with the prevalence of VI, which is in contrast to what is reported in the recent Global Burden of Disease studies and other studies from India.2 27 Our earlier study in elderly people in Prakasam district also did not find a significant association between VI and gender.18 It may be that the overall effect of being institutionalised levels the playing field in terms of access to care, and therefore men are equally as likely as women to have VI. Those with diabetes and hypertension were less likely to have VI, and there was no significant association between smoking, alcohol consumption and VI. The most likely explanation is ‘survival bias’, where those elderly individuals with more serious morbidity from these conditions either never entered the homes or were more likely to die after entry, leaving the more healthy ones in the homes. It is also possible that those with diabetes and hypertension are more likely to attend health checks and also eye check-up. Also, home authorities may be biased about admitting individuals with significant morbidity, which may impact the resources available to them. Nursing homes and rehabilitation centres would be more likely to have a higher burden of severe disease than the homes for the aged centres.
Our study is one of the most comprehensive eye health studies done among the elderly in India. The inclusion of a large number of ‘homes for the aged’ as well as a large number of individuals examined combined with the high response rate are important strengths of our study. Of the total number of homes in Hyderabad, 60% participated in our study. Our inability to carry out dilated fundus examination may have led to an underestimation of the prevalence of posterior segment disease especially in cases of dense cataract. While we took fundus images to help in making an accurate diagnosis of the posterior segment disorders, some of these images were not gradable due to cataract and other media opacities.
In conclusion, we found that the elderly individuals living in ‘homes for the aged’ in Hyderabad have a high burden of treatable or correctable vision loss. The results likely can be extrapolated to other urban locations in India. Strategies are needed to reach out to this elderly and vulnerable population, to implement vision screening, and to provide eye care. As the Indian population ages, there will be an increasing burden of vision loss in these homes. Screening for vision loss in ‘homes for the aged’ should become standard practice similar to that of school screening programmes to ensure that this vulnerable population does not suffer due to needless vision loss in their ‘sunset’ years of life.
Acknowledgments
The authors thank the individuals for their participation in the study. Mr Shashank Yellapragada is acknowledged for his assistance in data collection. Ms Muni Rajya Lakshmi is acknowledged for her support with data management. The authors thank Professor Jill Keeffe for her input on earlier versions of the manuscript and Ms Neha Hassija for her language input.
References
Footnotes
RCK and DSF contributed equally.
Contributors SM conceived the idea, designed and conducted the study, analysed the data, and wrote the manuscript. NRB, RC, TRK, SBM and MB are involved in data collection. RY assisted in data management. RCK and DF reviewed the earlier version of the manuscript and provided intellectual input.
Funding This work was supported by Wellcome Trust/DBT India Alliance Fellowship (IA/CPHE/14/1/501506) awarded to SM and Hyderabad Eye Research Foundation (HERF), India.
Competing interests None declared.
Patient consent for publication Not required.
Ethics approval The study protocol was approved by the Institutional Review Board of the Hyderabad Eye Research Foundation, L V Prasad Eye Institute, Hyderabad. The study was carried out in accordance with the Declaration of Helsinki.
Provenance and peer review Not commissioned; externally peer reviewed.
Data availability statement Data are available upon reasonable request.
Linked Articles
- At a glance